You are not logged in.
This means you
CAN ONLY VIEW reports that were published prior to Monday, April 14, 2025.
You
MUST UPGRADE YOUR MEMBERSHIP if you want to see any current reports.
AFTER MARKET UPDATE - TUESDAY, JANUARY 5TH, 2010
Previous After Market Report Next After Market Report >>>
|
|
|
|
DOW |
-11.94 |
10,572.02 |
-0.11% |
|
Volume |
1,192,071,790 |
+17% |
|
Volume |
2,421,350,890 |
+21% |
|
NASDAQ |
+0.29 |
2,308.71 |
+0.01% |
|
Advancers |
1,841 |
59% |
|
Advancers |
1,218 |
43% |
|
S&P 500 |
+3.53 |
1,136.52 |
+0.31% |
|
Decliners |
1,196 |
38% |
|
Decliners |
1,519 |
53% |
|
Russell 2000 |
-1.61 |
638.49 |
-0.25% |
|
52 Wk Highs |
401 |
|
|
52 Wk Highs |
206 |
|
|
S&P 600 |
-1.16 |
338.48 |
-0.34% |
|
52 Wk Lows |
0 |
|
|
52 Wk Lows |
7 |
|
|
 |
Mixed Close For Indices Amid Better Leadership and Influential Financial Gains
Adam Sarhan, Contributing Writer,
The major averages closed mixed after spending most of the session in the red as investors digested the latest round of mixed economic data. Volume, an important indicator of institutional sponsorship, was reported higher than Monday's totals which indicated large institutions were not aggressively dumping stocks. Advancers led decliners by a 3-to-2 ratio on the NYSE, but decliners narrowly led advancers by a 5-to-4 ratio on the Nasdaq exchange. There were 58 high-ranked companies from the CANSLIM.net Leaders List that made a new 52-week high and appeared on the CANSLIM.net BreakOuts Page, slightly lower than the total of 63 issues that appeared on the prior session. New 52-week highs solidly outnumbered new 52-week lows on the NYSE and on the Nasdaq exchange while new lows remained in the single digits.
There were two important economic data points that were released today: factory orders and pending home sales. First, the good news, the Commerce Department said that factory orders in November rose +1.1% which more than doubled the Street's estimate for a +0.4% increase. The stronger than expected report reiterated healthy manufacturing data released on Monday from both the US and China. The report showed that demand for steel, computers, and chemicals all remained strong which bodes well for the ongoing economic recovery.
Elsewhere, the National Association of Realtors said pending home sales plunged -16% in November, which was the lowest reading since June and fell short of the Street's lowest estimate. Pending home sales are defined as the number of buyers who agreed to purchase previously occupied homes. A pending sale is one in which a contract was signed, but not closed. It is important to note that the index is used as a leading indicator of existing home sales, not new home sales. The mixed economic data made it difficult for investors to ascertain the health of the economy. That said, many are still waiting for the month of December's official jobs report which is slated to be released before Friday's opening bell.
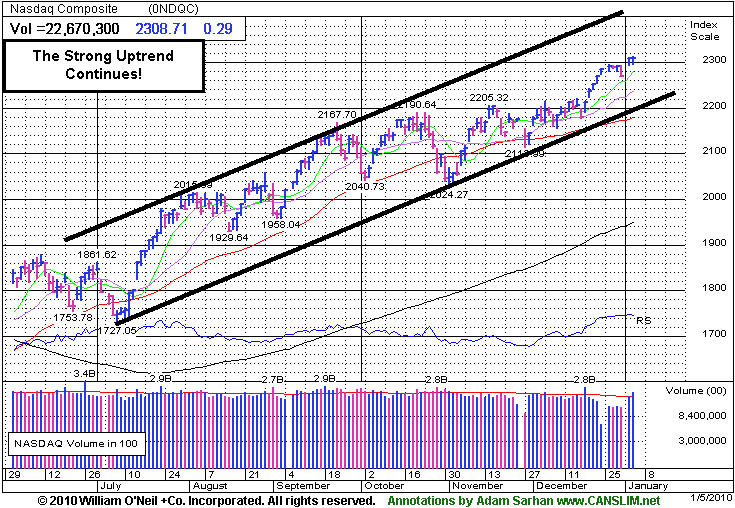
Market Action- Price & Volume Remains Healthy
Stocks remain strong as they managed to brush off the negative housing data and close near their intra-day highs on Tuesday. The current rally is in the middle of its 44th week (since the March 2009 lows) and on virtually all accounts looks strong. In addition, most bull markets historically lasted for approximately 36 months, so the fact that we are beginning our 10th month suggests we have more room to go. The Dow Jones Industrial Average, small cap Russell 2000 Index, S&P 500 Index and Nasdaq Composite and NYSE Composite indices are all trading near their respective 2009 highs which also bodes well for this rally. Leadership is beginning to expand which is a welcomed sign, and ideally it will continue to expand over the next few weeks as the major averages continue advancing.
PICTURED: The Nasdaq Composite Index closed higher with a gain on above average volume on Tuesday.
|
|
|
 |
Financial Group's Latest Gains Helping Overall Market Outlook Grow Brighter
Kenneth J. Gruneisen - Passed the CAN SLIM® Master's Exam
The financial sector posted additional gains on Tuesday, and the Bank Index ($BKX +2.24%) and Broker/Dealer Index ($XBD +0.71%) showed more signs of strengthening. Commodity-linked areas also were among the session's best gainers as the Gold & Silver Index ($XAU +1.15%) and Oil Services Index ($OSX +2.06%) rose, out pacing the Integrated Oil Index ($XOI +0.59%). Modest gains from the Retail Index ($RLX +0.47%) and Networking Index ($NWX +0.55%) helped the market averages have a slightly positive bias, but the Internet Index ($IIX +0.03%) and Semiconductor Index ($SOX +0.09%) basically held their ground for the day. Meanwhile, weakness in the Healthcare Index ($HMO -0.54%) and Biotechnology Index ($BTK -0.19%) created a slight drag on the market.
Charts courtesy www.stockcharts.com
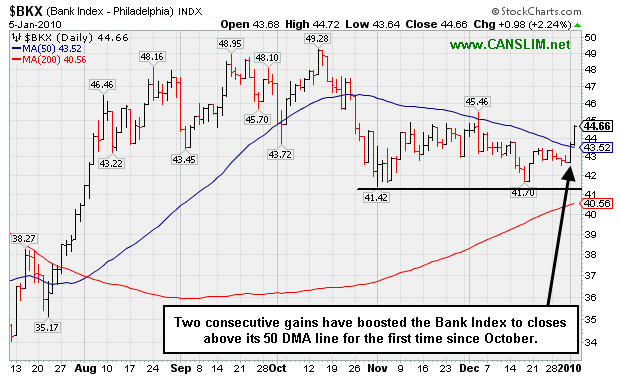
PICTURED: The Bank Index ($BKX +2.24%) has started the new year with 2 consecutive gains which helped it rally above its 50-day moving average (DMA) line for the first time since October. Not long ago, this index was nearly threatening to undercut prior chart lows in the $41 area, weakness which might have been a more ominous sign. Weakness in the financial indexes in the latter months of 2009 had raised concerns that the broader market was also due to spend time consolidating. This near-term strength is a very welcome improvement this week that certainly has helped the overall market outlook. The financial group is a reliable leading indicator. Longtime readers of this commentary know that the financial group topped first in 2007 and then led the way down. Financial shares also helped lead the recovery from the March 2009 lows.
| Oil Services |
$OSX |
206.65 |
+4.18 |
+2.06% |
+6.02% |
| Healthcare |
$HMO |
1,515.00 |
-8.30 |
-0.54% |
+2.86% |
| Integrated Oil |
$XOI |
1,106.98 |
+6.47 |
+0.59% |
+3.63% |
| Semiconductor |
$SOX |
366.42 |
+0.34 |
+0.09% |
+1.81% |
| Networking |
$NWX |
237.72 |
+1.30 |
+0.55% |
+2.88% |
| Internet |
$IIX |
237.00 |
+0.08 |
+0.03% |
+1.34% |
| Broker/Dealer |
$XBD |
119.28 |
+0.84 |
+0.71% |
+3.68% |
| Retail |
$RLX |
413.03 |
+1.92 |
+0.47% |
+0.46% |
| Gold & Silver |
$XAU |
176.02 |
+2.00 |
+1.15% |
+4.62% |
| Bank |
$BKX |
44.66 |
+0.98 |
+2.24% |
+4.57% |
| Biotech |
$BTK |
953.37 |
-1.78 |
-0.19% |
+1.19% |
|
|
|
 |
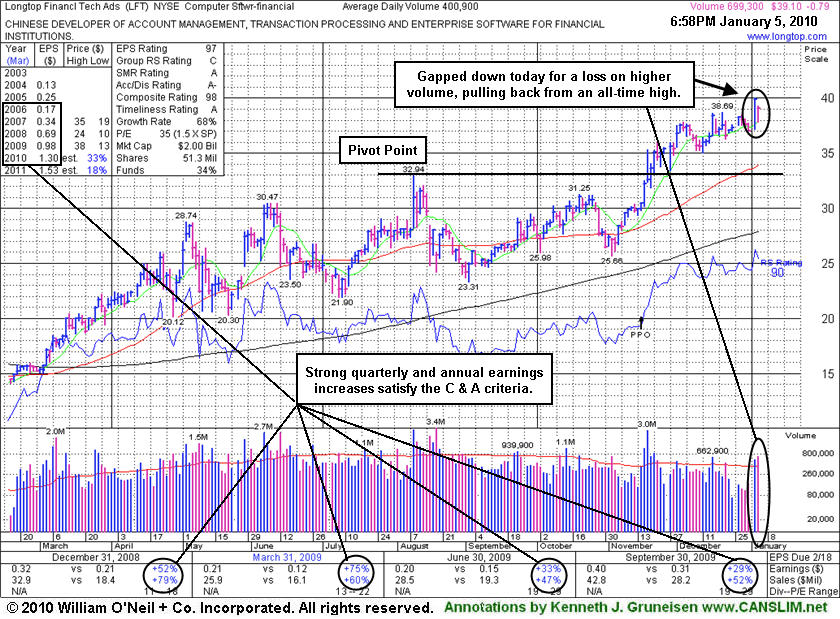
Gap Down From All-Time High For Extended Leader
Kenneth J. Gruneisen - Passed the CAN SLIM® Master's Exam
Longtop Financl Tech Ads (LFT -$0.79 or -1.98% to $39.10) suffered a loss on higher volume today after gapping down, but it ended near its session high. Its prior gain with above average volume for a new all-time high had helped it get extended after recently rising from a choppy 14-week base. It is trading more than +5% above its pivot point and above its "max buy" price, so disciplined investors would avoid chasing it. Its Up/Down Volume Ratio of 2.3 is an unbiased sign of recent accumulation taking place. Recent highs and its 50-day moving average line are now coinciding in the $33 area and defining an important support level to watch.
A proposed offering of additional shares on 11/16/09 seems well received by the market. Its fundamentals remain strong. The number of top-rated funds owning an interest in its shares rose from 20 funds in Dec '08 to 55 funds in Sept '09, which is reassuring concerning the I criteria. It has reported strong annual and quarterly earnings increases (good concerning the C & A criteria) backed by strong sales revenues increases. Return on Equity of +20% is above the +17% guideline. Upward progress can often be hindered by additional share offerings for the near-term, yet institutional investors typically increase their interest through the process. LFT was first featured at $22.19 on Thursday, April 02, 2009 in the CANSLIM.net Mid Day Breakouts Report (read here).
|
|
|
Color Codes Explained :
Y - Better candidates highlighted by our
staff of experts.
G - Previously featured
in past reports as yellow but may no longer be buyable under the
guidelines.
***Last / Change / Volume quote data in this table corresponds with the timestamp on the note***
Symbol/Exchange
Company Name
Industry Group |
Last |
Chg. |
Vol
% DAV |
Date Featured |
Price Featured |
Latest Pivot Point
Featured |
Status |
| Latest Max Buy Price |
ARST
-
|
$28.41
|
-0.32
|
512,810
102% DAV
503,600
|
9/1/2009
(Date
Featured) |
$19.91
(Price
Featured) |
PP = $27.20 |
G |
| MB = $28.56 |
Most Recent Note - 1/5/2010 4:31:02 PM
G - Small loss today on average volume. Its gap up and considerable gain on 1/04/10 triggered a technical buy signal as it blasted above its pivot point and "max buy" levels to new all-time highs with volume more than 3 times average. Color code was changed to green as it quickly got extended from its latest 8 week base. ARST was first featured in yellow at $19.91 in the 9/01/09 mid-day report with an annotated daily graph (read here).
>>> The latest Featured Stock Update with an annotated graph appeared on 1/4/2010. click here.
|
|
C
A
S
I |
News |
Chart |
SEC
View all notes Alert
me of new notes
Company
Profile
|
ASIA
-
|
$28.88
|
-2.51
|
3,422,782
274% DAV
1,248,900
|
12/24/2009
(Date
Featured) |
$31.05
(Price
Featured) |
PP = $32.40 |
G |
| MB = $34.02 |
Most Recent Note - 1/5/2010 4:33:03 PM
G - Gapped down today and suffered a damaging loss on heavy volume, violating recent chart lows and raising concerns. Color code was changed to green due to the abrupt weakness that led to deterioration under the low end of its very tight trading range of the past 4 weeks. Its 50 DMA line (now $26.69) is the next important support level to watch. A technical buy signal did not occur since its advanced "3 weeks tight" pattern was recently noted. Traded up as much as +68.13% since first featured in the August 2009 CANSLIM.net News (read here).
>>> The latest Featured Stock Update with an annotated graph appeared on 12/23/2009. click here.
|
|
C
A
S
I |
News |
Chart |
SEC
View all notes Alert
me of new notes
Company
Profile
|
BIDU
- NASDAQ
Baidu Inc Ads
INTERNET - Internet Information Providers
|
$405.90
|
-4.13
|
1,548,220
88% DAV
1,752,100
|
9/8/2009
(Date
Featured) |
$351.80
(Price
Featured) |
PP = $440.00 |
Y |
| MB = $462.00 |
Most Recent Note - 1/5/2010 4:38:42 PM
G - Loss today on near average volume was its 5th consecutive decline while edging further below its 50 DMA line. Color code is changed to green based on recent weakness, meanwhile, gains back above its 50 DMA line are needed for its outlook to improve. Technically, it has built a sloppy base over the past 10 weeks, and gains above its previously cited pivot point with at least +50% above average volume could trigger a new buy signal. BIDU traded up as much as +23% from its price when featured in yellow in the 9/08/09 Mid-Day BreakOuts Report (read here).
>>> The latest Featured Stock Update with an annotated graph appeared on 12/21/2009. click here.
|
|
C
A
S
I |
News |
Chart |
SEC
View all notes Alert
me of new notes
Company
Profile
|
CAAS
- NASDAQ
China Automotive Systems
AUTOMOTIVE - Auto Parts
|
$23.80
|
+2.95
|
3,660,481
467% DAV
784,000
|
11/30/2009
(Date
Featured) |
$18.84
(Price
Featured) |
PP = $17.62 |
G |
| MB = $18.50 |
Most Recent Note - 1/5/2010 4:40:26 PM
G - Gapped up today and hit a new all-time high with volume more than 4 times average behind its considerable gain. The choppy consolidation over the past 5 weeks involved a -28% pullback, so this was not a sound "flat base" of the minimum length. However, no overhead supply remains and it could go on to produce a "climax run", especially considering its small float of only 4.86 million shares (S criteria). It found prompt support following a sharp pullback to its short-term average line. The Chinese maker of power steering systems had negated most of its bullish action since featured in the 11/30/09 mid-day report (read here).
>>> The latest Featured Stock Update with an annotated graph appeared on 12/29/2009. click here.
|
|
C
A
S
I |
News |
Chart |
SEC
View all notes Alert
me of new notes
Company
Profile
|
CACC
- NASDAQ
Credit Acceptance Corp
FINANCIAL SERVICES - Credit Services
|
$43.80
|
-0.04
|
70,964
169% DAV
41,900
|
9/29/2009
(Date
Featured) |
$33.48
(Price
Featured) |
PP = $37.10 |
G |
| MB = $38.96 |
Most Recent Note - 1/5/2010 4:42:59 PM
G - High volume without further progress today may be considered a sign of "churning" or distributional action while the stock is at all-time highs and extended from its prior base. Previous chart highs near $35-37 are an important support level to watch. The Finance - Consumer/Commercial Loans firm has maintained a great track record of annual and quarterly sales revenues and earnings increases. It was featured on 9/29/09 in yellow in the mid-day report (read here).
>>> The latest Featured Stock Update with an annotated graph appeared on 12/22/2009. click here.
|
|
C
A
S
I |
News |
Chart |
SEC
View all notes Alert
me of new notes
Company
Profile
|
CRM
- NYSE
Salesforce.com Inc
INTERNET - Internet Software & Services
|
$74.50
|
-0.32
|
1,985,546
115% DAV
1,722,900
|
12/18/2009
(Date
Featured) |
$67.32
(Price
Featured) |
PP = $67.82 |
G |
| MB = $71.21 |
Most Recent Note - 1/5/2010 4:45:59 PM
G - Stubbornly holding its ground for the past week after rallying near its $75 all-time high. It is now extended from its prior base after rising from a 5-week flat base above important support at its 50 DMA line. Its 12/18/09 gain with more than +50% above average volume triggered a technical buy signal.
>>> The latest Featured Stock Update with an annotated graph appeared on 12/18/2009. click here.
|
|
C
A
S
I |
News |
Chart |
SEC
View all notes Alert
me of new notes
Company
Profile
|
CTRP
- NASDAQ
Ctrip.com Intl Ltd Adr
LEISURE - Resorts & Casinos
|
$76.55
|
+4.05
|
1,192,553
108% DAV
1,100,000
|
12/1/2009
(Date
Featured) |
$75.38
(Price
Featured) |
PP = $73.91 |
Y |
| MB = $77.61 |
Most Recent Note - 1/5/2010 4:57:02 PM
Y - Considerable gain today on average volume, finishing near the session high and near all-time high closes. Trading in a tight range above its 50 DMA line for about 5 weeks, a new pivot point is cited and its color code is changed to yellow. Gains above the pivot with at least +50% above average volume are needed to trigger a fresh technical buy signal. Featured on 12/01/09 in yellow in the mid-day report (read here). Fundamentally, its sales revenues and earnings increases have shown acceleration in the 3 most recent quarterly comparisons and rose above the +25% guideline. Based on weak technical action it was dropped from the Featured Stocks list on 6/10/08, when it closed at $49.84, yet it has rebounded very impressively from subsequent lows in the $16 area.
>>> The latest Featured Stock Update with an annotated graph appeared on 12/30/2009. click here.
|
|
C
A
S
I |
News |
Chart |
SEC
View all notes Alert
me of new notes
Company
Profile
|
GMCR
- NASDAQ
Green Mtn Coffee Roastrs
FOOD & BEVERAGE - Processed & Packaged Goods
|
$82.78
|
+1.48
|
1,828,158
118% DAV
1,552,700
|
12/28/2009
(Date
Featured) |
$77.49
(Price
Featured) |
PP = $76.50 |
G |
| MB = $80.33 |
Most Recent Note - 1/5/2010 5:45:45 PM
G - Gain today for a new all-time high. Considerable gain on 12/28/09 prompted its re-appearance in yellow in the mid-day report (read here) as it rose above the pivot point of a 10-week "double bottom" type base on +62% above average volume, confirming a new technical buy signal. Based on weak action it was dropped from the Featured Stocks list on 12/01/09. Its 12/18/09 gain on heavy volume repaired its prior 50 DMA line violation, helping its outlook improve.
>>> The latest Featured Stock Update with an annotated graph appeared on 12/28/2009. click here.
|
|
C
A
S
I |
News |
Chart |
SEC
View all notes Alert
me of new notes
Company
Profile
|
HEAT
-
|
$15.96
|
+0.10
|
1,523,062
154% DAV
989,200
|
11/17/2009
(Date
Featured) |
$12.00
(Price
Featured) |
PP = $12.61 |
G |
| MB = $13.24 |
Most Recent Note - 1/5/2010 5:49:30 PM
G - Held its ground today after tallying a considerable gain on 1/04/10 with slightly above average volume. Recently consolidating well above prior chart highs and its 50 DMA line coinciding in the $12.60 area as important support levels. The investment system rules say a stock should be held a minimum of 8 weeks after rising more than +20% in the first 2-3 weeks from being bought. HEAT traded as much as +43.9% higher since first featured in yellow in the 11/17/09 mid-day report (read here) when technically rising from a "double bottom" base, reaching a new all-time high.
>>> The latest Featured Stock Update with an annotated graph appeared on 12/31/2009. click here.
|
|
C
A
S
I |
News |
Chart |
SEC
View all notes Alert
me of new notes
Company
Profile
|
LFT
-
|
$39.10
|
-0.79
|
702,436
175% DAV
400,900
|
11/17/2009
(Date
Featured) |
$31.77
(Price
Featured) |
PP = $33.04 |
G |
| MB = $34.69 |
Most Recent Note - 1/5/2010 5:50:29 PM
G - Gapped down today with a loss on higher volume negating much of its prior session's considerable gain for a new all-time high. It is extended from a sound buy point after recently rising from a choppy 14-week base. Its 50 DMA line and prior chart highs are initial support levels to watch. A proposed offering of additional shares on 11/16/09 seems well received by the market. Its fundamentals remain strong.
>>> The latest Featured Stock Update with an annotated graph appeared on 1/5/2010. click here.
|
|
C
A
S
I |
News |
Chart |
SEC
View all notes Alert
me of new notes
Company
Profile
|
PEGA
- NASDAQ
Pegasystems Inc
COMPUTER SOFTWARE & SERVICES - Business Software & Services
|
$34.70
|
-0.25
|
130,627
51% DAV
254,700
|
1/4/2010
(Date
Featured) |
$34.00
(Price
Featured) |
PP = $36.19 |
Y |
| MB = $38.00 |
Most Recent Note - 1/5/2010 5:51:22 PM
Y -Small loss today on light volume, still perched near all-time highs with no overhead supply remaining to act as resistance. Returned to the Featured Stocks page again with its fresh appearance in the new January 2010 issue of CANSLIM.net News (read here).
>>> The latest Featured Stock Update with an annotated graph appeared on 1/3/2010. click here.
|
|
C
A
S
I |
News |
Chart |
SEC
View all notes Alert
me of new notes
Company
Profile
|
VIT
-
|
$19.98
|
-0.01
|
598,135
121% DAV
495,900
|
12/24/2009
(Date
Featured) |
$20.07
(Price
Featured) |
PP = $21.17 |
Y |
| MB = $22.23 |
Most Recent Note - 1/5/2010 5:52:23 PM
Y - Hovering near all-time highs while working on the right side of a choppy 11-week base. Featured in yellow in the 12/24/09 mid-day report (read here). No overhead supply exists to act as resistance, however it did not yet rise above the pivot point cited with the volume needed to trigger a proper new technical buy signal, so patience and disciplined are needed. Following its steep ascent from its March low ($4.31), an additional public offering of shares on 7/10/09 coincided with a successful earlier test of 50 DMA support. Fundamentally, this high-ranked Computer - Tech Services firm's earnings and sales revenues increases have been above or at the +25% minimum guideline.
>>> The latest Featured Stock Update with an annotated graph appeared on 12/24/2009. click here.
|
|
C
A
S
I |
News |
Chart |
SEC
View all notes Alert
me of new notes
Company
Profile
|
|
|
|
THESE ARE NOT BUY RECOMMENDATIONS!
Comments contained in the body of this report are technical
opinions only. The material herein has been obtained
from sources believed to be reliable and accurate, however,
its accuracy and completeness cannot be guaranteed.
This site is not an investment advisor, hence it does
not endorse or recommend any securities or other investments.
Any recommendation contained in this report may not
be suitable for all investors and it is not to be deemed
an offer or solicitation on our part with respect to
the purchase or sale of any securities. All trademarks,
service marks and trade names appearing in this report
are the property of their respective owners, and are
likewise used for identification purposes only.
This report is a service available
only to active Paid Premium Members.
You may opt-out of receiving report notifications
at any time. Questions or comments may be submitted
by writing to Premium Membership Services 665 S.E. 10 Street, Suite 201 Deerfield Beach, FL 33441-5634 or by calling 1-800-965-8307
or 954-785-1121.
|
|
|


