You are not logged in.
This means you
CAN ONLY VIEW reports that were published prior to Friday, April 11, 2025.
You
MUST UPGRADE YOUR MEMBERSHIP if you want to see any current reports.
AFTER MARKET UPDATE - WEDNESDAY, JANUARY 6TH, 2010
Previous After Market Report Next After Market Report >>>
|
|
|
|
DOW |
+1.66 |
10,573.68 |
+0.02% |
|
Volume |
1,113,402,980 |
-7% |
|
Volume |
2,319,447,420 |
-4% |
|
NASDAQ |
-7.62 |
2,301.09 |
-0.33% |
|
Advancers |
1,810 |
58% |
|
Advancers |
1,221 |
43% |
|
S&P 500 |
+0.62 |
1,137.14 |
+0.05% |
|
Decliners |
1,208 |
39% |
|
Decliners |
1,502 |
53% |
|
Russell 2000 |
-0.54 |
637.95 |
-0.08% |
|
52 Wk Highs |
451 |
|
|
52 Wk Highs |
184 |
|
|
S&P 600 |
-0.33 |
338.15 |
-0.10% |
|
52 Wk Lows |
1 |
|
|
52 Wk Lows |
7 |
|
|
 |
Major Averages End Mixed Again On Quieter Volume
Adam Sarhan, Contributing Writer,
The major averages ended mixed again after a private report from ADP showed employers cut more jobs than expected last month and some Federal Reserve officials said they are willing to entertain the notion of more stimulus measures in 2010. Volume, an important indicator of institutional sponsorship, was reported lower than Tuesday's totals which indicated large institutions were not aggressively dumping stocks. Advancers led decliners by a 3-to-2 ratio on the NYSE, but decliners narrowly led advancers by a 5-to-4 ratio on the Nasdaq exchange. There were 57 high-ranked companies from the CANSLIM.net Leaders List that made a new 52-week high and appeared on the CANSLIM.net BreakOuts Page, slightly lower than the total of 58 issues that appeared on the prior session. New 52-week highs solidly outnumbered new 52-week lows on the NYSE and on the Nasdaq exchange, and new lows were again in the single digits.
Before Wednesday's opening bell, ADP Employer Services Inc., the country's largest private payrolls firm, said US employers slashed -84,000 jobs in December which fell short of the Street's estimate of -75,000. The ADP report usually sets the tone for the government's official non-farm payrolls report each month. At this point, economists believe that Friday's report will show payrolls were unchanged in December which will be the first month employment did not decline since the recession began two years ago.
At 10:00AM EST, the Institute for Supply Management (ISM) released a weaker than expected report on the service sector. Its non-manufacturing business index rose to 50.1, from 48.7 in the prior month. The reading topped the boom/bust level of 50 which shows growth but fell short of the 50.5 consensus. The ISM surveys nearly 400 firms from 60 sectors across the country which include: agriculture, construction, transportation, mining, communications, wholesale and retail trade. It is important to note that the service sector currently makes up approximately +90% of the economy and tends to be a good proxy for GDP.
At 2:00PM EST, the Federal Open Market Committee (FOMC) released the minutes of its last meeting in 2009. The minutes for the December 15-16 FOMC meeting showed that several Fed officials are open to the notion of further stimulus measures, if needed, in 2010. Fed governors and District presidents had different opinions on whether or not inflation was a concern at this point of the economic recovery, although they did agree that inflation currently is not a threat. The Fed modestly upgraded the overall economy and said that downside risks "diminished a bit further." The next Fed decision will be announced at 2:15PM on Wednesday, January 27, 2010.
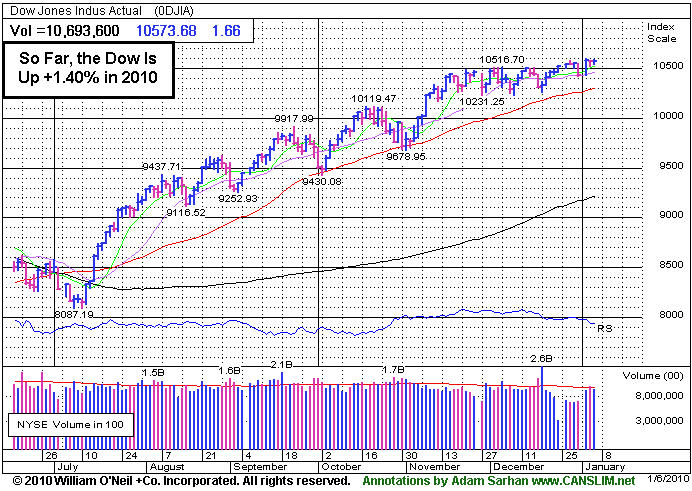
Stocks remain strong as investors digested the latest round of weaker than expected economic data. Friday's jobs report will likely set the stage for the next move in the market. Until then, expect investors to avoid putting on excessive risk as they await the jobs report for a better reading on the economy. The current rally is in the middle of it 44th week (since the March 2009 lows) and on all accounts still looks strong. In addition, most bull markets last for approximately 36 months, so the fact that we are beginning our 10th month suggests we have more room to go. The Dow Jones Industrial Average, small cap Russell 2000 Index, S&P 500 Index and Nasdaq Composite and NYSE Composite indices are all trading above their respective 2009 highs, which also bodes well for this rally. Leadership is beginning to expand which is a welcome sign, and ideally it will continue to expand over the next few weeks as the major averages continue advancing.
PICTURED: For the new year, the Dow Jones Industrial Average is up +1.4%. Getting off to a good start generally bodes well for the market, however investors should continue to monitor the major averages and the action in the market's leading stocks for the best read on the M criteria. Stay tuned to the daily CANSLIM.net reports to keep yourself well informed throughout 2010. We invite your feedback and any suggestions you may have on how CANSLIM.net can make your day-to-day application of the proven investment system easier. Please take time to use the inquiry form if there is anything you think we should know. Thank you!
|
|
|
 |
Commodity-linked, Medical, and Banking Shares Rise
Kenneth J. Gruneisen - Passed the CAN SLIM® Master's Exam
Commodity-linked groups were some of Wednesday's best gainers as the Gold & Silver Index ($XAU +2.69%) and Oil Services Index ($OSX +2.68%) posted solid gains, and the Integrated Oil Index ($XOI +0.58%) posted a modest gain. The Bank Index ($BKX +1.28%) posted another gain, continuing the recently noted improvement in the financial group which bodes well for the current rally. The Healthcare Index ($HMO +1.10%) and Biotechnology Index ($BTK +1.22%) also were positive influences. The Semiconductor Index ($SOX -0.02%) and Broker/Dealer Index ($XBD +0.03%) ended virtually unchanged and the Retail Index ($RLX +0.23%) edged slightly higher. Meanwhile, modest losses from the Internet Index ($IIX -0.70%) and Networking Index ($NWX -0.56%) created a drag on the tech-heavy Nasdaq Composite Index and the small-cap indices.
Charts courtesy www.stockcharts.com
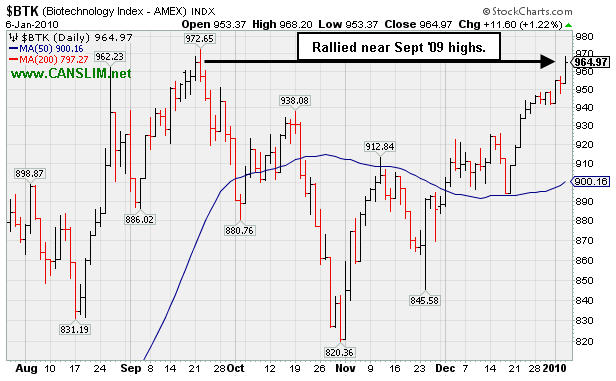
PICTURED: The Biotechnology Index ($BTK +1.22%) has rallied near its September 2009 high, a sign of strength that generally bodes well for individual equities in the biotech group.
| Oil Services |
$OSX |
212.19 |
+5.54 |
+2.68% |
+8.86% |
| Healthcare |
$HMO |
1,531.74 |
+16.74 |
+1.10% |
+3.99% |
| Integrated Oil |
$XOI |
1,113.43 |
+6.45 |
+0.58% |
+4.23% |
| Semiconductor |
$SOX |
366.34 |
-0.08 |
-0.02% |
+1.79% |
| Networking |
$NWX |
236.39 |
-1.33 |
-0.56% |
+2.31% |
| Internet |
$IIX |
235.34 |
-1.66 |
-0.70% |
+0.63% |
| Broker/Dealer |
$XBD |
119.31 |
+0.03 |
+0.03% |
+3.70% |
| Retail |
$RLX |
413.96 |
+0.93 |
+0.23% |
+0.69% |
| Gold & Silver |
$XAU |
180.76 |
+4.74 |
+2.69% |
+7.44% |
| Bank |
$BKX |
45.23 |
+0.57 |
+1.28% |
+5.90% |
| Biotech |
$BTK |
964.97 |
+11.60 |
+1.22% |
+2.42% |
|
|
|
 |
Add To Strong Winners And Always Manage Them Carefully
Kenneth J. Gruneisen - Passed the CAN SLIM® Master's Exam
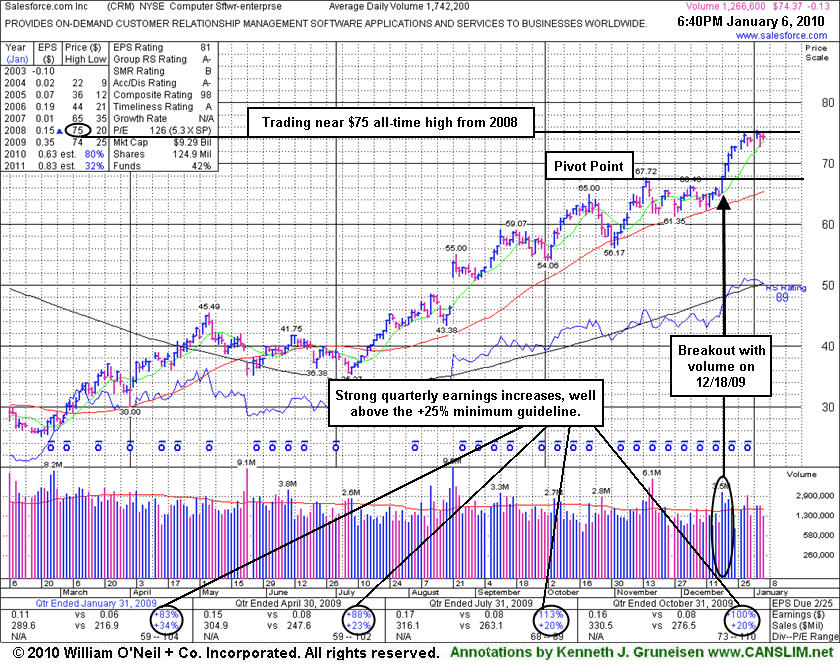
Salesforce.com, Inc. (CRM -$0.13 or -0.17% to $74.37) has been stubbornly holding its ground, perched very near its $75 all-time high from 2008. Prior chart highs in the $67 area are an important support level to watch now. A powerful rally into new all-time high territory with heavy volume would be a noteworthy sign of institutional buying demand. However, it is now extended from its latest sound 5-week flat base above important support at its 50-day moving average (DMA) line. Its 12/18/09 gain with more than +50% above average volume triggered a technical buy signal. For its 12/18/09 mid-day report appearance its color code was changed to yellow and a new pivot point based upon its 11/16/09 high plus 10 cents was noted. A convincing breakout above its prior chart high that day with at least +50% above average volume was all that it took to trigger the latest technical buy signal.
With the reassurance of additional heavy institutional buying (the I criteria) demand, add-on buying might be worth considering if it surges again. But be careful not to average your cost up too much by only buying smaller amounts at higher levels. On pullbacks, shares owned at a lower cost basis may be held, but always limit losses by selling the shares bought later if the stock falls -7% from your higher buy price.
|
|
|
Color Codes Explained :
Y - Better candidates highlighted by our
staff of experts.
G - Previously featured
in past reports as yellow but may no longer be buyable under the
guidelines.
***Last / Change / Volume quote data in this table corresponds with the timestamp on the note***
Symbol/Exchange
Company Name
Industry Group |
Last |
Chg. |
Vol
% DAV |
Date Featured |
Price Featured |
Latest Pivot Point
Featured |
Status |
| Latest Max Buy Price |
ARST
-
|
$28.15
|
-0.26
|
245,038
49% DAV
502,500
|
9/1/2009
(Date
Featured) |
$19.91
(Price
Featured) |
PP = $27.20 |
Y |
| MB = $28.56 |
Most Recent Note - 1/6/2010 6:04:14 PM
Y - Small losses on lighter volume have followed its considerable gain on 1/04/10 that had triggered a technical buy signal as it blasted above its pivot point with volume more than 3 times average. Color code is changed to yellow as it quietly consolidates under its "max buy" level.. ARST was first featured in yellow at $19.91 in the 9/01/09 mid-day report with an annotated daily graph (read here).
>>> The latest Featured Stock Update with an annotated graph appeared on 1/4/2010. click here.
|
|
C
A
S
I |
News |
Chart |
SEC
View all notes Alert
me of new notes
Company
Profile
|
ASIA
-
|
$28.68
|
-0.20
|
1,290,014
99% DAV
1,298,000
|
12/24/2009
(Date
Featured) |
$31.05
(Price
Featured) |
PP = $32.40 |
G |
| MB = $34.02 |
Most Recent Note - 1/6/2010 6:06:57 PM
G - Small loss on average volume today followed its damaging 1/05/10 gap down and loss on heavy volume that violated recent chart lows and raised concerns. Color code was changed to green due to the abrupt weakness that led to deterioration under the low end of its very tight trading range of the past 4 weeks. Its 50 DMA line (now $26.81) is the next important support level to watch. A technical buy signal did not occur since its advanced "3 weeks tight" pattern was recently noted. Traded up as much as +68.13% since first featured in the August 2009 CANSLIM.net News (read here).
>>> The latest Featured Stock Update with an annotated graph appeared on 12/23/2009. click here.
|
|
C
A
S
I |
News |
Chart |
SEC
View all notes Alert
me of new notes
Company
Profile
|
BIDU
- NASDAQ
Baidu Inc Ads
INTERNET - Internet Information Providers
|
$412.50
|
+6.60
|
2,342,023
133% DAV
1,758,100
|
9/8/2009
(Date
Featured) |
$351.80
(Price
Featured) |
PP = $440.00 |
G |
| MB = $462.00 |
Most Recent Note - 1/6/2010 6:21:47 PM
G - Gapped up today and posted a gain on higher volume than any session since 11/09/09, but it ended near the session low after encountering resistance at its 50 DMA line. Color code was changed to green based on recent weakness, meanwhile, gains back above its 50 DMA line are needed for its outlook to improve. Technically, it has built a sloppy base over the past 10 weeks, and gains above its previously cited pivot point with at least +50% above average volume could trigger a new buy signal. BIDU traded up as much as +23% from its price when featured in yellow in the 9/08/09 Mid-Day BreakOuts Report (read here).
>>> The latest Featured Stock Update with an annotated graph appeared on 12/21/2009. click here.
|
|
C
A
S
I |
News |
Chart |
SEC
View all notes Alert
me of new notes
Company
Profile
|
CAAS
- NASDAQ
China Automotive Systems
AUTOMOTIVE - Auto Parts
|
$23.04
|
-0.76
|
1,806,359
212% DAV
853,100
|
11/30/2009
(Date
Featured) |
$18.84
(Price
Featured) |
PP = $17.62 |
G |
| MB = $18.50 |
Most Recent Note - 1/6/2010 6:22:38 PM
G - After a small gap up and a new all-time high today it negatively reversed. Volume was more than 4 times average behind its considerable 1/05/10 gain for a new high. The choppy consolidation over the past 5 weeks involved a -28% pullback, so this was not a sound "flat base" of the minimum length. However, no overhead supply remains and it could go on to produce a "climax run", especially considering its small float of only 4.86 million shares (S criteria). It found prompt support following a sharp pullback to its short-term average line. The Chinese maker of power steering systems had negated most of its bullish action since featured in the 11/30/09 mid-day report (read here).
>>> The latest Featured Stock Update with an annotated graph appeared on 12/29/2009. click here.
|
|
C
A
S
I |
News |
Chart |
SEC
View all notes Alert
me of new notes
Company
Profile
|
CACC
- NASDAQ
Credit Acceptance Corp
FINANCIAL SERVICES - Credit Services
|
$43.90
|
+0.10
|
18,186
42% DAV
42,900
|
9/29/2009
(Date
Featured) |
$33.48
(Price
Featured) |
PP = $37.10 |
G |
| MB = $38.96 |
Most Recent Note - 1/6/2010 6:24:04 PM
G - Holding its ground perched at all-time highs, extended from its prior base. Previous chart highs near $35-37 are an important support level to watch. The Finance - Consumer/Commercial Loans firm has maintained a great track record of annual and quarterly sales revenues and earnings increases. It was featured on 9/29/09 in yellow in the mid-day report (read here).
>>> The latest Featured Stock Update with an annotated graph appeared on 12/22/2009. click here.
|
|
C
A
S
I |
News |
Chart |
SEC
View all notes Alert
me of new notes
Company
Profile
|
CRM
- NYSE
Salesforce.com Inc
INTERNET - Internet Software & Services
|
$74.37
|
-0.13
|
1,280,537
74% DAV
1,742,200
|
12/18/2009
(Date
Featured) |
$67.32
(Price
Featured) |
PP = $67.82 |
G |
| MB = $71.21 |
Most Recent Note - 1/6/2010 6:27:24 PM
G - Still stubbornly holding its ground, perched near its $75 all-time high. It is now extended from its prior base after rising from a 5-week flat base above important support at its 50 DMA line. Its 12/18/09 gain with more than +50% above average volume triggered a technical buy signal.
>>> The latest Featured Stock Update with an annotated graph appeared on 1/6/2010. click here.
|
|
C
A
S
I |
News |
Chart |
SEC
View all notes Alert
me of new notes
Company
Profile
|
CTRP
- NASDAQ
Ctrip.com Intl Ltd Adr
LEISURE - Resorts & Casinos
|
$74.93
|
-1.62
|
851,517
77% DAV
1,099,500
|
12/1/2009
(Date
Featured) |
$75.38
(Price
Featured) |
PP = $73.91 |
Y |
| MB = $77.61 |
Most Recent Note - 1/6/2010 6:29:10 PM
Y - Consolidating near all-time highs in a tight range above its 50 DMA line for about 5 weeks. A new pivot point was cited and its color code was changed to yellow. Gains above the pivot with at least +50% above average volume are needed to trigger a fresh technical buy signal. Featured on 12/01/09 in yellow in the mid-day report (read here). Fundamentally, its sales revenues and earnings increases have shown acceleration in the 3 most recent quarterly comparisons and rose above the +25% guideline. Based on weak technical action it was dropped from the Featured Stocks list on 6/10/08, when it closed at $49.84, yet it has rebounded very impressively from subsequent lows in the $16 area.
>>> The latest Featured Stock Update with an annotated graph appeared on 12/30/2009. click here.
|
|
C
A
S
I |
News |
Chart |
SEC
View all notes Alert
me of new notes
Company
Profile
|
GMCR
- NASDAQ
Green Mtn Coffee Roastrs
FOOD & BEVERAGE - Processed & Packaged Goods
|
$82.94
|
+0.16
|
1,007,554
64% DAV
1,572,000
|
12/28/2009
(Date
Featured) |
$77.49
(Price
Featured) |
PP = $76.50 |
G |
| MB = $80.33 |
Most Recent Note - 1/6/2010 6:32:57 PM
G - Small gain today on light volume for a new high close, extended from its latest base. Prior chart highs in the $76-77 area are important support levels to watch now. Based on weak action it was dropped from the Featured Stocks list on 12/01/09.
>>> The latest Featured Stock Update with an annotated graph appeared on 12/28/2009. click here.
|
|
C
A
S
I |
News |
Chart |
SEC
View all notes Alert
me of new notes
Company
Profile
|
HEAT
-
|
$17.09
|
+1.13
|
2,523,831
248% DAV
1,016,300
|
1/6/2010
(Date
Featured) |
$17.19
(Price
Featured) |
PP = $17.27 |
Y |
| MB = $18.13 |
Most Recent Note - 1/6/2010 6:35:41 PM
Y - Hit a new all-time high today with a considerable gain on more than twice average volume. It was a new high close, but finished just under its pivot point. Color code was changed to yellow and a new pivot point was cited after it formed a short "ascending base" type pattern. A gain above its new pivot point with heavy volume could confirm a new technical buy signal. Recent chart lows near $14 define an important support level now. HEAT traded as much as +45.9% higher since first featured in yellow in the 11/17/09 mid-day report (read here) when technically rising from a "double bottom" base, reaching a new all-time high.
>>> The latest Featured Stock Update with an annotated graph appeared on 12/31/2009. click here.
|
|
C
A
S
I |
News |
Chart |
SEC
View all notes Alert
me of new notes
Company
Profile
|
LFT
-
|
$38.62
|
-0.48
|
501,061
123% DAV
408,100
|
11/17/2009
(Date
Featured) |
$31.77
(Price
Featured) |
PP = $33.04 |
G |
| MB = $34.69 |
Most Recent Note - 1/6/2010 6:37:11 PM
G - Gapped up slightly today but reversed and ended with a loss. It is extended from a sound buy point after recently rising from a choppy 14-week base. Its 50 DMA line and prior chart highs are initial support levels to watch. A proposed offering of additional shares on 11/16/09 seems well received by the market. Its fundamentals remain strong.
>>> The latest Featured Stock Update with an annotated graph appeared on 1/5/2010. click here.
|
|
C
A
S
I |
News |
Chart |
SEC
View all notes Alert
me of new notes
Company
Profile
|
PEGA
- NASDAQ
Pegasystems Inc
COMPUTER SOFTWARE & SERVICES - Business Software & Services
|
$34.18
|
-0.52
|
94,931
38% DAV
252,900
|
1/4/2010
(Date
Featured) |
$34.00
(Price
Featured) |
PP = $36.19 |
Y |
| MB = $38.00 |
Most Recent Note - 1/6/2010 6:38:37 PM
Y - Another small loss today on light volume. It is perched near all-time highs with no overhead supply remaining to act as resistance. Returned to the Featured Stocks page again with its fresh appearance in the January 2010 issue of CANSLIM.net News (read here).
>>> The latest Featured Stock Update with an annotated graph appeared on 1/3/2010. click here.
|
|
C
A
S
I |
News |
Chart |
SEC
View all notes Alert
me of new notes
Company
Profile
|
VIT
-
|
$20.86
|
+0.88
|
2,330,625
465% DAV
501,300
|
12/24/2009
(Date
Featured) |
$20.07
(Price
Featured) |
PP = $21.17 |
Y |
| MB = $22.23 |
Most Recent Note - 1/6/2010 6:40:38 PM
Y - Considerable gain today with 4 times average volume for a new high close. It hit a new all-time high, but pulled back under its pivot point. It built a choppy 11-week base. Featured in yellow in the 12/24/09 mid-day report (read here). No overhead supply exists to act as resistance. Fundamentally, this high-ranked Computer - Tech Services firm's earnings and sales revenues increases have been above or at the +25% minimum guideline.
>>> The latest Featured Stock Update with an annotated graph appeared on 12/24/2009. click here.
|
|
C
A
S
I |
News |
Chart |
SEC
View all notes Alert
me of new notes
Company
Profile
|
|
|
|
THESE ARE NOT BUY RECOMMENDATIONS!
Comments contained in the body of this report are technical
opinions only. The material herein has been obtained
from sources believed to be reliable and accurate, however,
its accuracy and completeness cannot be guaranteed.
This site is not an investment advisor, hence it does
not endorse or recommend any securities or other investments.
Any recommendation contained in this report may not
be suitable for all investors and it is not to be deemed
an offer or solicitation on our part with respect to
the purchase or sale of any securities. All trademarks,
service marks and trade names appearing in this report
are the property of their respective owners, and are
likewise used for identification purposes only.
This report is a service available
only to active Paid Premium Members.
You may opt-out of receiving report notifications
at any time. Questions or comments may be submitted
by writing to Premium Membership Services 665 S.E. 10 Street, Suite 201 Deerfield Beach, FL 33441-5634 or by calling 1-800-965-8307
or 954-785-1121.
|
|
|


