You are not logged in.
This means you
CAN ONLY VIEW reports that were published prior to Monday, April 7, 2025.
You
MUST UPGRADE YOUR MEMBERSHIP if you want to see any current reports.
AFTER MARKET UPDATE - WEDNESDAY, DECEMBER 2ND, 2015
Previous After Market Report Next After Market Report >>>
|
|
|
|
DOW |
-158.67 |
17,729.68 |
-0.89% |
|
Volume |
930,369,180 |
+10% |
|
Volume |
1,897,280,340 |
+3% |
|
NASDAQ |
-33.09 |
5,123.22 |
-0.64% |
|
Advancers |
650 |
21% |
|
Advancers |
952 |
33% |
|
S&P 500 |
-23.12 |
2,079.51 |
-1.10% |
|
Decliners |
2,430 |
79% |
|
Decliners |
1,926 |
67% |
|
Russell 2000 |
-12.47 |
1,191.69 |
-1.04% |
|
52 Wk Highs |
68 |
|
|
52 Wk Highs |
104 |
|
|
S&P 600 |
-6.82 |
704.54 |
-0.96% |
|
52 Wk Lows |
116 |
|
|
52 Wk Lows |
70 |
|
|
 |
Breadth Negative as Major Averages Pulled Back
Kenneth J. Gruneisen - Passed the CAN SLIM® Master's Exam
Stocks declined on Wednesday. The Dow fell 158 points to 17729. The S&P 500 was down 23 points to 2079. The NASDAQ lost 33 points to 5123. Volume totals were up from the prior session totals on the NYSE and on the Nasdaq exchange, a sign of distributional pressure from the institutional crowd. Breadth turned solidly negative as decliners led advancers by nearly a 4-1 margin on the NYSE and by more than 2-1 on the Nasdaq exchange. There were 56 high-ranked companies from the Leaders List that made new 52-week highs and were listed on the BreakOuts Page, down from 70 on the prior session. There were gains for only 3 of the 13 high-ranked companies currently on the Featured Stocks Page. New 52-week highs outnumbered new 52-week lows on the Nasdaq exchange but new lows outnumbered new highs on the NYSE. Charts used courtesy of www.stockcharts.com

PICTURED: The Nasdaq Composite Index is perched -2% off its all-time high, consolidating well above its 50-day and 200-day moving average (DMA) lines. All three major averages (M criteria) showed impressive strength and recently rebounded above their respective 200 DMA lines while leadership (stocks hitting new highs) improved. New buying efforts may only be considered in stocks meeting all key criteria. The major averages sold off along with bonds amid a busy day of economic news. Fed chair Janet Yellen said in a speech this afternoon that the U.S. economy is on track for an interest hike this month. That was after the Fed’s Beige Book release showed modest economic growth across the U.S. In light of these deliberations, the futures market is now pricing in a 72% probability of a December rate increase. In other news, ADP numbers suggest the labor market added 217,000 jobs in November, well above the projected 190,000. Treasuries declined on rate expectations with the benchmark 10-year note losing 10/32 to yield 2.18%. In commodities, NYMEX WTI crude slid 4.2% to $40.10/barrel after a report showed U.S. inventories rose to the highest level since 1930. All ten sectors in the S&P 500 finished lower on the day. The energy and utilities sectors lagged while tech stocks were most resilient. In corporate news, shares of Yahoo (YHOO +5.8%) rose on a report that the company’s board met to discuss the sale of its flagship internet business. QUALCOMM (QCOM +5.2%) rose on news that it will enter into a Chinese patent license agreement with Xiaomi. The Featured Stocks Page saw some new names recently added. The most current notes with headline links help members have access to more detailed letter-by-letter analysis including price/volume graphs annotated by our experts. See the Premium Member Homepage for archives to all prior pay reports.
|
 Kenneth J. Gruneisen started out as a licensed stockbroker in August 1987, a couple of months prior to the historic stock market crash that took the Dow Jones Industrial Average down -22.6% in a single day. He has published daily fact-based fundamental and technical analysis on high-ranked stocks online for two decades. Through FACTBASEDINVESTING.COM, Kenneth provides educational articles, news, market commentary, and other information regarding proven investment systems that work in good times and bad.
Comments contained in the body of this report are technical opinions only and are not necessarily those of Gruneisen Growth Corp. The material herein has been obtained from sources believed to be reliable and accurate, however, its accuracy and completeness cannot be guaranteed. Our firm, employees, and customers may effect transactions, including transactions contrary to any recommendation herein, or have positions in the securities mentioned herein or options with respect thereto. Any recommendation contained in this report may not be suitable for all investors and it is not to be deemed an offer or solicitation on our part with respect to the purchase or sale of any securities. |
|
 |
Commodity-Linked Groups Led Broader Weakness
Kenneth J. Gruneisen - Passed the CAN SLIM® Master's Exam
Commodity-linked groups were the standout decliners on Wednesday as the Gold & Silver Index ($XAU -2.40%), Integrated Oil Index ($XOI -2.58%) and Oil Services Index ($OSX -3.24%) each suffered a large loss. The Retail Index ($RLX-0.43%) edged lower as the Bank Index ($BKX-1.11%) and the Broker/Dealer Index ($XBD -0.99%) were also negative influences on the major averages. The Semiconductor Index ($SOX -0.56%) and the Biotechnology Index ($BTK -0.87%) both lost ground, meanwhile the Networking Index ($NWX -0.05%) finished flat. Charts courtesy www.stockcharts.com
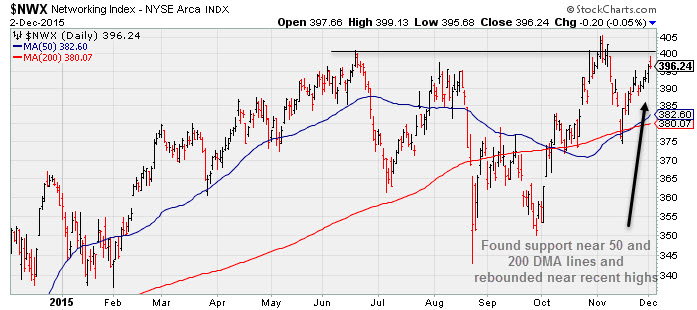
PICTURED: The Networking Index ($NWX -0.05%) found support near its 50-day and 200-day moving average (DMA) lines and rebounded near recent highs.
| Oil Services |
$OSX |
173.93 |
-5.84 |
-3.25% |
-17.52% |
| Integrated Oil |
$XOI |
1,172.44 |
-31.05 |
-2.58% |
-13.03% |
| Semiconductor |
$SOX |
682.69 |
-3.83 |
-0.56% |
-0.61% |
| Networking |
$NWX |
396.24 |
-0.20 |
-0.05% |
+10.70% |
| Broker/Dealer |
$XBD |
186.82 |
-1.88 |
-0.99% |
+1.18% |
| Retail |
$RLX |
1,304.00 |
-5.62 |
-0.43% |
+26.27% |
| Gold & Silver |
$XAU |
46.54 |
-1.15 |
-2.41% |
-32.33% |
| Bank |
$BKX |
75.70 |
-0.85 |
-1.11% |
+1.94% |
| Biotech |
$BTK |
3,770.57 |
-33.28 |
-0.87% |
+9.64% |
|
|
|
 |
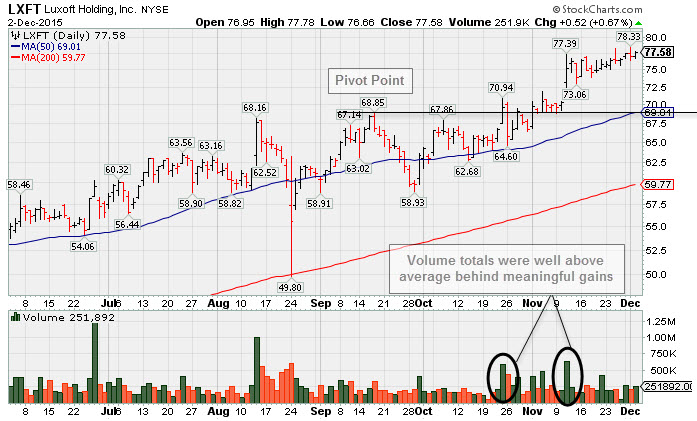
Another Gain on Average Volume to a New High Close
Kenneth J. Gruneisen - Passed the CAN SLIM® Master's Exam
Luxoft Holding Inc Cl A (LXFT +$0.52 or +0.67% to $77.58) posted a small gain on average volume for a best-ever close today. Volume totals have generally cooled while stubbornly holding its ground near its all-time high, a sign that very few investors have been heading to the exit. Volume was above average behind meaningful gains in recent months. Disciplined investors avoid chasing extended stocks. LXFT was last shown in this FSU section on 11/11/15 with an annotated graph under the headline, "Gap Up Gain Getting More Extended From Prior Base". It was first highlighted in yellow in the 5/26/15 mid-day report (read here).
Continuing its strong earning track record, it reported Sep '15 earnings +45% on +29% sales revenues and raised guidance. Earnings +36% on +32% sales revenues for the Jun '15 quarter, so it has a strong quarterly and annual earnings history (C and A criteria) matching the guidelines of the fact-based investment system. Sales revenues growth has been strong while it reported earnings +32%, +23%, +50%, and +28% in the Jun, Sep, Dec '14 and Mar '15 quarters versus the year ago periods.
The number of top-rated funds owning its shares rose from 185 in Jun '14 to 300 in Sep '15, a reassuring sign concerning the I criteria. Its current Up/Down Volume ratio of 1.3 is an unbiased indication its shares have been under accumulation over the past 50 days. It has earned a Timeliness Rating of A and a Sponsorship Rating of C. Its small supply of only 30.6 million shares (S criteria) in the public float can contribute to greater price volatility in the event of institutional buying or selling. |
|
|
Color Codes Explained :
Y - Better candidates highlighted by our
staff of experts.
G - Previously featured
in past reports as yellow but may no longer be buyable under the
guidelines.
***Last / Change / Volume data in this table is the closing quote data***
Symbol/Exchange
Company Name
Industry Group |
PRICE |
CHANGE
(%Change) |
Day High |
Volume
(% DAV)
(% 50 day avg vol) |
52 Wk Hi
% From Hi |
Featured
Date |
Price
Featured |
Pivot Featured |
|
Max Buy |
PNFP
-
NASDAQ
Pinnacle Financial Prtnr
BANKING - Regional - Southeast Banks
|
$53.50
|
-0.89
-1.64% |
$54.64
|
234,472
143.85% of 50 DAV
50 DAV is 163,000
|
$57.99
-7.74%
|
11/6/2015
|
$56.34
|
PP = $55.58
|
|
MB = $58.36
|
Most Recent Note - 12/1/2015 1:07:58 PM
Y - Volume totals have been cooling in recent weeks while consolidating. Its 50 DMA line ($52.60) defines the next important support level. Concerns were raised as it slumped back into the prior base. Disciplined investors limit losses by selling any stock that falls more than -7% from their purchase price.
>>> FEATURED STOCK ARTICLE : Negated Breakout Then Finding Support Above 50 Day Average - 11/24/2015 |
View all notes |
Set NEW NOTE alert |
Company Profile |
SEC
News |
Chart |
Request a new note
C
A
S
I |
SFNC
-
NASDAQ
Simmons First Natl Cp A
BANKING - Regional - Southeast Banks
|
$56.90
|
-1.10
-1.90% |
$58.46
|
122,796
84.69% of 50 DAV
50 DAV is 145,000
|
$58.75
-3.15%
|
10/22/2015
|
$50.13
|
PP = $48.98
|
|
MB = $51.43
|
Most Recent Note - 12/1/2015 1:10:01 PM
G - Touched a new 52-week high today then reversed into the red. Its 50 DMA line defines near-term support to watch ($51.61) on pullbacks.
>>> FEATURED STOCK ARTICLE : Extended From Prior Base and Perched Near High - 11/19/2015 |
View all notes |
Set NEW NOTE alert |
Company Profile |
SEC
News |
Chart |
Request a new note
C
A
S
I |
MANH
-
NASDAQ
Manhattan Associates Inc
COMPUTER SOFTWARE and SERVICES - Technical and System Software
|
$76.20
|
-0.33
-0.43% |
$77.56
|
288,357
52.91% of 50 DAV
50 DAV is 545,000
|
$77.47
-1.64%
|
10/21/2015
|
$69.18
|
PP = $69.91
|
|
MB = $73.41
|
Most Recent Note - 11/30/2015 5:34:50 PM
G - Hit another new high with today's gain on slightly above average volume. Prior highs in the $69 area and its 50 DMA line define support to watch on pullbacks.
>>> FEATURED STOCK ARTICLE : Consolidating Above Prior Highs and 50-Day Moving Average - 11/18/2015 |
View all notes |
Set NEW NOTE alert |
Company Profile |
SEC
News |
Chart |
Request a new note
C
A
S
I |
HAWK
-
NASDAQ
Blackhawk Network Inc
DIVERSIFIED SERVICES - Business/Management Services
|
$47.44
|
+0.02
0.04% |
$47.94
|
389,775
70.74% of 50 DAV
50 DAV is 551,000
|
$48.40
-1.98%
|
11/25/2015
|
$47.63
|
PP = $47.07
|
|
MB = $49.42
|
Most Recent Note - 12/1/2015 1:18:03 PM
Y - Stubbornly and quietly holding its ground after its 11/25/15 gain with +36% above average volume. Fundamentals remain strong. Volume must be at least +40% above average behind gains above a stock's pivot point to trigger a proper technical buy signal.
>>> FEATURED STOCK ARTICLE : Gain For New High With +36% Above Average Volume - 11/25/2015 |
View all notes |
Set NEW NOTE alert |
Company Profile |
SEC
News |
Chart |
Request a new note
C
A
S
I |
JBSS
-
NASDAQ
Sanfilippo John B & Son
FOOD and BEVERAGE - Processed and Packaged Goods
|
$56.90
|
-0.10
-0.18% |
$57.35
|
37,287
47.80% of 50 DAV
50 DAV is 78,000
|
$66.29
-14.17%
|
10/27/2015
|
$56.00
|
PP = $57.33
|
|
MB = $60.20
|
Most Recent Note - 11/30/2015 5:33:21 PM
Y - Color code is changed to yellow while pulling back near prior highs in the $57 area and its 50 DMA line defining important support. See the latest FSU analysis for more details and a new annotated graph.
>>> FEATURED STOCK ARTICLE : Consolidating Above Prior Highs and 50-Day Moving Average - 11/30/2015 |
View all notes |
Set NEW NOTE alert |
Company Profile |
SEC
News |
Chart |
Request a new note
C
A
S
I |
Symbol/Exchange
Company Name
Industry Group |
PRICE |
CHANGE
(%Change) |
Day High |
Volume
(% DAV)
(% 50 day avg vol) |
52 Wk Hi
% From Hi |
Featured
Date |
Price
Featured |
Pivot Featured |
|
Max Buy |
STMP
-
NASDAQ
Stamps.com Inc
INTERNET - Internet Software and Services
|
$103.08
|
+1.76
1.74% |
$103.44
|
183,018
62.68% of 50 DAV
50 DAV is 292,000
|
$106.43
-3.15%
|
11/6/2015
|
$100.75
|
PP = $88.97
|
|
MB = $93.42
|
Most Recent Note - 11/30/2015 5:36:45 PM
G - Consolidating in a tight range near its 52-week high. Prior highs in the $88 area define important near-term support to watch. Disciplined investors avoid chasing extended stocks.
>>> FEATURED STOCK ARTICLE : Volume-Driven Gain For Second Best Close - 11/23/2015 |
View all notes |
Set NEW NOTE alert |
Company Profile |
SEC
News |
Chart |
Request a new note
C
A
S
I |
ULTI
-
NASDAQ
Ultimate Software Group
INTERNET - Internet Software and Services
|
$197.22
|
-0.14
-0.07% |
$199.80
|
245,346
92.24% of 50 DAV
50 DAV is 266,000
|
$216.27
-8.81%
|
10/28/2015
|
$204.38
|
PP = $195.28
|
|
MB = $205.04
|
Most Recent Note - 12/1/2015 1:14:57 PM
Y - Consolidating above prior highs in the $195 area defining support along with its 50 DMA line ($194.30). Subsequent violations may trigger technical sell signals.
>>> FEATURED STOCK ARTICLE : Following Big Breakout Volume Totals Have Cooled - 11/16/2015 |
View all notes |
Set NEW NOTE alert |
Company Profile |
SEC
News |
Chart |
Request a new note
C
A
S
I |
ULTA
-
NASDAQ
Ulta Salon Cosm & Frag
SPECIALTY RETAIL - Specialty Retail, Other
|
$163.43
|
-2.40
-1.45% |
$166.20
|
1,213,176
165.51% of 50 DAV
50 DAV is 733,000
|
$176.77
-7.55%
|
10/22/2015
|
$168.02
|
PP = $170.31
|
|
MB = $178.83
|
 Most Recent Note - 12/2/2015 5:40:23 PM
G - Pulled back for a 3rd consecutive volume-driven loss, a sign of distributional pressure raising concerns while undercutting its 50 DMA line ($167.45). Its 200 DMA line ($159) and recent lows ($151.52) define the next important support. Previously noted with caution - "Fundamental concerns remain after the Sep '15 quarter earnings were below the +25% minimum guideline (C criteria)."
>>> FEATURED STOCK ARTICLE : Gains on Light Volume Before Decisive Drop on Heavy Volume - 11/13/2015 |
View all notes |
Set NEW NOTE alert |
Company Profile |
SEC
News |
Chart |
Request a new note
C
A
S
I |
FLTX
-
NYSE
Fleetmatics Group Plc
Computer Sftwr-Enterprse
|
$61.32
|
-0.43
-0.70% |
$61.76
|
320,455
72.17% of 50 DAV
50 DAV is 444,000
|
$61.85
-0.86%
|
9/23/2015
|
$51.26
|
PP = $52.55
|
|
MB = $55.18
|
Most Recent Note - 12/1/2015 1:13:12 PM
G - Poised for possibly a best-ever close with today's gain on light volume. Consolidation is still too short to be considered a valid new base. Prior highs in the $56 area define near-term support above its 50 DMA line ($55.46).
>>> FEATURED STOCK ARTICLE : Extended From Prior Base and Perched Near High - 11/17/2015 |
View all notes |
Set NEW NOTE alert |
Company Profile |
SEC
News |
Chart |
Request a new note
C
A
S
I |
LGIH
-
NASDAQ
L G I Homes Inc
Bldg-Resident/Comml
|
$34.23
|
-1.31
-3.69% |
$36.07
|
724,337
134.64% of 50 DAV
50 DAV is 538,000
|
$35.91
-4.68%
|
12/1/2015
|
$35.15
|
PP = $33.97
|
|
MB = $35.67
|
Most Recent Note - 12/2/2015 5:38:18 PM
Y - Pulled back below its "max buy" level today. Finished strong after highlighted in yellow in the 12/01/15 mid-day report (read here). Powered to a new 52-week high with +249% above average volume triggering a technical buy signal. See the latest FSU analysis for more details and an annotated graph.
>>> FEATURED STOCK ARTICLE : Volume Heavy Behind Breakout Gain - 12/1/2015 |
View all notes |
Set NEW NOTE alert |
Company Profile |
SEC
News |
Chart |
Request a new note
C
A
S
I |
Symbol/Exchange
Company Name
Industry Group |
PRICE |
CHANGE
(%Change) |
Day High |
Volume
(% DAV)
(% 50 day avg vol) |
52 Wk Hi
% From Hi |
Featured
Date |
Price
Featured |
Pivot Featured |
|
Max Buy |
LXFT
-
NYSE
Luxoft Holding Inc Cl A
Comp Sftwr-Spec Enterprs
|
$77.58
|
+0.52
0.67% |
$77.78
|
251,032
111.08% of 50 DAV
50 DAV is 226,000
|
$78.33
-0.96%
|
10/22/2015
|
$66.65
|
PP = $68.95
|
|
MB = $72.40
|
Most Recent Note - 12/2/2015 5:36:35 PM
G - Posted another gain today on average volume for a best-ever close. Disciplined investors avoid chasing extended stocks. See the latest FSU analysis for more details and a new annotated graph.
>>> FEATURED STOCK ARTICLE : Another Gain on Average Volume to a New High Close - 12/2/2015 |
View all notes |
Set NEW NOTE alert |
Company Profile |
SEC
News |
Chart |
Request a new note
C
A
S
I |
VBTX
-
NASDAQ
Veritex Holdings Inc
BANKING - Regional - Southwest Banks
|
$17.10
|
-0.15
-0.87% |
$17.25
|
4,184
27.89% of 50 DAV
50 DAV is 15,000
|
$17.95
-4.74%
|
11/4/2015
|
$17.00
|
PP = $18.05
|
|
MB = $18.95
|
Most Recent Note - 11/30/2015 5:38:14 PM
Y - Perched within close striking distance of its 52-week high. Found support above its 50 DMA line. Still has not produced the necessary gains above its pivot point backed by at least +40% above average volume needed to trigger a technical buy signal.
>>> FEATURED STOCK ARTICLE : Found Support This Week Above 50-Day Moving Average - 11/20/2015 |
View all notes |
Set NEW NOTE alert |
Company Profile |
SEC
News |
Chart |
Request a new note
C
A
S
I |
NHTC
-
NASDAQ
Natural Health Trends
Cosmetics/Personal Care
|
$46.46
|
-0.14
-0.30% |
$47.80
|
192,074
45.62% of 50 DAV
50 DAV is 421,000
|
$55.45
-16.21%
|
10/23/2015
|
$42.12
|
PP = $44.85
|
|
MB = $47.09
|
Most Recent Note - 12/1/2015 1:05:25 PM
Y - Pulling back today. Near term support to watch is its 50 DMA line ($42.07). See the latest FSU analysis for more details and an annotated graph showing a valid secondary buy point.
>>> FEATURED STOCK ARTICLE : After Successful Test of 10-Week Average a Valid Secondary Buy Point Exists - 11/27/2015 |
View all notes |
Set NEW NOTE alert |
Company Profile |
SEC
News |
Chart |
Request a new note
C
A
S
I |
|
|
|
THESE ARE NOT BUY RECOMMENDATIONS!
Comments contained in the body of this report are technical
opinions only. The material herein has been obtained
from sources believed to be reliable and accurate, however,
its accuracy and completeness cannot be guaranteed.
This site is not an investment advisor, hence it does
not endorse or recommend any securities or other investments.
Any recommendation contained in this report may not
be suitable for all investors and it is not to be deemed
an offer or solicitation on our part with respect to
the purchase or sale of any securities. All trademarks,
service marks and trade names appearing in this report
are the property of their respective owners, and are
likewise used for identification purposes only.
This report is a service available
only to active Paid Premium Members.
You may opt-out of receiving report notifications
at any time. Questions or comments may be submitted
by writing to Premium Membership Services 665 S.E. 10 Street, Suite 201 Deerfield Beach, FL 33441-5634 or by calling 1-800-965-8307
or 954-785-1121.
|
|
|