You are not logged in.
This means you
CAN ONLY VIEW reports that were published prior to Monday, April 7, 2025.
You
MUST UPGRADE YOUR MEMBERSHIP if you want to see any current reports.
AFTER MARKET UPDATE - MONDAY, NOVEMBER 30TH, 2015
Previous After Market Report Next After Market Report >>>
|
|
|
|
DOW |
-78.57 |
17,719.92 |
-0.44% |
|
Volume |
1,326,153,510 |
+251% |
|
Volume |
2,042,822,200 |
+182% |
|
NASDAQ |
-18.85 |
5,108.67 |
-0.37% |
|
Advancers |
1,334 |
43% |
|
Advancers |
1,347 |
47% |
|
S&P 500 |
-9.70 |
2,080.41 |
-0.46% |
|
Decliners |
1,742 |
57% |
|
Decliners |
1,536 |
53% |
|
Russell 2000 |
-4.27 |
1,198.11 |
-0.36% |
|
52 Wk Highs |
95 |
|
|
52 Wk Highs |
126 |
|
|
S&P 600 |
-2.75 |
706.75 |
-0.39% |
|
52 Wk Lows |
59 |
|
|
52 Wk Lows |
48 |
|
|
 |
Major Averages Slumped With Higher Volume Totals
Kenneth J. Gruneisen - Passed the CAN SLIM® Master's Exam
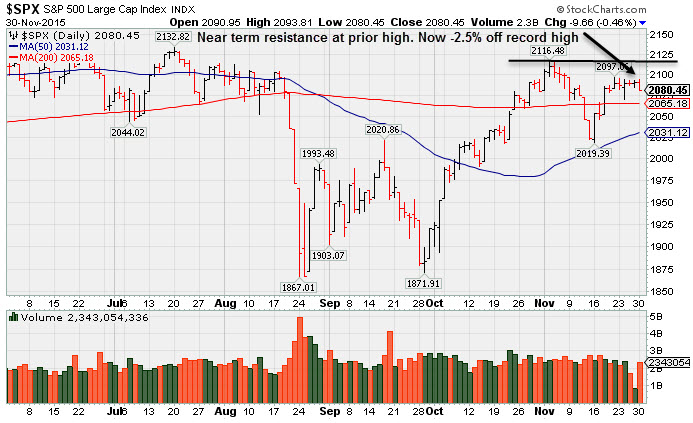
Despite Monday’s decline, the major averages ended the month in positive territory. The Dow rose 0.3%, the S&P 500 gained 0.1% and the NASDAQ Composite increased 1.1%. Stocks were lower on Monday. The Dow lost 79 points to 17719. The S&P 500 fell 10 points to 2080. The NASDAQ Composite declined 19 points to 5108. Volume totals on Monday's session were up from Friday's light half-session totals on the NYSE and on the Nasdaq exchange. Decliners narrowly led advancers on the NYSE and on the Nasdaq exchange. Leadership improved as there were 76 high-ranked companies from the Leaders List that made new 52-week highs and were listed on the BreakOuts Page, up from 57 on the prior session. There were gains for 6 of the 12 high-ranked companies currently on the Featured Stocks Page. New 52-week highs outnumbered new 52-week lows on both the Nasdaq exchange and the NYSE.
PICTURED: The S&P 500 Index faces near-term resistance at prior highs while perched -2.5% off its all-time high. It is consolidating above its 50-day and 200-day moving average (DMA) lines.
All three major averages (M criteria) showed impressive strength and recently rebounded above their respective 200 DMA lines while leadership (stocks hitting new highs) improved. New buying efforts may only be considered in stocks meeting all key criteria.The major averages ended November on a down note amid investor caution ahead
of several key data releases later in the week. Wednesday’s Beige Book and
Friday’s jobs report will be monitored for indications on whether the U.S.
central bank will raise rates in December. The conclusion of European Central
Bank’s policy meeting and Fed Chair Janet Yellen’s Congressional testimony
Thursday also garnered attention during the session. A report today showed
pending home sales edged up 0.2% in October versus a projected 1.0% gain.
Another reading revealed Midwest manufacturing activity unexpectedly contracted
in November.
AbbVie (ABBV -3.1%) fell as health care and consumer discretionary were the worst-performing sectors. Wal-Mart (WMT -1.8%) fell amid indications
the holiday shopping season is off to a slow start. Energy was the up the most
even as oil resumed its retreat. Halliburton (HAL +1.8%) and
Exxon (XOM +0.5%) rose.
Treasuries were higher at the long end of the yield curve. The 10-year note
was up 3/32 to 2.21%. In commodities, NYMEX WTI crude was down 0.1% to
$41.65/barrel. COMEX gold advanced 0.8% to $1065.00/ounce.
The Featured Stocks Page saw some new names recently added. The most current notes with headline links help members have access to more detailed letter-by-letter analysis including price/volume graphs annotated by our experts. See the Premium Member Homepage for archives to all prior pay reports.
|
 Kenneth J. Gruneisen started out as a licensed stockbroker in August 1987, a couple of months prior to the historic stock market crash that took the Dow Jones Industrial Average down -22.6% in a single day. He has published daily fact-based fundamental and technical analysis on high-ranked stocks online for two decades. Through FACTBASEDINVESTING.COM, Kenneth provides educational articles, news, market commentary, and other information regarding proven investment systems that work in good times and bad.
Comments contained in the body of this report are technical opinions only and are not necessarily those of Gruneisen Growth Corp. The material herein has been obtained from sources believed to be reliable and accurate, however, its accuracy and completeness cannot be guaranteed. Our firm, employees, and customers may effect transactions, including transactions contrary to any recommendation herein, or have positions in the securities mentioned herein or options with respect thereto. Any recommendation contained in this report may not be suitable for all investors and it is not to be deemed an offer or solicitation on our part with respect to the purchase or sale of any securities. |
|
 |
Commodity-Linked Groups and Semiconductors Rose
Kenneth J. Gruneisen - Passed the CAN SLIM® Master's Exam
On Monday the Gold & Silver Index ($XAU +2.75%) and the Oil Services Index ($OSX +1.36%) posted solid gains while the Integrated Oil Index ($XOI +0.12%) inched higher. The Retail Index ($RLX -0.96%) created a drag on the major averages lower while the Bank Index ($BKX-0.20%) and the Broker/Dealer Index ($XBD -0.06%) both finished slightly higher. The Biotechnology Index ($BTK -1.34%) slumped, meanwhile the Networking Index ($NWX +0.09%) finished flat and the Semiconductor Index ($SOX +0.99%) was higher.Charts courtesy www.stockcharts.com
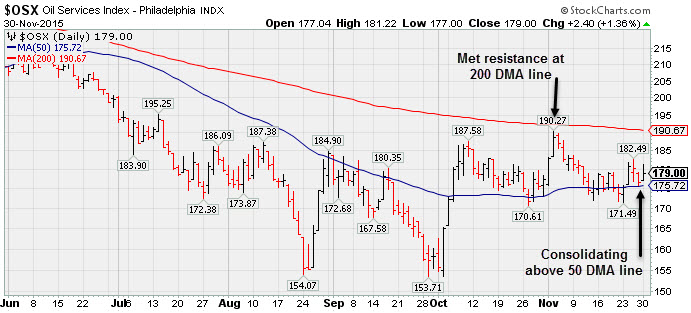
PICTURED: The Oil Services Index ($OSX +1.36%) has been consolidating above its 50-day moving average (DMA) line after meeting resistance at its 200 DMA line while rebounding from its lows.
| Oil Services |
$OSX |
179.00 |
+2.40 |
+1.36% |
-15.11% |
| Integrated Oil |
$XOI |
1,190.99 |
+1.38 |
+0.12% |
-11.66% |
| Semiconductor |
$SOX |
677.14 |
+6.63 |
+0.99% |
-1.42% |
| Networking |
$NWX |
392.97 |
+0.35 |
+0.09% |
+9.79% |
| Broker/Dealer |
$XBD |
186.07 |
-0.12 |
-0.06% |
+0.77% |
| Retail |
$RLX |
1,296.35 |
-12.53 |
-0.96% |
+25.53% |
| Gold & Silver |
$XAU |
46.15 |
+1.23 |
+2.74% |
-32.90% |
| Bank |
$BKX |
75.75 |
-0.15 |
-0.20% |
+2.01% |
| Biotech |
$BTK |
3,790.69 |
-51.42 |
-1.34% |
+10.22% |
|
|
|
 |
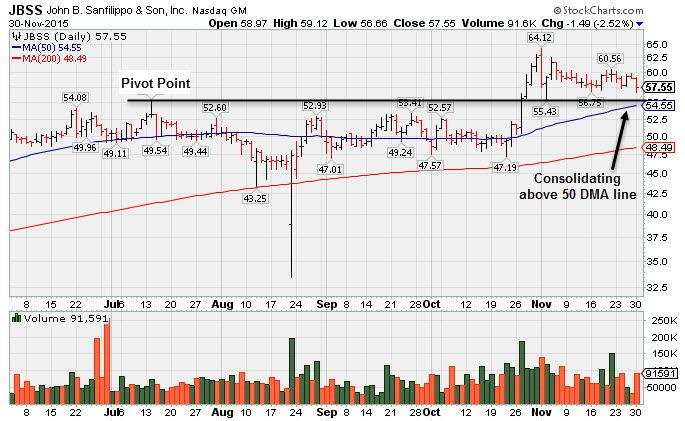
Consolidating Above Prior Highs and 50-Day Moving Average
Kenneth J. Gruneisen - Passed the CAN SLIM® Master's Exam
Sanfilippo John B & Son (JBSS -$1.49 or -2.52% to $57.55) gapped down today and tested support at its 50-day moving average (DMA) line which defines important support to watch. Its color code was changed to yellow while consolidating back below its "max buy" level. Prior highs in the $57 area also define important support where more serious losses would raise concerns. Disciplined investors always limit losses by selling any stock that falls more than -7% from their purchase price. It was last shown in this FSU section with an annotated graph on 11/12/15 under the headline, " Consolidating Near "Max Buy" Level and Well Above Prior Highs". Prior highs in the $57 area acted as support during the pullback shortly after its technical breakout on heavy volume. It was highlighted in yellow with pivot point cited based on its 7/14/15 high plus 10 cents in the 10/27/15 mid-day report (read here). The considerable gain backed by +162% above average volume and strong finish above the pivot point clinched a technical buy signal. The Food - Misc Preparation firm processes and markets various nuts. JBSS reported earnings +34% on +10% sales revenues for the Sep '15 quarter, its 3rd consecutive earnings comparison (C criteria) above the +25% minimum guideline. Earnings rose +73% in the Mar '15 quarter and +27% in the Jun '15 quarter versus the year ago periods. Its annual earnings (A criteria) history has been strong after a downturn in FY '11. It has a Timeliness Rating of A and a Sponsorship Rating of C. Its small supply of only 8.3 million shares (S criteria) in the float may contribute to greater price volatility. The number of top-rated funds owning its shares rose from 200 in Dec '14 to 246 in Sep '15, a reassuring sign concerning the I criteria. Its current Up/Down Volume Ratio of 1.2 is an unbiased indication its shares have been under accumulation over the past 50 days. Charts courtesy www.stockcharts.com
 |
|
|
Color Codes Explained :
Y - Better candidates highlighted by our
staff of experts.
G - Previously featured
in past reports as yellow but may no longer be buyable under the
guidelines.
***Last / Change / Volume data in this table is the closing quote data***
Symbol/Exchange
Company Name
Industry Group |
PRICE |
CHANGE
(%Change) |
Day High |
Volume
(% DAV)
(% 50 day avg vol) |
52 Wk Hi
% From Hi |
Featured
Date |
Price
Featured |
Pivot Featured |
|
Max Buy |
PNFP
-
NASDAQ
Pinnacle Financial Prtnr
BANKING - Regional - Southeast Banks
|
$54.33
|
-0.58
-1.06% |
$54.91
|
118,051
69.85% of 50 DAV
50 DAV is 169,000
|
$57.99
-6.31%
|
11/6/2015
|
$56.34
|
PP = $55.58
|
|
MB = $58.36
|
Most Recent Note - 11/24/2015 6:12:01 PM
Y - Concerns were raised as it slumped back into the prior base. Its 50 DMA line defines the next important support level. Disciplined investors limit losses by selling any stock that falls more than -7% from their purchase price. See the latest FSU analysis for more details and a new annotated graph.
>>> FEATURED STOCK ARTICLE : Negated Breakout Then Finding Support Above 50 Day Average - 11/24/2015 |
View all notes |
Set NEW NOTE alert |
Company Profile |
SEC
News |
Chart |
Request a new note
C
A
S
I |
SFNC
-
NASDAQ
Simmons First Natl Cp A
BANKING - Regional - Southeast Banks
|
$57.66
|
+0.36
0.63% |
$57.95
|
190,509
104.68% of 50 DAV
50 DAV is 182,000
|
$58.58
-1.57%
|
10/22/2015
|
$50.13
|
PP = $48.98
|
|
MB = $51.43
|
Most Recent Note - 11/24/2015 6:17:17 PM
G - Posted a 3rd consecutive small gain with light volume today and finished near the session high for a best-ever close. Extended from its prior base. Prior highs in the $48 area define initial support to watch on pullbacks.
>>> FEATURED STOCK ARTICLE : Extended From Prior Base and Perched Near High - 11/19/2015 |
View all notes |
Set NEW NOTE alert |
Company Profile |
SEC
News |
Chart |
Request a new note
C
A
S
I |
MANH
-
NASDAQ
Manhattan Associates Inc
COMPUTER SOFTWARE and SERVICES - Technical and System Software
|
$76.60
|
+0.58
0.76% |
$77.03
|
621,898
115.17% of 50 DAV
50 DAV is 540,000
|
$76.49
0.14%
|
10/21/2015
|
$69.18
|
PP = $69.91
|
|
MB = $73.41
|
 Most Recent Note - 11/30/2015 5:34:50 PM
G - Hit another new high with today's gain on slightly above average volume. Prior highs in the $69 area and its 50 DMA line define support to watch on pullbacks.
>>> FEATURED STOCK ARTICLE : Consolidating Above Prior Highs and 50-Day Moving Average - 11/18/2015 |
View all notes |
Set NEW NOTE alert |
Company Profile |
SEC
News |
Chart |
Request a new note
C
A
S
I |
HAWK
-
NASDAQ
Blackhawk Network Inc
DIVERSIFIED SERVICES - Business/Management Services
|
$47.35
|
-0.20
-0.42% |
$48.01
|
267,644
48.84% of 50 DAV
50 DAV is 548,000
|
$48.40
-2.17%
|
11/25/2015
|
$47.63
|
PP = $47.07
|
|
MB = $49.42
|
Most Recent Note - 11/25/2015 5:54:56 PM
Y - Finished above its new pivot point cited based on its 10/09/15 high plus 10 cents, but volume behind the gain fort a new high today was below the minimum guideline. Fundamentals remain strong. Volume must be at least +40% above average behind gains above a stock's pivot point to trigger a proper technical buy signal. See the latest FSU analysis for more details and a new annotated graph.
>>> FEATURED STOCK ARTICLE : Gain For New High With +36% Above Average Volume - 11/25/2015 |
View all notes |
Set NEW NOTE alert |
Company Profile |
SEC
News |
Chart |
Request a new note
C
A
S
I |
JBSS
-
NASDAQ
Sanfilippo John B & Son
FOOD and BEVERAGE - Processed and Packaged Goods
|
$57.55
|
-1.49
-2.52% |
$59.12
|
88,737
110.92% of 50 DAV
50 DAV is 80,000
|
$66.29
-13.18%
|
10/27/2015
|
$56.00
|
PP = $57.33
|
|
MB = $60.20
|
Most Recent Note - 11/30/2015 5:33:21 PM
Y - Color code is changed to yellow while pulling back near prior highs in the $57 area and its 50 DMA line defining important support. See the latest FSU analysis for more details and a new annotated graph.
>>> FEATURED STOCK ARTICLE : Consolidating Above Prior Highs and 50-Day Moving Average - 11/30/2015 |
View all notes |
Set NEW NOTE alert |
Company Profile |
SEC
News |
Chart |
Request a new note
C
A
S
I |
Symbol/Exchange
Company Name
Industry Group |
PRICE |
CHANGE
(%Change) |
Day High |
Volume
(% DAV)
(% 50 day avg vol) |
52 Wk Hi
% From Hi |
Featured
Date |
Price
Featured |
Pivot Featured |
|
Max Buy |
STMP
-
NASDAQ
Stamps.com Inc
INTERNET - Internet Software and Services
|
$101.36
|
-0.58
-0.57% |
$102.99
|
318,151
109.71% of 50 DAV
50 DAV is 290,000
|
$106.43
-4.76%
|
11/6/2015
|
$100.75
|
PP = $88.97
|
|
MB = $93.42
|
Most Recent Note - 11/30/2015 5:36:45 PM
G - Consolidating in a tight range near its 52-week high. Prior highs in the $88 area define important near-term support to watch. Disciplined investors avoid chasing extended stocks.
>>> FEATURED STOCK ARTICLE : Volume-Driven Gain For Second Best Close - 11/23/2015 |
View all notes |
Set NEW NOTE alert |
Company Profile |
SEC
News |
Chart |
Request a new note
C
A
S
I |
ULTI
-
NASDAQ
Ultimate Software Group
INTERNET - Internet Software and Services
|
$197.50
|
-0.50
-0.25% |
$198.60
|
361,000
138.31% of 50 DAV
50 DAV is 261,000
|
$216.27
-8.68%
|
10/28/2015
|
$204.38
|
PP = $195.28
|
|
MB = $205.04
|
Most Recent Note - 11/24/2015 6:19:09 PM
Y - Pulled back today for a 3rd consecutive small loss with light volume. Prior highs in the $195 area define support along with its 50 DMA line ($193.24).
>>> FEATURED STOCK ARTICLE : Following Big Breakout Volume Totals Have Cooled - 11/16/2015 |
View all notes |
Set NEW NOTE alert |
Company Profile |
SEC
News |
Chart |
Request a new note
C
A
S
I |
ULTA
-
NASDAQ
Ulta Salon Cosm & Frag
SPECIALTY RETAIL - Specialty Retail, Other
|
$167.00
|
-3.98
-2.33% |
$174.49
|
1,556,041
215.82% of 50 DAV
50 DAV is 721,000
|
$176.77
-5.53%
|
10/22/2015
|
$168.02
|
PP = $170.31
|
|
MB = $178.83
|
Most Recent Note - 11/30/2015 1:29:06 PM
G - Pulling back today on higher volume, a sign of distributional pressure, slumping near its 50 DMA line ($167.55). Its 200 DMA line ($158.76) and recent lows ($151.52) define the next important support. Previously noted with caution - "Fundamental concerns remain after the Sep '15 quarter earnings were below the +25% minimum guideline (C criteria)."
>>> FEATURED STOCK ARTICLE : Gains on Light Volume Before Decisive Drop on Heavy Volume - 11/13/2015 |
View all notes |
Set NEW NOTE alert |
Company Profile |
SEC
News |
Chart |
Request a new note
C
A
S
I |
FLTX
-
NYSE
Fleetmatics Group Plc
Computer Sftwr-Enterprse
|
$59.70
|
+0.36
0.61% |
$59.96
|
194,126
43.62% of 50 DAV
50 DAV is 445,000
|
$61.75
-3.32%
|
9/23/2015
|
$51.26
|
PP = $52.55
|
|
MB = $55.18
|
Most Recent Note - 11/24/2015 6:15:01 PM
G - Pulled back on light volume today. It is extended from any sound base. Prior highs in the $56 area define near-term support above its 50 DMA line ($54.58).
>>> FEATURED STOCK ARTICLE : Extended From Prior Base and Perched Near High - 11/17/2015 |
View all notes |
Set NEW NOTE alert |
Company Profile |
SEC
News |
Chart |
Request a new note
C
A
S
I |
LXFT
-
NYSE
Luxoft Holding Inc Cl A
Comp Sftwr-Spec Enterprs
|
$77.47
|
+0.97
1.27% |
$77.54
|
260,005
116.07% of 50 DAV
50 DAV is 224,000
|
$78.18
-0.91%
|
10/22/2015
|
$66.65
|
PP = $68.95
|
|
MB = $72.40
|
Most Recent Note - 11/27/2015 3:35:37 PM
G - Posted 4 consecutive weekly gains and volume totals have cooled while stubbornly holding its ground near its all-time high, a sign that very few investors have been heading to the exit. Disciplined investors avoid chasing extended stocks.
>>> FEATURED STOCK ARTICLE : Gap Up Gain Getting More Extended From Prior Base - 11/11/2015 |
View all notes |
Set NEW NOTE alert |
Company Profile |
SEC
News |
Chart |
Request a new note
C
A
S
I |
Symbol/Exchange
Company Name
Industry Group |
PRICE |
CHANGE
(%Change) |
Day High |
Volume
(% DAV)
(% 50 day avg vol) |
52 Wk Hi
% From Hi |
Featured
Date |
Price
Featured |
Pivot Featured |
|
Max Buy |
VBTX
-
NASDAQ
Veritex Holdings Inc
BANKING - Regional - Southwest Banks
|
$17.21
|
+0.34
2.02% |
$17.33
|
8,539
50.23% of 50 DAV
50 DAV is 17,000
|
$17.95
-4.12%
|
11/4/2015
|
$17.00
|
PP = $18.05
|
|
MB = $18.95
|
Most Recent Note - 11/30/2015 5:38:14 PM
Y - Perched within close striking distance of its 52-week high. Found support above its 50 DMA line. Still has not produced the necessary gains above its pivot point backed by at least +40% above average volume needed to trigger a technical buy signal.
>>> FEATURED STOCK ARTICLE : Found Support This Week Above 50-Day Moving Average - 11/20/2015 |
View all notes |
Set NEW NOTE alert |
Company Profile |
SEC
News |
Chart |
Request a new note
C
A
S
I |
NHTC
-
NASDAQ
Natural Health Trends
Cosmetics/Personal Care
|
$48.39
|
+0.11
0.23% |
$49.75
|
324,655
76.75% of 50 DAV
50 DAV is 423,000
|
$55.45
-12.73%
|
10/23/2015
|
$42.12
|
PP = $44.85
|
|
MB = $47.09
|
Most Recent Note - 11/27/2015 3:32:27 PM
Y - See the latest FSU analysis for more details and a new annotated graph showing a valid secondary buy point noted from its first successful test of the 10 WMA line up to +5% above the latest high ($55.45 X 1.05 =$58.22).
>>> FEATURED STOCK ARTICLE : After Successful Test of 10-Week Average a Valid Secondary Buy Point Exists - 11/27/2015 |
View all notes |
Set NEW NOTE alert |
Company Profile |
SEC
News |
Chart |
Request a new note
C
A
S
I |
|
|
|
THESE ARE NOT BUY RECOMMENDATIONS!
Comments contained in the body of this report are technical
opinions only. The material herein has been obtained
from sources believed to be reliable and accurate, however,
its accuracy and completeness cannot be guaranteed.
This site is not an investment advisor, hence it does
not endorse or recommend any securities or other investments.
Any recommendation contained in this report may not
be suitable for all investors and it is not to be deemed
an offer or solicitation on our part with respect to
the purchase or sale of any securities. All trademarks,
service marks and trade names appearing in this report
are the property of their respective owners, and are
likewise used for identification purposes only.
This report is a service available
only to active Paid Premium Members.
You may opt-out of receiving report notifications
at any time. Questions or comments may be submitted
by writing to Premium Membership Services 665 S.E. 10 Street, Suite 201 Deerfield Beach, FL 33441-5634 or by calling 1-800-965-8307
or 954-785-1121.
|
|
|