You are not logged in.
This means you
CAN ONLY VIEW reports that were published prior to Thursday, March 20, 2025.
You
MUST UPGRADE YOUR MEMBERSHIP if you want to see any current reports.
AFTER MARKET UPDATE - FRIDAY, NOVEMBER 10TH, 2023
Previous After Market Report Next After Market Report >>>
|
|
|
|
DOW |
+391.16 |
34,283.10 |
+1.15% |
|
Volume |
876,683,213 |
-3% |
|
Volume |
4,748,939,000 |
-11% |
|
NASDAQ |
+276.66 |
13,798.11 |
+2.05% |
|
Advancers |
2,024 |
73% |
|
Advancers |
2,525 |
59% |
|
S&P 500 |
+67.89 |
4,415.24 |
+1.56% |
|
Decliners |
739 |
27% |
|
Decliners |
1,778 |
41% |
|
Russell 2000 |
+18.09 |
1,705.32 |
+1.07% |
|
52 Wk Highs |
42 |
|
|
52 Wk Highs |
63 |
|
|
S&P 600 |
+11.27 |
1,114.51 |
+1.02% |
|
52 Wk Lows |
98 |
|
|
52 Wk Lows |
352 |
|
|
 |
Indices Posted Gains With Lighter Volume Totals
Kenneth J. Gruneisen - Passed the CAN SLIM® Master's Exam
The major indices all closed near their highs of the day, which had the S&P 500 up +1.6% and above the 4,400 level. The volume totals were lighter than the prior session on the NYSE and on the Nasdaq exchange, revealing lackluster buying demand from the institutional crowd. Advancers led decliners by almost a 3-1 margin on the NYSE and by nearly 3-2 on the Nasdaq exchange. There were 48 high-ranked companies from the Leaders List that hit new 52-week highs and were listed on the BreakOuts Page, versus the total of 35 on the prior session. However, new 52-week lows totals still expanded and solidly outnumbered new 52-week highs on the NYSE and on the Nasdaq exchange. The major indices recently signaled a new confirmed uptrend for the market (M criteria). New buying efforts should be only made in stocks fitting all key criteria of the fact-based investment system.
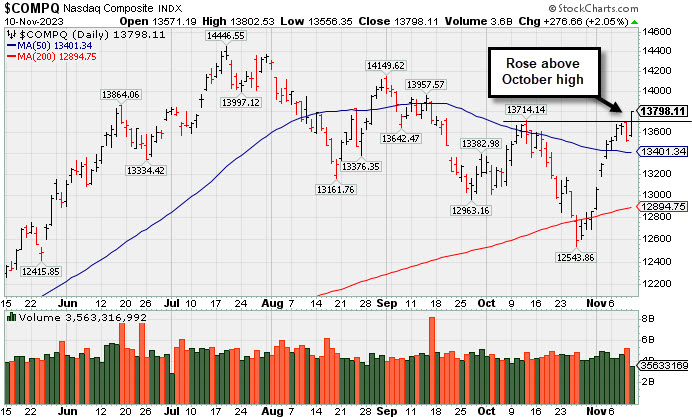
PICTURED: The Nasdaq Composite Index rallied above its October high, making further technical progress since rebounding above its 50-day and 200-day moving average (DMA) lines.
The information technology sector (+2.6%) led the pack thanks to gains in Apple (AAPL +2.19%), Microsoft (MSFT +2.49%), Amazon.com (AMZN +2.11%), and NVIDIA (NVDA +2.95%).The defensive-oriented utilities (+0.6%) and health care (+0.5%) sectors saw the slimmest gains.
The 10-yr note yield settled at 4.63% and the 2-yr note yield climbed four basis points to 5.05%. Preliminary November University of Michigan Index of Consumer Sentiment showed a drop in sentiment to 60.4 from 63.8 in October, marking the fourth straight monthly decline. Year-ahead inflation expectations rose to 4.4% from 4.2% and five-year inflation expectations to 3.2% from 3.0%.
|
 Kenneth J. Gruneisen started out as a licensed stockbroker in August 1987, a couple of months prior to the historic stock market crash that took the Dow Jones Industrial Average down -22.6% in a single day. He has published daily fact-based fundamental and technical analysis on high-ranked stocks online for two decades. Through FACTBASEDINVESTING.COM, Kenneth provides educational articles, news, market commentary, and other information regarding proven investment systems that work in good times and bad.
Comments contained in the body of this report are technical opinions only and are not necessarily those of Gruneisen Growth Corp. The material herein has been obtained from sources believed to be reliable and accurate, however, its accuracy and completeness cannot be guaranteed. Our firm, employees, and customers may effect transactions, including transactions contrary to any recommendation herein, or have positions in the securities mentioned herein or options with respect thereto. Any recommendation contained in this report may not be suitable for all investors and it is not to be deemed an offer or solicitation on our part with respect to the purchase or sale of any securities. |
|
 |
Tech, Retail, Financial, and Energy-Linked Groups Rose
Kenneth J. Gruneisen - Passed the CAN SLIM® Master's Exam
The Retail Index ($RLX +1.72%), Bank Index ($BKX +1.08%), and the Broker/Dealer Index ($XBD +1.28%) each gained ground. The tech sector had a positive bias as the Semiconductor Index ($SOX +4.00%) posted a big gain and the Networking Index ($NWX +1.55%) ended higher, meanwhile, the Biotech Index ($BTK -0.15%) ended slightly in the red. Commodity-linked groups were mixed as the Gold & Silver Index ($XAU -0.92%) fell while the Integrated Oil Index ($XOI +1.50%) and the Oil Services Index ($OSX +1.21%) each ended higher.
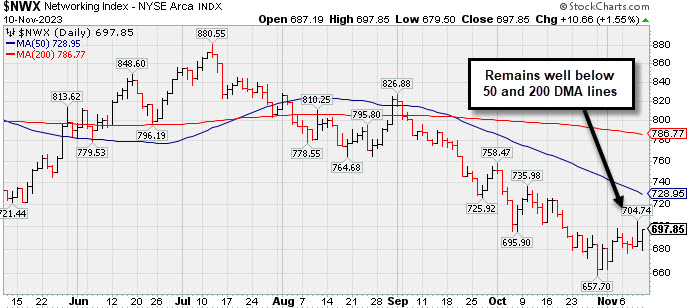
PICTURED: The Networking Index ($NWX +1.55%) remains below its 50-day and 200-day moving average (DMA) lines.
| Oil Services |
$OSX |
84.44 |
+1.01 |
+1.21% |
+0.69% |
| Integrated Oil |
$XOI |
1,823.17 |
+27.01 |
+1.50% |
+2.01% |
| Semiconductor |
$SOX |
3,591.74 |
+139.40 |
+4.04% |
+41.85% |
| Networking |
$NWX |
697.85 |
+10.66 |
+1.55% |
-10.91% |
| Broker/Dealer |
$XBD |
480.03 |
+6.05 |
+1.28% |
+6.88% |
| Retail |
$RLX |
3,592.38 |
+60.82 |
+1.72% |
+30.44% |
| Gold & Silver |
$XAU |
107.89 |
-1.00 |
-0.92% |
-10.73% |
| Bank |
$BKX |
77.99 |
+0.83 |
+1.08% |
-22.67% |
| Biotech |
$BTK |
4,639.09 |
-7.05 |
-0.15% |
-12.16% |
|
|
|
 |
Featured Stocks
Kenneth J. Gruneisen - Passed the CAN SLIM® Master's Exam
|
|
|
Color Codes Explained :
Y - Better candidates highlighted by our
staff of experts.
G - Previously featured
in past reports as yellow but may no longer be buyable under the
guidelines.
***Last / Change / Volume data in this table is the closing quote data***
Symbol/Exchange
Company Name
Industry Group |
PRICE |
CHANGE
(%Change) |
Day High |
Volume
(% DAV)
(% 50 day avg vol) |
52 Wk Hi
% From Hi |
Featured
Date |
Price
Featured |
Pivot Featured |
|
Max Buy |
 ANET
-
NYSE
ANET
-
NYSE
Arista Networks
Computer-Networking
|
$206.84
|
-4.80
-2.27% |
$208.99
|
3,416,418
155.79% of 50 DAV
50 DAV is 2,193,000
|
$216.29
-4.37%
|
10/31/2023
|
$188.84
|
PP = $198.80
|
|
MB = $208.74
|
 Most Recent Note - 11/10/2023 12:14:52 PM
G - Consolidating this week after 5 consecutive gains to new all-time highs. Prior highs in the $198 area define near-term support above its 50 DMA line ($192). Bullish action came after it reported Sep '23 quarterly earnings +46% on +28% sales revenues versus the year-ago period.
>>> FEATURED STOCK ARTICLE : Powerful Gain Following Earnings Report for Arista Networks - 10/31/2023 |
View all notes |
Set NEW NOTE alert |
Company Profile |
SEC
News |
Chart |
Request a new note
C
A
S
I |
NVO
-
NYSE
Novo Nordisk ADR
Medical-Ethical Drugs
|
$101.19
|
+1.16
1.16% |
$101.41
|
5,632,668
117.76% of 50 DAV
50 DAV is 4,783,000
|
$104.00
-2.70%
|
11/2/2023
|
$100.97
|
PP = $104.10
|
|
MB = $109.31
|
Most Recent Note - 11/10/2023 5:18:22 PM
Y - Posted a small gain today while churning above-average volume. Its 50 DMA line ($95.96) defines important near-term support to watch on pullbacks. Subsequent gains for new highs backed by at least +40% above average volume are needed to trigger a technical buy signal.
>>> FEATURED STOCK ARTICLE : Approaching Prior High With Strong Fundamentals - 11/2/2023 |
View all notes |
Set NEW NOTE alert |
Company Profile |
SEC
News |
Chart |
Request a new note
C
A
S
I |
QLYS
-
NASDAQ
Qualys
Computer Sftwr-Security
|
$171.72
|
+3.74
2.23% |
$171.83
|
455,939
132.54% of 50 DAV
50 DAV is 344,000
|
$172.83
-0.64%
|
11/3/2023
|
$167.50
|
PP = $165.03
|
|
MB = $173.28
|
Most Recent Note - 11/10/2023 5:14:29 PM
Y - Posted a solid gain with above-average volume today for a second-best-ever close. Prior high ($165) defines initial support to watch on pullbacks.
>>> FEATURED STOCK ARTICLE : Powerful Breakout for Qualys - 11/3/2023 |
View all notes |
Set NEW NOTE alert |
Company Profile |
SEC
News |
Chart |
Request a new note
C
A
S
I |
AXON
-
NASDAQ
Axon Enterprise
Security/Sfty
|
$217.94
|
+2.24
1.04% |
$220.00
|
830,258
174.42% of 50 DAV
50 DAV is 476,000
|
$231.71
-5.94%
|
11/8/2023
|
$127.84
|
PP = $223.30
|
|
MB = $234.47
|
Most Recent Note - 11/10/2023 5:20:19 PM
Y - Posted a gain with above-average volume today. Negated the 11/08/23 gain with a big volume-driven loss raising concerns while undercutting the new pivot point cited. More damaging losses would raise greater concerns.
>>> FEATURED STOCK ARTICLE : Breakout for Axon as it Returns to Featured Stocks List - 11/8/2023 |
View all notes |
Set NEW NOTE alert |
Company Profile |
SEC
News |
Chart |
Request a new note
C
A
S
I |
TDG
-
NYSE
TransDigm Group
Aerospace/Defense
|
$992.50
|
+19.43
2.00% |
$996.25
|
355,077
146.12% of 50 DAV
50 DAV is 243,000
|
$990.10
0.24%
|
11/9/2023
|
$982.68
|
PP = $940.10
|
|
MB = $987.11
|
Most Recent Note - 11/10/2023 5:16:41 PM
G - Color code is changed to green after rising above its "max buy" level for a new all-time with today's 11th consecutive gain. Reported Sep '23 quarterly earnings +46% on +23% sales revenues versus the year-ago period, its 10th consecutive comparison above the +25% minimum earnings guideline (C criteria).
>>> FEATURED STOCK ARTICLE : TransDigm's Big Gap Up Gain Triggered Technical Buy Signal - 11/9/2023 |
View all notes |
Set NEW NOTE alert |
Company Profile |
SEC
News |
Chart |
Request a new note
C
A
S
I |
Symbol/Exchange
Company Name
Industry Group |
PRICE |
CHANGE
(%Change) |
Day High |
Volume
(% DAV)
(% 50 day avg vol) |
52 Wk Hi
% From Hi |
Featured
Date |
Price
Featured |
Pivot Featured |
|
Max Buy |
|
|
|
THESE ARE NOT BUY RECOMMENDATIONS!
Comments contained in the body of this report are technical
opinions only. The material herein has been obtained
from sources believed to be reliable and accurate, however,
its accuracy and completeness cannot be guaranteed.
This site is not an investment advisor, hence it does
not endorse or recommend any securities or other investments.
Any recommendation contained in this report may not
be suitable for all investors and it is not to be deemed
an offer or solicitation on our part with respect to
the purchase or sale of any securities. All trademarks,
service marks and trade names appearing in this report
are the property of their respective owners, and are
likewise used for identification purposes only.
This report is a service available
only to active Paid Premium Members.
You may opt-out of receiving report notifications
at any time. Questions or comments may be submitted
by writing to Premium Membership Services 665 S.E. 10 Street, Suite 201 Deerfield Beach, FL 33441-5634 or by calling 1-800-965-8307
or 954-785-1121.
|
|
|