You are not logged in.
This means you
CAN ONLY VIEW reports that were published prior to Saturday, April 19, 2025.
You
MUST UPGRADE YOUR MEMBERSHIP if you want to see any current reports.
AFTER MARKET UPDATE - TUESDAY, OCTOBER 24TH, 2023
Previous After Market Report Next After Market Report >>>
|
|
|
|
DOW |
+204.97 |
33,141.38 |
+0.62% |
|
Volume |
899,693,594 |
+1% |
|
Volume |
4,703,114,500 |
-1% |
|
NASDAQ |
+121.55 |
13,139.87 |
+0.93% |
|
Advancers |
1,957 |
69% |
|
Advancers |
2,600 |
61% |
|
S&P 500 |
+30.64 |
4,247.68 |
+0.73% |
|
Decliners |
863 |
31% |
|
Decliners |
1,632 |
39% |
|
Russell 2000 |
+13.62 |
1,679.50 |
+0.82% |
|
52 Wk Highs |
8 |
|
|
52 Wk Highs |
28 |
|
|
S&P 600 |
+7.11 |
1,090.14 |
+0.66% |
|
52 Wk Lows |
188 |
|
|
52 Wk Lows |
352 |
|
|
 |
Leadership Still Lacking as Major Indices Post Small Gains
Kenneth J. Gruneisen - Passed the CAN SLIM® Master's Exam
The S&P 500 broke a five-day losing streak and closed above its 200-day moving average (4,236). All the major indices closed with gains, albeit off their highs, driven by broad based buying. The volume totals were slightly higher than the prior session on the NYSE and slightly lower on the Nasdaq exchange. Breadth was positive as advancers led decliners by more than a 2-1 margin on the NYSE and by a 5-3 margin on the Nasdaq exchange. There were only 2 high-ranked companies from the Leaders List that hit new 52-week highs and were listed on the BreakOuts Page, versus the total of 1 on the prior session. New 52-week lows totals contracted yet still solidly outnumbered new 52-week highs on the NYSE and on the Nasdaq exchange. The market averages are in an uptrend under pressure (M criteria). New buying efforts should be made only in stocks meeting all key criteria of the fact-based investment system.
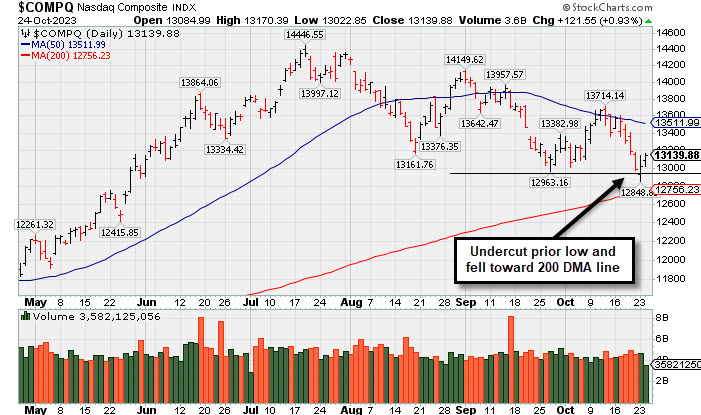
PICTURED: The Nasdaq Composite Index met resistance near its 50-day moving average then slumped below its prior low toward its 200-day moving average (DMA) line.
Tuesday's economic data included preliminary October S&P Global US Services PMI, which climbed to 50.9 from 50.1, and Manufacturing PMI, which rose to 50.0 from 49.8. Ten of the 11 S&P 500 sectors closed with a gain while the energy sector (-1.4%) settled in negative territory. The utilities (+2.8%) and communication services (+1.4%) sectors led the market.
Many stocks bounced back while it seemed Tuesday's overall positive bias was a function of recent weakness stirring a rebound mentality. A slate of mostly better-than-expected earnings results from blue chip names included Verizon (VZ +9.27%), Coca-Cola (KO +2.88%), Dow (DOW +2.07%), RTX (RTX +7.18%), General Electric (GE +6.50%), and 3M (MMM +5.28%) among the top performers.
Bank stocks were a pocket of weakness related to concerns about credit quality, deposit costs, and weakening loan demand. The 10-yr note yield settled unchanged at 4.84%. The 2-yr note yield rose four basis points to 5.10% following a $51 billion 2-yr note auction that was met with solid demand.
|
 Kenneth J. Gruneisen started out as a licensed stockbroker in August 1987, a couple of months prior to the historic stock market crash that took the Dow Jones Industrial Average down -22.6% in a single day. He has published daily fact-based fundamental and technical analysis on high-ranked stocks online for two decades. Through FACTBASEDINVESTING.COM, Kenneth provides educational articles, news, market commentary, and other information regarding proven investment systems that work in good times and bad.
Comments contained in the body of this report are technical opinions only and are not necessarily those of Gruneisen Growth Corp. The material herein has been obtained from sources believed to be reliable and accurate, however, its accuracy and completeness cannot be guaranteed. Our firm, employees, and customers may effect transactions, including transactions contrary to any recommendation herein, or have positions in the securities mentioned herein or options with respect thereto. Any recommendation contained in this report may not be suitable for all investors and it is not to be deemed an offer or solicitation on our part with respect to the purchase or sale of any securities. |
|
 |
Tech and Retail Indexes Led Group Gainers
Kenneth J. Gruneisen - Passed the CAN SLIM® Master's Exam
The Retail Index ($RLX +0.87%) poste an influential gain and the Broker/Dealer Index ($XBD +0.53%) eked out a small gain while the Bank Index ($BKX -0.03%) finished flat. The tech sector had a positive bias as the Biotech Index ($BTK +0.96%), Networking Index ($NWX +1.52%) and the Semiconductor Index ($SOX +1.38%) each posted solid gains. Energy-linked groups had a negative bias as the Integrated Oil Index ($XOI -1.43%) and Oil Services Index ($OSX -1.54%) both lost ground. The Gold & Silver Index ($XAU +0.11%) was little changed.
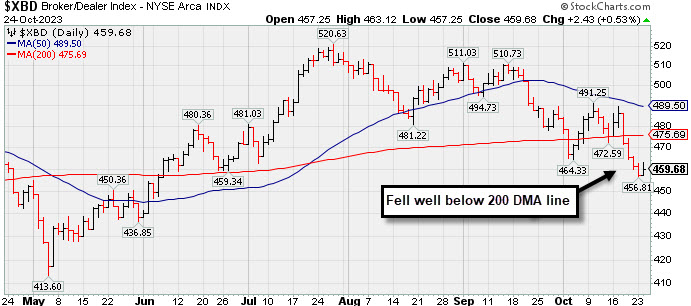
PICTURED: The Broker/Dealer Index ($XBD +0.53%) eked out a small gain. In a streak of 4 losses it slumped below the prior low and well below its 200-day moving average (DMA) line. Weak action in financial indexes is a bad sign for the broader market outlook, as longtime readers know that the financial indexes have been reliable leading indicators.
| Oil Services |
$OSX |
91.47 |
-1.43 |
-1.54% |
+9.08% |
| Integrated Oil |
$XOI |
1,902.45 |
-27.51 |
-1.43% |
+6.45% |
| Semiconductor |
$SOX |
3,343.94 |
+45.40 |
+1.38% |
+32.06% |
| Networking |
$NWX |
692.32 |
+10.39 |
+1.52% |
-11.62% |
| Broker/Dealer |
$XBD |
459.68 |
+2.43 |
+0.53% |
+2.35% |
| Retail |
$RLX |
3,308.79 |
+28.50 |
+0.87% |
+20.14% |
| Gold & Silver |
$XAU |
115.72 |
+0.13 |
+0.11% |
-4.25% |
| Bank |
$BKX |
72.51 |
-0.02 |
-0.03% |
-28.10% |
| Biotech |
$BTK |
4,747.24 |
+45.00 |
+0.96% |
-10.11% |
|
|
|
 |
Featured Stocks
Kenneth J. Gruneisen - Passed the CAN SLIM® Master's Exam
|
|
|
Color Codes Explained :
Y - Better candidates highlighted by our
staff of experts.
G - Previously featured
in past reports as yellow but may no longer be buyable under the
guidelines.
***Last / Change / Volume data in this table is the closing quote data***
|
|
|
THESE ARE NOT BUY RECOMMENDATIONS!
Comments contained in the body of this report are technical
opinions only. The material herein has been obtained
from sources believed to be reliable and accurate, however,
its accuracy and completeness cannot be guaranteed.
This site is not an investment advisor, hence it does
not endorse or recommend any securities or other investments.
Any recommendation contained in this report may not
be suitable for all investors and it is not to be deemed
an offer or solicitation on our part with respect to
the purchase or sale of any securities. All trademarks,
service marks and trade names appearing in this report
are the property of their respective owners, and are
likewise used for identification purposes only.
This report is a service available
only to active Paid Premium Members.
You may opt-out of receiving report notifications
at any time. Questions or comments may be submitted
by writing to Premium Membership Services 665 S.E. 10 Street, Suite 201 Deerfield Beach, FL 33441-5634 or by calling 1-800-965-8307
or 954-785-1121.
|
|
|