You are not logged in.
This means you
CAN ONLY VIEW reports that were published prior to Saturday, April 19, 2025.
You
MUST UPGRADE YOUR MEMBERSHIP if you want to see any current reports.
AFTER MARKET UPDATE - WEDNESDAY, OCTOBER 25TH, 2023
Previous After Market Report Next After Market Report >>>
|
|
|
|
DOW |
-105.45 |
33,035.93 |
-0.32% |
|
Volume |
922,481,271 |
+3% |
|
Volume |
4,635,413,200 |
-1% |
|
NASDAQ |
-318.65 |
12,821.22 |
-2.43% |
|
Advancers |
641 |
23% |
|
Advancers |
1,227 |
29% |
|
S&P 500 |
-60.91 |
4,186.77 |
-1.43% |
|
Decliners |
2,170 |
77% |
|
Decliners |
3,072 |
71% |
|
Russell 2000 |
-28.07 |
1,651.43 |
-1.67% |
|
52 Wk Highs |
11 |
|
|
52 Wk Highs |
22 |
|
|
S&P 600 |
-13.74 |
1,076.40 |
-1.26% |
|
52 Wk Lows |
400 |
|
|
52 Wk Lows |
600 |
|
|
The market averages are in a correction (M criteria). New buying efforts should be avoided until a solid follow-through day signals a new confirmed rally.
|
 |
Losses Signal Deeper Correction for Major Indices
Kenneth J. Gruneisen - Passed the CAN SLIM® Master's Exam
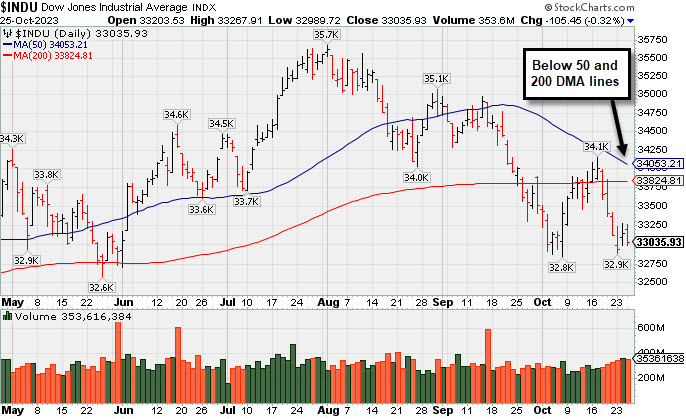
The major indices lost ground and ended near their lows of the day. The volume totals were mixed, higher than the prior session on the NYSE and lower on the Nasdaq exchange. Breadth was negative as decliners led advancers by more than a 3-1 margin on the NYSE and by a 5-2 margin on the Nasdaq exchange. There were only 4 high-ranked companies from the Leaders List that hit new 52-week highs and were listed on the BreakOuts Page, versus the total of 2 on the prior session. New 52-week lows totals expanded and solidly outnumbered new 52-week highs on the NYSE and on the Nasdaq exchange. The market averages are in a correction (M criteria). New buying efforts should be avoided until a solid follow-through day signals a new confirmed rally.
PICTURED: The Dow Jones Industrial Average has slumped below its 50-day and 200-day moving average (DMA) lines.
Nine of the 11 S&P 500 sectors declined. The communication services sector (-5.9%) was the worst performer by a wide margin, weighed down by Alphabet. The utilities (+0.5%) and consumer staples (+0.3%) sectors were alone in positive territory at the close. The mood of the market was impacted by a big loss in Alphabet (GOOG -9.60%) following an earnings report that contained some relatively disappointing growth for its cloud business. Meanwhile, Microsoft (MSFT +3.07%) was a winning standout after reporting some impressive growth for its Azure business.
General Dynamics (GD +4.03%), Visa (V +0.94%) and Waste Management (WM +6.10%) each posted gains after impressing with their quarterly results. Boeing (BA -2.54%) and Texas Instruments (TXN -3.49%) both saw sizable declines.
The 10-yr note yield climbed 11 basis points to 4.95% and the 2-yr note yield rose two basis points to 5.12%. The September New Home Sales report showed the strongest annual rate of sales (759,000) since February 2022. Another wave of selling hit the Treasury market following a $52 billion 5-yr note sale that met dismal demand.
In other news, Rep. Mike Johnson (R-LA) was elected Speaker of the House after receiving unanimous Republican support.
|
 Kenneth J. Gruneisen started out as a licensed stockbroker in August 1987, a couple of months prior to the historic stock market crash that took the Dow Jones Industrial Average down -22.6% in a single day. He has published daily fact-based fundamental and technical analysis on high-ranked stocks online for two decades. Through FACTBASEDINVESTING.COM, Kenneth provides educational articles, news, market commentary, and other information regarding proven investment systems that work in good times and bad.
Comments contained in the body of this report are technical opinions only and are not necessarily those of Gruneisen Growth Corp. The material herein has been obtained from sources believed to be reliable and accurate, however, its accuracy and completeness cannot be guaranteed. Our firm, employees, and customers may effect transactions, including transactions contrary to any recommendation herein, or have positions in the securities mentioned herein or options with respect thereto. Any recommendation contained in this report may not be suitable for all investors and it is not to be deemed an offer or solicitation on our part with respect to the purchase or sale of any securities. |
|
 |
Retail and Tech Indexes Led Widespread Losses
Kenneth J. Gruneisen - Passed the CAN SLIM® Master's Exam
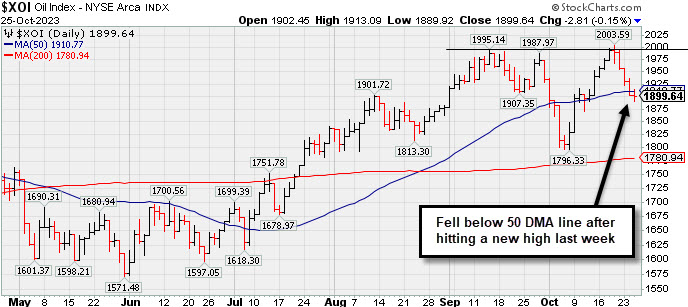
The Retail Index ($RLX -3.58%) suffered a big and influential loss. The Broker/Dealer Index ($XBD -1.95%) slumped while the Bank Index ($BKX -0.30%) suffered a smaller loss. The tech sector clearly had a negative bias as the Semiconductor Index ($SOX -4.13%) led the Biotech Index ($BTK -2.28%) and Networking Index ($NWX -2.04%) lower. Commodity-linked groups had a negative bias as the Gold & Silver Index ($XAU -1.64%) and Oil Services Index ($OSX -1.58%) both slumped while the Integrated Oil Index ($XOI -0.15%) was little changed.
PICTURED: The Integrated Oil Index ($XOI -0.15%) fell below its 50-day moving average (DMA) line with 5 consecutive losses after touching a new high last week.
| Oil Services |
$OSX |
90.03 |
-1.44 |
-1.58% |
+7.35% |
| Integrated Oil |
$XOI |
1,899.64 |
-2.81 |
-0.15% |
+6.29% |
| Semiconductor |
$SOX |
3,205.84 |
-138.10 |
-4.13% |
+26.61% |
| Networking |
$NWX |
678.17 |
-14.15 |
-2.04% |
-13.42% |
| Broker/Dealer |
$XBD |
450.72 |
-8.96 |
-1.95% |
+0.35% |
| Retail |
$RLX |
3,190.23 |
-118.56 |
-3.58% |
+15.84% |
| Gold & Silver |
$XAU |
113.83 |
-1.89 |
-1.64% |
-5.82% |
| Bank |
$BKX |
72.30 |
-0.22 |
-0.30% |
-28.31% |
| Biotech |
$BTK |
4,638.91 |
-108.33 |
-2.28% |
-12.16% |
|
|
|
 |
Featured Stocks
Kenneth J. Gruneisen - Passed the CAN SLIM® Master's Exam
|
|
|
Color Codes Explained :
Y - Better candidates highlighted by our
staff of experts.
G - Previously featured
in past reports as yellow but may no longer be buyable under the
guidelines.
***Last / Change / Volume data in this table is the closing quote data***
|
|
|
THESE ARE NOT BUY RECOMMENDATIONS!
Comments contained in the body of this report are technical
opinions only. The material herein has been obtained
from sources believed to be reliable and accurate, however,
its accuracy and completeness cannot be guaranteed.
This site is not an investment advisor, hence it does
not endorse or recommend any securities or other investments.
Any recommendation contained in this report may not
be suitable for all investors and it is not to be deemed
an offer or solicitation on our part with respect to
the purchase or sale of any securities. All trademarks,
service marks and trade names appearing in this report
are the property of their respective owners, and are
likewise used for identification purposes only.
This report is a service available
only to active Paid Premium Members.
You may opt-out of receiving report notifications
at any time. Questions or comments may be submitted
by writing to Premium Membership Services 665 S.E. 10 Street, Suite 201 Deerfield Beach, FL 33441-5634 or by calling 1-800-965-8307
or 954-785-1121.
|
|
|