You are not logged in.
This means you
CAN ONLY VIEW reports that were published prior to Saturday, April 19, 2025.
You
MUST UPGRADE YOUR MEMBERSHIP if you want to see any current reports.
AFTER MARKET UPDATE - MONDAY, OCTOBER 23RD, 2023
Previous After Market Report Next After Market Report >>>
|
|
|
|
DOW |
-190.87 |
32,936.41 |
-0.58% |
|
Volume |
892,762,114 |
-20% |
|
Volume |
4,735,996,600 |
+2% |
|
NASDAQ |
+34.52 |
13,018.33 |
+0.27% |
|
Advancers |
875 |
31% |
|
Advancers |
1,458 |
34% |
|
S&P 500 |
-7.12 |
4,217.04 |
-0.17% |
|
Decliners |
1,934 |
69% |
|
Decliners |
2,869 |
66% |
|
Russell 2000 |
-14.91 |
1,665.88 |
-0.89% |
|
52 Wk Highs |
7 |
|
|
52 Wk Highs |
16 |
|
|
S&P 600 |
-10.44 |
1,083.03 |
-0.95% |
|
52 Wk Lows |
445 |
|
|
52 Wk Lows |
639 |
|
|
 |
Nasdaq Composite Rose as Major Indices Sputtered
Kenneth J. Gruneisen - Passed the CAN SLIM® Master's Exam
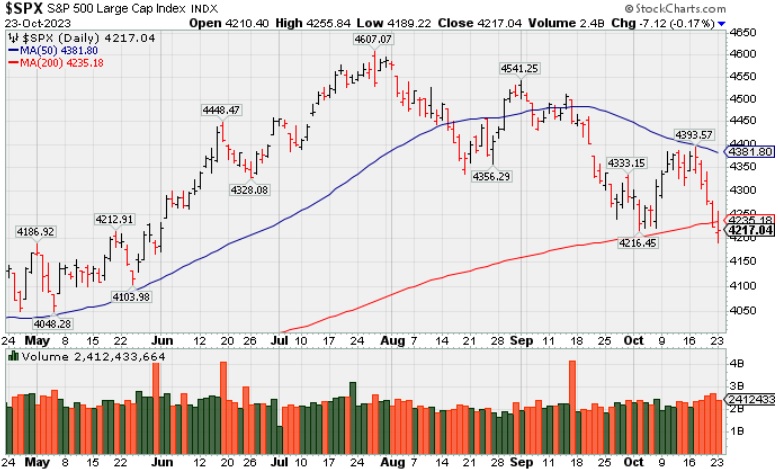
Relative strength from the mega cap space limited downside moves for the S&P 500 and Dow Jones Industrial Average while the Nasdaq Composite (+0.3%) closed with a small gain. The volume totals were lighter than the prior session on the NYSE and on the Nasdaq exchange. Breadth was negative as decliners led advancers by more than a 2-1 margin on the NYSE and by a 2-1 margin on the Nasdaq exchange. There was 1 high-ranked company from the Leaders List that hit a new 52-week high and was listed on the BreakOuts Page, versus the total of zero on the prior session. New 52-week lows totals expanded and solidly outnumbered new 52-week highs on the NYSE and on the Nasdaq exchange. The market averages are in an uptrend under pressure (M criteria). New buying efforts should be made only in stocks meeting all key criteria of the fact-based investment system.
PICTURED: The S&P 500 Index met resistance at its 50-day moving average then slumped below its 200-day moving average (DMA) line and below the prior low with 5 consecutive losses.
The energy sector (-1.6%) was the worst performer, weighed down by a loss in Chevron (CVX -3.69%), which announced a $53 billion, or $171.00 per share, all stock acquisition of Hess Corp. (HES -1.1%). A drop in oil prices ($85.50/bbl, -2.55, -2.9%) was spurred in part by global growth worries.
An X post from hedge fund manager Bill Ackman made it known he has covered his short in bonds because - "There is too much risk in the world to remain short bonds at current long-term rates." The 10-yr note yield moved from 4.97% to as low as 4.84% following his remark and the S&P 500 hit an intraday high of 4,255.
The Vanguard Mega Cap Growth ETF (MGK) climbed 0.4%. Despite reports of discounted iPhone 15 sales in China and supplier Foxconn facing a tax probe by Chinese authorities, Apple (AAPL +0.07%) ended the session slightly higher after trading down as much as -1.7%.
|
 Kenneth J. Gruneisen started out as a licensed stockbroker in August 1987, a couple of months prior to the historic stock market crash that took the Dow Jones Industrial Average down -22.6% in a single day. He has published daily fact-based fundamental and technical analysis on high-ranked stocks online for two decades. Through FACTBASEDINVESTING.COM, Kenneth provides educational articles, news, market commentary, and other information regarding proven investment systems that work in good times and bad.
Comments contained in the body of this report are technical opinions only and are not necessarily those of Gruneisen Growth Corp. The material herein has been obtained from sources believed to be reliable and accurate, however, its accuracy and completeness cannot be guaranteed. Our firm, employees, and customers may effect transactions, including transactions contrary to any recommendation herein, or have positions in the securities mentioned herein or options with respect thereto. Any recommendation contained in this report may not be suitable for all investors and it is not to be deemed an offer or solicitation on our part with respect to the purchase or sale of any securities. |
|
 |
Financial, Tech, and Commodity-Linked Groups Fell
Kenneth J. Gruneisen - Passed the CAN SLIM® Master's Exam
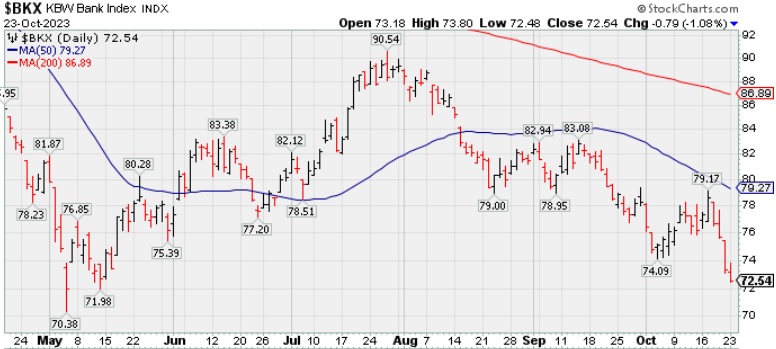
The Bank Index ($BKX -1.08%) and the Broker/Dealer Index ($XBD -0.91%) fell and created a drag on the major averages. The Retail Index ($RLX +0.27%) eked out a small gain. The tech sector had a negative bias as the Biotech Index ($BTK -1.27%) and Networking Index ($NWX -1.36%) both outpaced the Semiconductor Index ($SOX -0.53%) to the downside. Commodity-linked groups also had a negative bias as the Integrated Oil Index ($XOI -1.40%), Oil Services Index ($OSX -0.76%), and the Gold & Silver Index ($XAU -0.63%) ended unanimously lower.
PICTURED: The Bank Index ($BKX -1.08%) is slumping toward its May 2023 low.
| Oil Services |
$OSX |
92.90 |
-0.71 |
-0.76% |
+10.78% |
| Integrated Oil |
$XOI |
1,929.96 |
-27.36 |
-1.40% |
+7.98% |
| Semiconductor |
$SOX |
3,298.54 |
-17.60 |
-0.53% |
+30.27% |
| Networking |
$NWX |
681.94 |
-9.37 |
-1.36% |
-12.94% |
| Broker/Dealer |
$XBD |
457.25 |
-4.18 |
-0.91% |
+1.81% |
| Retail |
$RLX |
3,280.29 |
+8.73 |
+0.27% |
+19.11% |
| Gold & Silver |
$XAU |
115.59 |
-0.74 |
-0.63% |
-4.36% |
| Bank |
$BKX |
72.54 |
-0.79 |
-1.08% |
-28.07% |
| Biotech |
$BTK |
4,702.24 |
-60.51 |
-1.27% |
-10.96% |
|
|
|
 |
Featured Stocks
Kenneth J. Gruneisen - Passed the CAN SLIM® Master's Exam
|
|
|
Color Codes Explained :
Y - Better candidates highlighted by our
staff of experts.
G - Previously featured
in past reports as yellow but may no longer be buyable under the
guidelines.
***Last / Change / Volume data in this table is the closing quote data***
|
|
|
THESE ARE NOT BUY RECOMMENDATIONS!
Comments contained in the body of this report are technical
opinions only. The material herein has been obtained
from sources believed to be reliable and accurate, however,
its accuracy and completeness cannot be guaranteed.
This site is not an investment advisor, hence it does
not endorse or recommend any securities or other investments.
Any recommendation contained in this report may not
be suitable for all investors and it is not to be deemed
an offer or solicitation on our part with respect to
the purchase or sale of any securities. All trademarks,
service marks and trade names appearing in this report
are the property of their respective owners, and are
likewise used for identification purposes only.
This report is a service available
only to active Paid Premium Members.
You may opt-out of receiving report notifications
at any time. Questions or comments may be submitted
by writing to Premium Membership Services 665 S.E. 10 Street, Suite 201 Deerfield Beach, FL 33441-5634 or by calling 1-800-965-8307
or 954-785-1121.
|
|
|