You are not logged in.
This means you
CAN ONLY VIEW reports that were published prior to Sunday, April 20, 2025.
You
MUST UPGRADE YOUR MEMBERSHIP if you want to see any current reports.
AFTER MARKET UPDATE - FRIDAY, OCTOBER 20TH, 2023
Previous After Market Report Next After Market Report >>>
|
|
|
|
DOW |
-286.89 |
33,127.28 |
-0.86% |
|
Volume |
1,113,047,328 |
+14% |
|
Volume |
4,642,109,200 |
-8% |
|
NASDAQ |
-202.37 |
12,983.81 |
-1.53% |
|
Advancers |
765 |
28% |
|
Advancers |
1,362 |
32% |
|
S&P 500 |
-53.84 |
4,224.16 |
-1.26% |
|
Decliners |
2,001 |
72% |
|
Decliners |
2,905 |
68% |
|
Russell 2000 |
-21.91 |
1,680.79 |
-1.29% |
|
52 Wk Highs |
4 |
|
|
52 Wk Highs |
11 |
|
|
S&P 600 |
-13.09 |
1,093.47 |
-1.18% |
|
52 Wk Lows |
380 |
|
|
52 Wk Lows |
532 |
|
|
 |
Leadership Lacking as Major Indices Fell Again
Kenneth J. Gruneisen - Passed the CAN SLIM® Master's Exam
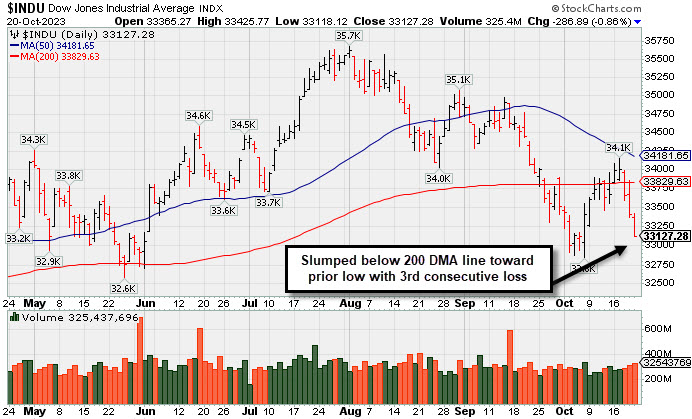
The major indices eac lost ground and settled near their worst levels of the day, which left the S&P 500 below its 200-day moving average (4,233). The volume totals were mixed, higher than the prior session on the NYSE and lighter on the Nasdaq exchange. Breadth was negative as decliners led advancers by about a 5-2 margin on the NYSE and more than a 2-1 margin on the Nasdaq exchange. There were zero high-ranked companies from the Leaders List that hit a new 52-week high and were listed on the BreakOuts Page, versus the total of 5 on the prior session. New 52-week lows totals expanded and solidly outnumbered shrinking new 52-week highs on the NYSE and on the Nasdaq exchange. The market averages are in an uptrend under pressure (M criteria). New buying efforts should be made only in stocks meeting all key criteria of the fact-based investment system.
PICTURED: The Dow Jones Industrial Average slumped below its 200-day moving average (DMA) line toward the prior low with a 3rd consecutive loss.
Eight of the 11 S&P 500 sectors closed down by at least 1.0%. The defensive-oriented consumer staples (-0.4%) and health care (-0.4%) sectors saw the smallest declines. Meanwhile, the energy (-1.7%) and information technology (-1.7%) sectors logged the steepest losses. Uncertainty surrounding potential developments in the Israel-Hamas conflict and ongoing interest rate volatility contributed to a "risk-off" vibe. The 10-yr note yield ultimately settled at 4.92%, which was six basis points lower.
Ongoing dysfunction in the House of Representatives followed three failed rounds of voting as Rep. Jim Jordan (R-OH) lost the status of Speaker of the House nominee.
Weakness in regional bank stocks was another overhang for the market while Regions Financial (RF -12.38%), Comerica (CMA -8.53%), and Western Alliance Bancorp (WAL -8.38%) were among the losing standouts. Dow component American Express (AXP -5.4%) fell after reporting better than expected earnings and reaffirmed FY23 guidance.
|
 Kenneth J. Gruneisen started out as a licensed stockbroker in August 1987, a couple of months prior to the historic stock market crash that took the Dow Jones Industrial Average down -22.6% in a single day. He has published daily fact-based fundamental and technical analysis on high-ranked stocks online for two decades. Through FACTBASEDINVESTING.COM, Kenneth provides educational articles, news, market commentary, and other information regarding proven investment systems that work in good times and bad.
Comments contained in the body of this report are technical opinions only and are not necessarily those of Gruneisen Growth Corp. The material herein has been obtained from sources believed to be reliable and accurate, however, its accuracy and completeness cannot be guaranteed. Our firm, employees, and customers may effect transactions, including transactions contrary to any recommendation herein, or have positions in the securities mentioned herein or options with respect thereto. Any recommendation contained in this report may not be suitable for all investors and it is not to be deemed an offer or solicitation on our part with respect to the purchase or sale of any securities. |
|
 |
Financial, Retail, Tech, and Energy-Linked Groups Fell
Kenneth J. Gruneisen - Passed the CAN SLIM® Master's Exam
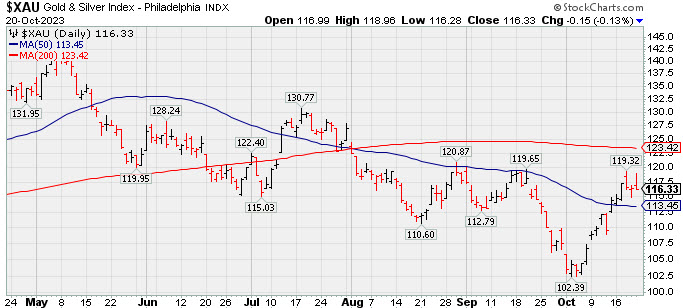
The Bank Index ($BKX -3.11%) slumped and the Broker/Dealer Index ($XBD -0.83%) also created a drag on the major averages. The Retail Index ($RLX -1.63%) fell. The tech sector had a negative bias as the Biotech Index ($BTK -0.44%), Networking Index ($NWX -1.15%), and the Semiconductor Index ($SOX -1.53%) each lost ground. The Integrated Oil Index ($XOI -1.62%) and the Oil Services Index ($OSX -2.25%) suffered a larger losses while Gold & Silver Index ($XAU -0.13%) was little changed.
PICTURED: The Gold & Silver Index ($XAU -0.13%) is consolidating above its 50-day moving average (DMA) line after rebounding nicely from the October 2023 low.
| Oil Services |
$OSX |
93.61 |
-2.15 |
-2.25% |
+11.63% |
| Integrated Oil |
$XOI |
1,957.32 |
-32.30 |
-1.62% |
+9.52% |
| Semiconductor |
$SOX |
3,316.14 |
-51.63 |
-1.53% |
+30.96% |
| Networking |
$NWX |
691.31 |
-8.02 |
-1.15% |
-11.75% |
| Broker/Dealer |
$XBD |
461.43 |
-3.85 |
-0.83% |
+2.74% |
| Retail |
$RLX |
3,271.56 |
-54.36 |
-1.63% |
+18.79% |
| Gold & Silver |
$XAU |
116.33 |
-0.15 |
-0.13% |
-3.75% |
| Bank |
$BKX |
73.33 |
-2.35 |
-3.11% |
-27.29% |
| Biotech |
$BTK |
4,762.75 |
-20.91 |
-0.44% |
-9.82% |
|
|
|
 |
Featured Stocks
Kenneth J. Gruneisen - Passed the CAN SLIM® Master's Exam
|
|
|
Color Codes Explained :
Y - Better candidates highlighted by our
staff of experts.
G - Previously featured
in past reports as yellow but may no longer be buyable under the
guidelines.
***Last / Change / Volume data in this table is the closing quote data***
|
|
|
THESE ARE NOT BUY RECOMMENDATIONS!
Comments contained in the body of this report are technical
opinions only. The material herein has been obtained
from sources believed to be reliable and accurate, however,
its accuracy and completeness cannot be guaranteed.
This site is not an investment advisor, hence it does
not endorse or recommend any securities or other investments.
Any recommendation contained in this report may not
be suitable for all investors and it is not to be deemed
an offer or solicitation on our part with respect to
the purchase or sale of any securities. All trademarks,
service marks and trade names appearing in this report
are the property of their respective owners, and are
likewise used for identification purposes only.
This report is a service available
only to active Paid Premium Members.
You may opt-out of receiving report notifications
at any time. Questions or comments may be submitted
by writing to Premium Membership Services 665 S.E. 10 Street, Suite 201 Deerfield Beach, FL 33441-5634 or by calling 1-800-965-8307
or 954-785-1121.
|
|
|