You are not logged in.
This means you
CAN ONLY VIEW reports that were published prior to Monday, April 21, 2025.
You
MUST UPGRADE YOUR MEMBERSHIP if you want to see any current reports.
AFTER MARKET UPDATE - FRIDAY, OCTOBER 6TH, 2023
Previous After Market Report Next After Market Report >>>
|
|
|
|
DOW |
+288.01 |
33,407.58 |
+0.87% |
|
Volume |
939,128,243 |
+6% |
|
Volume |
4,430,395,600 |
+4% |
|
NASDAQ |
+211.51 |
13,431.34 |
+1.60% |
|
Advancers |
1,799 |
64% |
|
Advancers |
2,672 |
62% |
|
S&P 500 |
+50.31 |
4,308.50 |
+1.18% |
|
Decliners |
1,011 |
36% |
|
Decliners |
1,612 |
38% |
|
Russell 2000 |
+14.05 |
1,745.56 |
+0.81% |
|
52 Wk Highs |
26 |
|
|
52 Wk Highs |
35 |
|
|
S&P 600 |
+6.31 |
1,124.00 |
+0.56% |
|
52 Wk Lows |
326 |
|
|
52 Wk Lows |
316 |
|
|
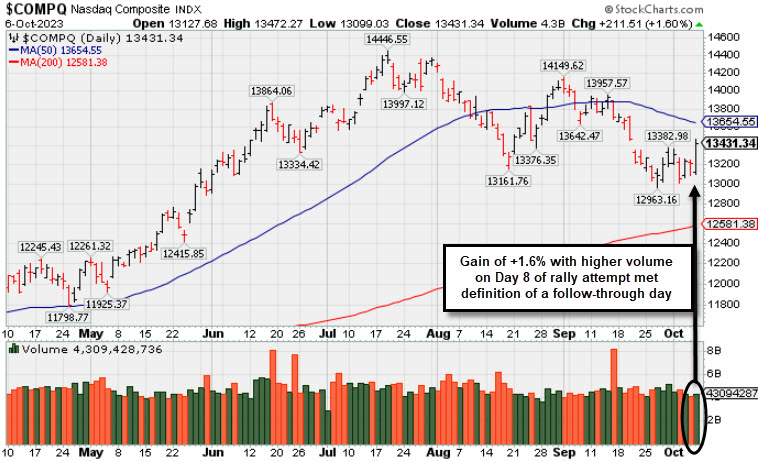
The Nasdaq Composite Index's solid gain with higher volume and with an expansion in new highs signaled a new market uptrend (M criteria) confirmed by a follow-through day. New buying efforts should be made only in stock meeting all key criteria of the fact-based investment system.
|
 |
Major Indices Rose With Nasdaq Gain of +1.6% a Follow Through
Kenneth J. Gruneisen - Passed the CAN SLIM® Master's Exam
The major indices closed Friday's session near their highs, which had the S&P 500 (+1.2%). The Nasdaq Composite, Russell 2000, and Dow Jones Industrial Average rose 1.6%, 1.0%, and 0.9%, respectively. The volume totals were higher than the prior session on the NYSE and on the Nasdaq exchange. Advancers led decliners by a 9-5 margin on the NYSE and by a 5-3 margin on the Nasdaq exchange. Leadership improved as there were 22 high-ranked companies from the Leaders List that hit a new 52-week high and were listed on the BreakOuts Page, versus the total of 8 on the prior session. New 52-week lows totals still solidly outnumbered new 52-week highs totals on the NYSE and on the Nasdaq exchange. The Nasdaq Composite Index's solid gain with higher volume and with an expansion in new highs signaled a new market uptrend (M criteria) confirmed by a follow-through day. New buying efforts should be made only in stock meeting all key criteria of the fact-based investment system.
PICTURED: The Nasdaq Composite Index rose +1.6% with higher volume on Day 8 of the rally. It remains below its 50-day moving average (DMA) line.
Stocks initially moved lower after a sharp move higher in Treasury yields. A strong nonfarm payrolls number for September was accompanied by upward revisions to July and August data that summed to 119,000 more jobs than previously thought. Treasury yields quickly pulled back. The 2-yr note yield settled at 5.06% and the 10-yr note yield rose to 4.78%.
Mega cap stocks led the recovery, and market breadth saw advancers move comfortably ahead of decliners as the rebound gained steam. Ten of 11 S&P 500 sectors closed the session with gains. The heavily-weighted information technology sector (+1.9%) led the pack while the consumer staples sector (-0.5%) was alone in the red.
|
 Kenneth J. Gruneisen started out as a licensed stockbroker in August 1987, a couple of months prior to the historic stock market crash that took the Dow Jones Industrial Average down -22.6% in a single day. He has published daily fact-based fundamental and technical analysis on high-ranked stocks online for two decades. Through FACTBASEDINVESTING.COM, Kenneth provides educational articles, news, market commentary, and other information regarding proven investment systems that work in good times and bad.
Comments contained in the body of this report are technical opinions only and are not necessarily those of Gruneisen Growth Corp. The material herein has been obtained from sources believed to be reliable and accurate, however, its accuracy and completeness cannot be guaranteed. Our firm, employees, and customers may effect transactions, including transactions contrary to any recommendation herein, or have positions in the securities mentioned herein or options with respect thereto. Any recommendation contained in this report may not be suitable for all investors and it is not to be deemed an offer or solicitation on our part with respect to the purchase or sale of any securities. |
|
 |
Financial, Retail, Tech, and Commodity-Linked Groups Rose
Kenneth J. Gruneisen - Passed the CAN SLIM® Master's Exam
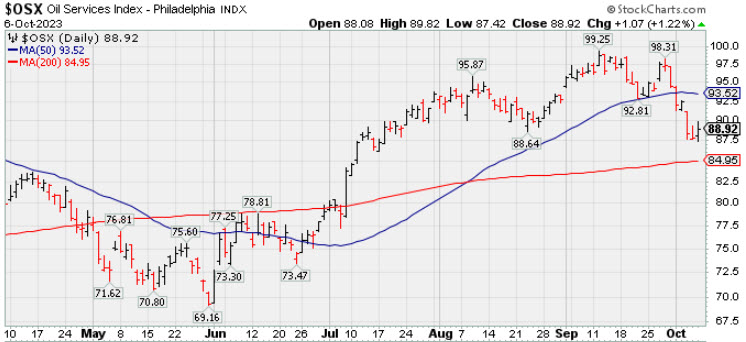
The Bank Index ($BKX +0.75%), Broker/Dealer Index ($XBD +1.48%), and the Retail Index ($RLX +1.11%) each posted gains on Friday. The tech sector had a positive bias as the Semiconductor Index ($SOX +2.00%) and Networking Index ($NWX +1.91%) both outpaced the Biotech Index ($BTK +0.26%). Commodity-linked groups also rose as the Oil Services Index ($OSX +1.22%), Integrated Oil Index ($XOI +1.25%), and the Gold & Silver Index ($XAU +2.19%) rounded out the mostlyu positive session.
PICTURED: The Oil Services Index ($OSX +1.22%) posted a gain on Friday. It has been slumping toward its 200 DMA line.
| Oil Services |
$OSX |
88.92 |
+1.07 |
+1.22% |
+6.03% |
| Integrated Oil |
$XOI |
1,829.25 |
+22.61 |
+1.25% |
+2.35% |
| Semiconductor |
$SOX |
3,475.21 |
+68.24 |
+2.00% |
+37.25% |
| Networking |
$NWX |
715.54 |
+13.43 |
+1.91% |
-8.65% |
| Broker/Dealer |
$XBD |
483.62 |
+7.08 |
+1.48% |
+7.68% |
| Retail |
$RLX |
3,344.29 |
+36.59 |
+1.11% |
+21.43% |
| Gold & Silver |
$XAU |
106.66 |
+2.28 |
+2.19% |
-11.75% |
| Bank |
$BKX |
76.08 |
+0.56 |
+0.75% |
-24.56% |
| Biotech |
$BTK |
5,034.85 |
+13.18 |
+0.26% |
-4.66% |
|
|
|
 |
Featured Stocks
Kenneth J. Gruneisen - Passed the CAN SLIM® Master's Exam
|
|
|
Color Codes Explained :
Y - Better candidates highlighted by our
staff of experts.
G - Previously featured
in past reports as yellow but may no longer be buyable under the
guidelines.
***Last / Change / Volume data in this table is the closing quote data***
|
|
|
THESE ARE NOT BUY RECOMMENDATIONS!
Comments contained in the body of this report are technical
opinions only. The material herein has been obtained
from sources believed to be reliable and accurate, however,
its accuracy and completeness cannot be guaranteed.
This site is not an investment advisor, hence it does
not endorse or recommend any securities or other investments.
Any recommendation contained in this report may not
be suitable for all investors and it is not to be deemed
an offer or solicitation on our part with respect to
the purchase or sale of any securities. All trademarks,
service marks and trade names appearing in this report
are the property of their respective owners, and are
likewise used for identification purposes only.
This report is a service available
only to active Paid Premium Members.
You may opt-out of receiving report notifications
at any time. Questions or comments may be submitted
by writing to Premium Membership Services 665 S.E. 10 Street, Suite 201 Deerfield Beach, FL 33441-5634 or by calling 1-800-965-8307
or 954-785-1121.
|
|
|