You are not logged in.
This means you
CAN ONLY VIEW reports that were published prior to Monday, April 21, 2025.
You
MUST UPGRADE YOUR MEMBERSHIP if you want to see any current reports.
AFTER MARKET UPDATE - MONDAY, OCTOBER 9TH, 2023
Previous After Market Report Next After Market Report >>>
|
|
|
|
DOW |
+197.07 |
33,604.65 |
+0.59% |
|
Volume |
747,204,380 |
-20% |
|
Volume |
3,869,435,300 |
-13% |
|
NASDAQ |
+52.90 |
13,484.24 |
+0.39% |
|
Advancers |
1,923 |
68% |
|
Advancers |
2,004 |
47% |
|
S&P 500 |
+27.16 |
4,335.66 |
+0.63% |
|
Decliners |
888 |
32% |
|
Decliners |
2,237 |
53% |
|
Russell 2000 |
+10.44 |
1,755.99 |
+0.60% |
|
52 Wk Highs |
29 |
|
|
52 Wk Highs |
39 |
|
|
S&P 600 |
+9.49 |
1,133.49 |
+0.84% |
|
52 Wk Lows |
94 |
|
|
52 Wk Lows |
327 |
|
|
The Nasdaq Composite Index's solid gain on Friday with higher volume and with an expansion in new highs signaled a new market uptrend (M criteria) confirmed by a follow-through day. New buying efforts should be made only in stocks meeting all key criteria of the fact-based investment system.
|
 |
Indices Overcame Early Weakness to Post Gains with Lighter Volume
Kenneth J. Gruneisen - Passed the CAN SLIM® Master's Exam
The major indices overcame early weakness and rallied in the afternoon trade, finishing the session near their highs of the day. The volume totals were lighter than the prior session on the NYSE and on the Nasdaq exchange, revealing lackluster buying demand from the institutional crowd. Advancers led decliners by more than a 2-1 margin on the NYSE but decliners led advancers by a narrow margin on the Nasdaq exchange. There were 22 high-ranked companies from the Leaders List that hit a new 52-week high and were listed on the BreakOuts Page, matching the total of 22 on the prior session. New 52-week lows totals still solidly outnumbered new 52-week highs totals on the NYSE and on the Nasdaq exchange. The Nasdaq Composite Index's solid gain on Friday with higher volume and with an expansion in new highs signaled a new market uptrend (M criteria) confirmed by a follow-through day. New buying efforts should be made only in stocks meeting all key criteria of the fact-based investment system.
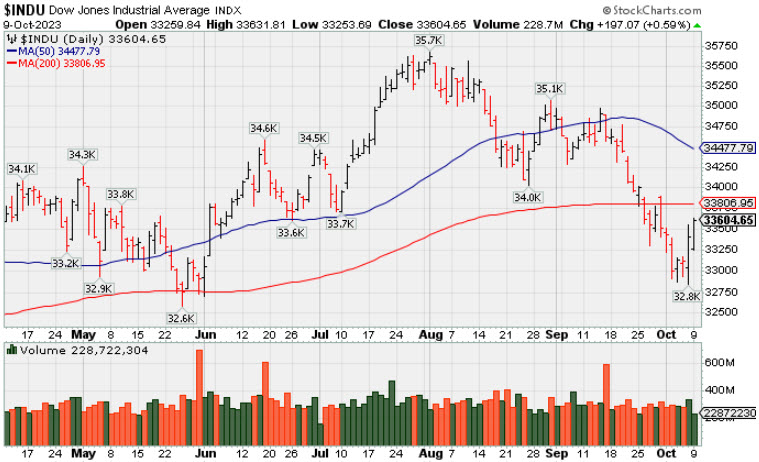
PICTURED: The Dow Jones Industrial Average posted a 2nd consecutive gain off of the recent low. It is rebounding toward its 200-day moving average (DMA) line but remains well below its 50 DMA line.
There was uncertainty associated with the Israel-Hamas war. Oil prices traded higher in response to the Israel-Hamas conflict, which some fear could turn into a wider regional conflict. WTI crude oil futures rose 4.1% to $86.42/bbl. The move in oil helped drive a 3.5% gain in the S&P 500 energy sector. The industrials sector (+1.6%) was the next best performer, benefitting from outsized gains in its defense components like Northrop Grumman (NOC +11.43%), L3Harris (LHX +9.96%), and Lockheed Martin (LMT +8.93%).
|
 Kenneth J. Gruneisen started out as a licensed stockbroker in August 1987, a couple of months prior to the historic stock market crash that took the Dow Jones Industrial Average down -22.6% in a single day. He has published daily fact-based fundamental and technical analysis on high-ranked stocks online for two decades. Through FACTBASEDINVESTING.COM, Kenneth provides educational articles, news, market commentary, and other information regarding proven investment systems that work in good times and bad.
Comments contained in the body of this report are technical opinions only and are not necessarily those of Gruneisen Growth Corp. The material herein has been obtained from sources believed to be reliable and accurate, however, its accuracy and completeness cannot be guaranteed. Our firm, employees, and customers may effect transactions, including transactions contrary to any recommendation herein, or have positions in the securities mentioned herein or options with respect thereto. Any recommendation contained in this report may not be suitable for all investors and it is not to be deemed an offer or solicitation on our part with respect to the purchase or sale of any securities. |
|
 |
Commodity-Linked Groups Posted Standout Gains
Kenneth J. Gruneisen - Passed the CAN SLIM® Master's Exam
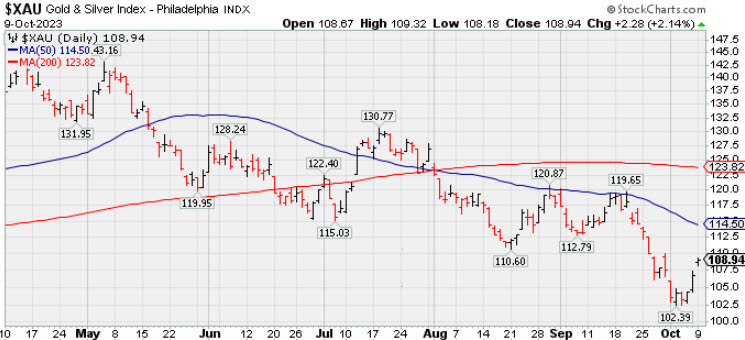
Commodity-linked groups were standout gainers as the Oil Services Index ($OSX +4.61%), Integrated Oil Index ($XOI +3.69%), and the Gold & Silver Index ($XAU +2.14%) each posted a solid gain. The Bank Index ($BKX +0.10%), Broker/Dealer Index ($XBD +0.17%), and the Retail Index ($RLX +0.44%) each posted small gains on Monday. The tech sector was mixed with the Semiconductor Index ($SOX -0.23%) and the Biotech Index ($BTK -0.60%) both edging lower while the Networking Index ($NWX +1.21%) rose.
PICTURED: The Gold & Silver Index ($XAU +2.14%) posted a 3rd consecutive gain on Monday, recovering from its 2023 low.
| Oil Services |
$OSX |
93.02 |
+4.10 |
+4.61% |
+10.92% |
| Integrated Oil |
$XOI |
1,896.68 |
+67.43 |
+3.69% |
+6.12% |
| Semiconductor |
$SOX |
3,467.35 |
-7.86 |
-0.23% |
+36.94% |
| Networking |
$NWX |
724.18 |
+8.65 |
+1.21% |
-7.55% |
| Broker/Dealer |
$XBD |
484.45 |
+0.83 |
+0.17% |
+7.86% |
| Retail |
$RLX |
3,359.00 |
+14.71 |
+0.44% |
+21.97% |
| Gold & Silver |
$XAU |
108.94 |
+2.28 |
+2.14% |
-9.86% |
| Bank |
$BKX |
76.16 |
+0.08 |
+0.10% |
-24.49% |
| Biotech |
$BTK |
5,004.63 |
-30.22 |
-0.60% |
-5.24% |
|
|
|
 |
Featured Stocks
Kenneth J. Gruneisen - Passed the CAN SLIM® Master's Exam
|
|
|
Color Codes Explained :
Y - Better candidates highlighted by our
staff of experts.
G - Previously featured
in past reports as yellow but may no longer be buyable under the
guidelines.
***Last / Change / Volume data in this table is the closing quote data***
|
|
|
THESE ARE NOT BUY RECOMMENDATIONS!
Comments contained in the body of this report are technical
opinions only. The material herein has been obtained
from sources believed to be reliable and accurate, however,
its accuracy and completeness cannot be guaranteed.
This site is not an investment advisor, hence it does
not endorse or recommend any securities or other investments.
Any recommendation contained in this report may not
be suitable for all investors and it is not to be deemed
an offer or solicitation on our part with respect to
the purchase or sale of any securities. All trademarks,
service marks and trade names appearing in this report
are the property of their respective owners, and are
likewise used for identification purposes only.
This report is a service available
only to active Paid Premium Members.
You may opt-out of receiving report notifications
at any time. Questions or comments may be submitted
by writing to Premium Membership Services 665 S.E. 10 Street, Suite 201 Deerfield Beach, FL 33441-5634 or by calling 1-800-965-8307
or 954-785-1121.
|
|
|