You are not logged in.
This means you
CAN ONLY VIEW reports that were published prior to Monday, April 21, 2025.
You
MUST UPGRADE YOUR MEMBERSHIP if you want to see any current reports.
AFTER MARKET UPDATE - THURSDAY, OCTOBER 5TH, 2023
Previous After Market Report Next After Market Report >>>
|
|
|
|
DOW |
-9.98 |
33,119.57 |
-0.03% |
|
Volume |
883,781,650 |
-5% |
|
Volume |
4,277,640,200 |
-1% |
|
NASDAQ |
-16.18 |
13,219.83 |
-0.12% |
|
Advancers |
1,254 |
45% |
|
Advancers |
2,103 |
49% |
|
S&P 500 |
-5.56 |
4,258.19 |
-0.13% |
|
Decliners |
1,550 |
55% |
|
Decliners |
2,159 |
51% |
|
Russell 2000 |
+2.50 |
1,731.51 |
+0.14% |
|
52 Wk Highs |
9 |
|
|
52 Wk Highs |
26 |
|
|
S&P 600 |
-1.79 |
1,117.69 |
-0.16% |
|
52 Wk Lows |
202 |
|
|
52 Wk Lows |
355 |
|
|
Damaging losses have signaled a more serious market correction (M criteria). During market corrections, disciplined investors know to reduce exposure and raise cash by selling any weakening stocks on a case-by-case basis.
|
 |
Major Indices Showed Indecisive Action and Thin Leadership
Kenneth J. Gruneisen - Passed the CAN SLIM® Master's Exam
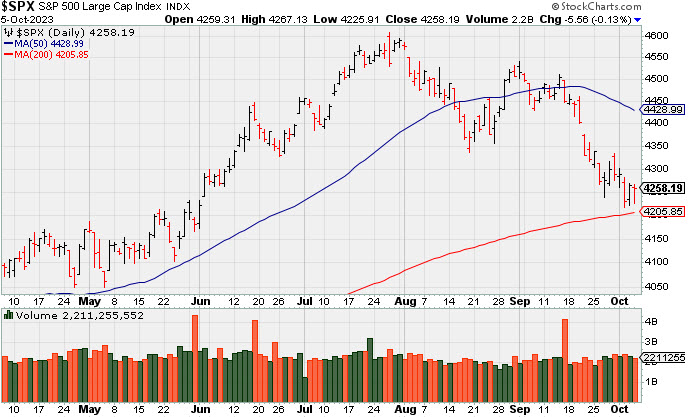
The major indices ended slightly lower. The volume totals were lighter than the prior session on the NYSE and on the Nasdaq exchange. Decliners led advancers by a 5-4 margin on the NYSE while the mix was near even on the Nasdaq exchange. There were 8 high-ranked companies from the Leaders List that hit a new 52-week high and were listed on the BreakOuts Page, versus the total of 4 on the prior session. New 52-week lows totals contracted yet still solidly outnumbered thin new 52-week highs totals on the NYSE and on the Nasdaq exchange. The major indices are in a correction (M criteria). New buying efforts should be avoided until a new rally is confirmed by a solid follow-through day.
PICTURED: The S&P 500 Index has slumped toward its 200-day moving average (DMA) line.
Stocks languished despite a modest drop in yields. The major indices were able to close well off their lows of the day, albeit with modest declines. Buyers were seemingly hesitant in front of the September jobs report due Friday, Treasuries saw the 10-yr note yield finish at 4.71% while the 2-yr note yield ended up settling the session six basis points lower at 5.03%.
Seven of the 11 S&P 500 sectors registered declines. The consumer staples sector (-2.1%) was the worst performer by a wide margin due in part to a big loss in Clorox (CLX -5.23%) following its disappointing guidance. The materials sector (-1.3%) was the next worst performer. The real estate (+0.7%), health care (+0.5%), financials (+0.4%), and information technology (+0.3%) sectors ended in the green at the close.
WTI crude oil futures extended their losses by dropping another -2.9% to $82.29/bbl. That weakness, along with the decline in Exxon Mobil (XOM -2.25%), drove the underperformance of the energy sector (-0.6%).
|
 Kenneth J. Gruneisen started out as a licensed stockbroker in August 1987, a couple of months prior to the historic stock market crash that took the Dow Jones Industrial Average down -22.6% in a single day. He has published daily fact-based fundamental and technical analysis on high-ranked stocks online for two decades. Through FACTBASEDINVESTING.COM, Kenneth provides educational articles, news, market commentary, and other information regarding proven investment systems that work in good times and bad.
Comments contained in the body of this report are technical opinions only and are not necessarily those of Gruneisen Growth Corp. The material herein has been obtained from sources believed to be reliable and accurate, however, its accuracy and completeness cannot be guaranteed. Our firm, employees, and customers may effect transactions, including transactions contrary to any recommendation herein, or have positions in the securities mentioned herein or options with respect thereto. Any recommendation contained in this report may not be suitable for all investors and it is not to be deemed an offer or solicitation on our part with respect to the purchase or sale of any securities. |
|
 |
Biotech, Gold & Silver, and Financial Indexes Rose
Kenneth J. Gruneisen - Passed the CAN SLIM® Master's Exam
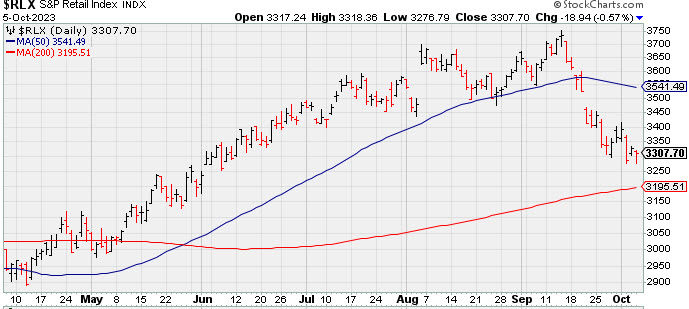
The Bank Index ($BKX +0.51%) and Broker/Dealer Index ($XBD +1.21%) each posted gains while the Retail Index ($RLX -0.57%) edged lower. The tech sector was mixed as the Biotech Index ($BTK +1.49%) posted a solid gain, The Networking Index ($NWX -3.02%) wasa standout decliner as it fell more than -3%,. Commodity-linked groups were mixed as the Oil Services Index ($OSX -0.56%) and the Integrated Oil Index ($XOI -0.38%) both edged lower while the Gold & Silver Index ($XAU 1.02%) rose.
PICTURED: The Retail Index ($RLX -0.57%) edged lower, slumping toward its 200 DMA line.
| Oil Services |
$OSX |
87.85 |
-0.49 |
-0.56% |
+4.75% |
| Integrated Oil |
$XOI |
1,806.64 |
-6.81 |
-0.38% |
+1.08% |
| Semiconductor |
$SOX |
3,406.98 |
-17.94 |
-0.52% |
+34.55% |
| Networking |
$NWX |
702.11 |
-21.84 |
-3.02% |
-10.37% |
| Broker/Dealer |
$XBD |
476.55 |
+5.68 |
+1.21% |
+6.10% |
| Retail |
$RLX |
3,307.70 |
-18.94 |
-0.57% |
+20.11% |
| Gold & Silver |
$XAU |
104.37 |
+1.06 |
+1.02% |
-13.64% |
| Bank |
$BKX |
75.52 |
+0.38 |
+0.51% |
-25.12% |
| Biotech |
$BTK |
5,021.67 |
+73.63 |
+1.49% |
-4.91% |
|
|
|
 |
Featured Stocks
Kenneth J. Gruneisen - Passed the CAN SLIM® Master's Exam
|
|
|
Color Codes Explained :
Y - Better candidates highlighted by our
staff of experts.
G - Previously featured
in past reports as yellow but may no longer be buyable under the
guidelines.
***Last / Change / Volume data in this table is the closing quote data***
|
|
|
THESE ARE NOT BUY RECOMMENDATIONS!
Comments contained in the body of this report are technical
opinions only. The material herein has been obtained
from sources believed to be reliable and accurate, however,
its accuracy and completeness cannot be guaranteed.
This site is not an investment advisor, hence it does
not endorse or recommend any securities or other investments.
Any recommendation contained in this report may not
be suitable for all investors and it is not to be deemed
an offer or solicitation on our part with respect to
the purchase or sale of any securities. All trademarks,
service marks and trade names appearing in this report
are the property of their respective owners, and are
likewise used for identification purposes only.
This report is a service available
only to active Paid Premium Members.
You may opt-out of receiving report notifications
at any time. Questions or comments may be submitted
by writing to Premium Membership Services 665 S.E. 10 Street, Suite 201 Deerfield Beach, FL 33441-5634 or by calling 1-800-965-8307
or 954-785-1121.
|
|
|