You are not logged in.
This means you
CAN ONLY VIEW reports that were published prior to Monday, April 21, 2025.
You
MUST UPGRADE YOUR MEMBERSHIP if you want to see any current reports.
AFTER MARKET UPDATE - WEDNESDAY, OCTOBER 4TH, 2023
Previous After Market Report Next After Market Report >>>
|
|
|
|
DOW |
+127.17 |
33,129.55 |
+0.39% |
|
Volume |
926,684,318 |
-0% |
|
Volume |
4,334,043,000 |
-8% |
|
NASDAQ |
+176.54 |
13,236.01 |
+1.35% |
|
Advancers |
1,700 |
61% |
|
Advancers |
2,382 |
55% |
|
S&P 500 |
+34.30 |
4,263.75 |
+0.81% |
|
Decliners |
1,108 |
39% |
|
Decliners |
1,918 |
45% |
|
Russell 2000 |
+1.86 |
1,729.01 |
+0.11% |
|
52 Wk Highs |
10 |
|
|
52 Wk Highs |
24 |
|
|
S&P 600 |
+3.03 |
1,119.48 |
+0.27% |
|
52 Wk Lows |
242 |
|
|
52 Wk Lows |
460 |
|
|
Damaging losses have signaled a more serious market correction (M criteria). During market corrections, disciplined investors know to reduce exposure and raise cash by selling any weakening stocks on a case-by-case basis.
|
 |
Major Indices Rose on Lighter Volume and Less Leadership
Kenneth J. Gruneisen - Passed the CAN SLIM® Master's Exam
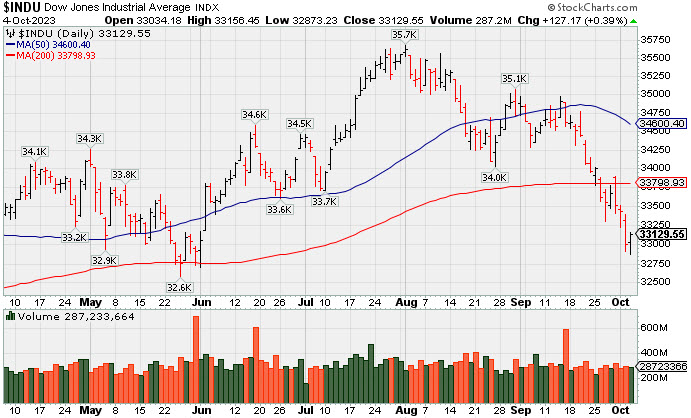
The major averages posted gains and ended near their session highs. The volume totals were lighter than the prior session on the NYSE and on the Nasdaq exchange. Advancers led decliners by a 3-2 margin on the NYSE and by about a 6-5 margin on the Nasdaq exchange. There were 4 high-ranked companies from the Leaders List that hit a new 52-week high and were listed on the BreakOuts Page, versus the total of 3 on the prior session. New 52-week lows totals solidly outnumbered new 52-week highs totals on the NYSE and on the Nasdaq exchange. The major indices are in a correction (M criteria). New buying efforts should be avoided until a new rally is confirmed by a solid follow-through day.
PICTURED: The Dow Jones Industrial Average has slumped well below its 200-day moving average (DMA) line toward the May 2023 low.
The ADP Employment Change Report showed weaker-than-expected job growth in September. The ISM Services PMI showed a modest deceleration in the pace of expansion versus August, but August factory orders came in much stronger than expected, rebounding smartly from a decline in July.
Nine of the 11 S&P 500 sectors rose. Apple (AAPL +0.73%) rose despite an analyst downgrade. Semiconductor and growth stocks acted as support for the broader market. The consumer discretionary (+2.0%), communication services (+1.3%), and information technology (+1.3%) sectors were the strongest. Meanwhile, the energy sector (-3.4%) logged the biggest decline as oil prices dropped -5.2% to $84.70/bbl.
The decline in energy prices was attributed to concerns about weakening demand in a slower growth environment influenced by higher interest rates. The 2-yr note yield settled at 5.09%, five basis points lower. The 10-yr note yield settled at 4.74%. Meanwhile, political uncertainty grew after the House voted 216-210 in an unprecedented action to remove Kevin McCarthy as Speaker of the House. This seems likely to complicate the negotiations to avoid another government shutdown after November 17.
|
 Kenneth J. Gruneisen started out as a licensed stockbroker in August 1987, a couple of months prior to the historic stock market crash that took the Dow Jones Industrial Average down -22.6% in a single day. He has published daily fact-based fundamental and technical analysis on high-ranked stocks online for two decades. Through FACTBASEDINVESTING.COM, Kenneth provides educational articles, news, market commentary, and other information regarding proven investment systems that work in good times and bad.
Comments contained in the body of this report are technical opinions only and are not necessarily those of Gruneisen Growth Corp. The material herein has been obtained from sources believed to be reliable and accurate, however, its accuracy and completeness cannot be guaranteed. Our firm, employees, and customers may effect transactions, including transactions contrary to any recommendation herein, or have positions in the securities mentioned herein or options with respect thereto. Any recommendation contained in this report may not be suitable for all investors and it is not to be deemed an offer or solicitation on our part with respect to the purchase or sale of any securities. |
|
 |
Commodity-Linked Groups Fell as Other Groups Rebounded
Kenneth J. Gruneisen - Passed the CAN SLIM® Master's Exam
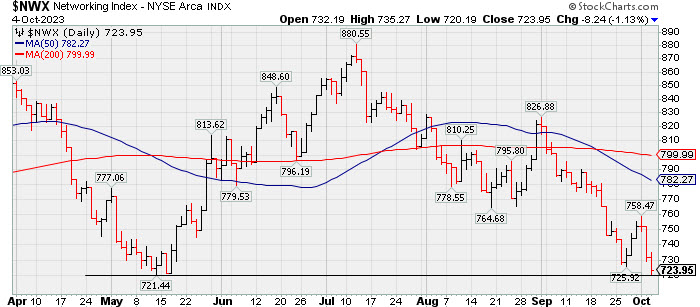
The Retail Index ($RLX +1.20%), Bank Index ($BKX +0.46%) and Broker/Dealer Index ($XBD +0.83%) each posted gains. The Semiconductor Index ($SOX +1.43%) and the Biotech Index ($BTK +0.61%) posted gains while the Networking Index ($NWX -1.13%) fell. Commodity-linked groups had a negative bias as the Oil Services Index ($OSX -4.49%) and the Integrated Oil Index ($XOI -3.64%) both were standout decliners while the Gold & Silver Index ($XAU -0.87%) suffered a smaller loss.
PICTURED: The Networking Index ($NWX -1.13%) ended lower for a 3rd consecutive session, slumping to a new 2023 low.
| Oil Services |
$OSX |
88.34 |
-4.15 |
-4.49% |
+5.34% |
| Integrated Oil |
$XOI |
1,813.45 |
-68.43 |
-3.64% |
+1.47% |
| Semiconductor |
$SOX |
3,424.92 |
+48.34 |
+1.43% |
+35.26% |
| Networking |
$NWX |
723.95 |
-8.24 |
-1.13% |
-7.58% |
| Broker/Dealer |
$XBD |
470.87 |
+3.89 |
+0.83% |
+4.84% |
| Retail |
$RLX |
3,326.64 |
+39.60 |
+1.20% |
+20.79% |
| Gold & Silver |
$XAU |
103.31 |
-0.90 |
-0.87% |
-14.52% |
| Bank |
$BKX |
75.13 |
+0.34 |
+0.46% |
-25.50% |
| Biotech |
$BTK |
4,948.03 |
+30.12 |
+0.61% |
-6.31% |
|
|
|
 |
Featured Stocks
Kenneth J. Gruneisen - Passed the CAN SLIM® Master's Exam
|
|
|
Color Codes Explained :
Y - Better candidates highlighted by our
staff of experts.
G - Previously featured
in past reports as yellow but may no longer be buyable under the
guidelines.
***Last / Change / Volume data in this table is the closing quote data***
|
|
|
THESE ARE NOT BUY RECOMMENDATIONS!
Comments contained in the body of this report are technical
opinions only. The material herein has been obtained
from sources believed to be reliable and accurate, however,
its accuracy and completeness cannot be guaranteed.
This site is not an investment advisor, hence it does
not endorse or recommend any securities or other investments.
Any recommendation contained in this report may not
be suitable for all investors and it is not to be deemed
an offer or solicitation on our part with respect to
the purchase or sale of any securities. All trademarks,
service marks and trade names appearing in this report
are the property of their respective owners, and are
likewise used for identification purposes only.
This report is a service available
only to active Paid Premium Members.
You may opt-out of receiving report notifications
at any time. Questions or comments may be submitted
by writing to Premium Membership Services 665 S.E. 10 Street, Suite 201 Deerfield Beach, FL 33441-5634 or by calling 1-800-965-8307
or 954-785-1121.
|
|
|