You are not logged in.
This means you
CAN ONLY VIEW reports that were published prior to Tuesday, April 22, 2025.
You
MUST UPGRADE YOUR MEMBERSHIP if you want to see any current reports.
AFTER MARKET UPDATE - TUESDAY, OCTOBER 3RD, 2023
Previous After Market Report Next After Market Report >>>
|
|
|
|
DOW |
-430.97 |
33,002.38 |
-1.29% |
|
Volume |
927,699,925 |
-6% |
|
Volume |
4,708,362,500 |
+2% |
|
NASDAQ |
-248.31 |
13,059.47 |
-1.87% |
|
Advancers |
456 |
16% |
|
Advancers |
916 |
21% |
|
S&P 500 |
-58.94 |
4,229.45 |
-1.37% |
|
Decliners |
2,403 |
84% |
|
Decliners |
3,401 |
79% |
|
Russell 2000 |
-29.66 |
1,727.15 |
-1.69% |
|
52 Wk Highs |
10 |
|
|
52 Wk Highs |
21 |
|
|
S&P 600 |
-19.80 |
1,116.45 |
-1.74% |
|
52 Wk Lows |
428 |
|
|
52 Wk Lows |
569 |
|
|
Damaging losses have signaled a more serious market correction (M criteria). During market corrections, disciplined investors know to reduce exposure and raise cash by selling any weakening stocks on a case-by-case basis.
|
 |
Indices Fall Again as Market Correction Brings More Damage
Kenneth J. Gruneisen - Passed the CAN SLIM® Master's Exam
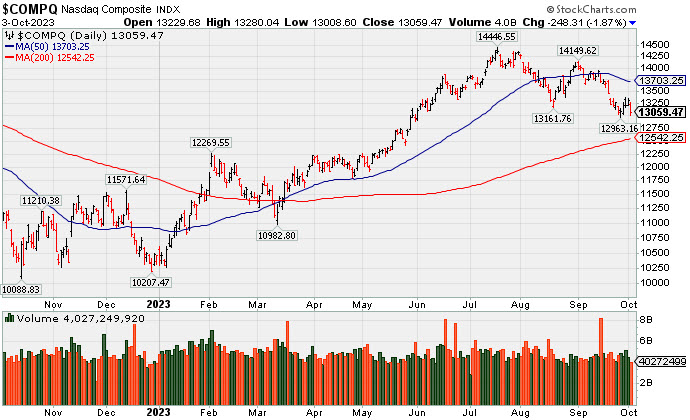
The major averages suffered more damaging losses on Tuesday. The volume totals were mixed, lighter than the prior session on the NYSE and higher on the Nasdaq exchange. Decliners led advancers by more than a 5-1 margin on the NYSE and by more than a 3-1 margin on the Nasdaq exchange. There were 3 high-ranked companies from the Leaders List that hit a new 52-week high and were listed on the BreakOuts Page, versus the total of 5 on the prior session. New 52-week lows totals expanded and solidly outnumbered new 52-week highs totals on the NYSE and on the Nasdaq exchange. The major indices are in a correction (M criteria). New buying efforts should be avoided until a new rally is confirmed by a solid follow-through day.
PICTURED: The Nasdaq Composite Index has been undercutting its August low and yet remains above its 200-day moving average (DMA) line.
Yields shot higher in response to the release of the August JOLTS - Job Openings data. which showed a sharp increase in job openings compared to July (to 9.610 mln from 8.920 mln). This reflected ongoing strength in the tight labor market. The 2-yr note yield settled four basis points higher at 5.14%. The 10-yr note yield settled at 4.80%, which was 12 basis points higher. The market was digesting news throughout the day regarding a motion to dismiss Kevin McCarthy (R-CA) as Speaker of the House.
The CBOE Volatility Index jumped 13.5% to 20.02. Broad based losses were paced by growth stocks and mega caps. Ten of the 11 S&P 500 sectors registered declines. The utilities sector (+1.2%) was alone in the green. The consumer discretionary sector (-2.6%) sported the largest decline followed by real estate (-1.9%), information technology (-1.8%), and financials (-1.7%).
|
 Kenneth J. Gruneisen started out as a licensed stockbroker in August 1987, a couple of months prior to the historic stock market crash that took the Dow Jones Industrial Average down -22.6% in a single day. He has published daily fact-based fundamental and technical analysis on high-ranked stocks online for two decades. Through FACTBASEDINVESTING.COM, Kenneth provides educational articles, news, market commentary, and other information regarding proven investment systems that work in good times and bad.
Comments contained in the body of this report are technical opinions only and are not necessarily those of Gruneisen Growth Corp. The material herein has been obtained from sources believed to be reliable and accurate, however, its accuracy and completeness cannot be guaranteed. Our firm, employees, and customers may effect transactions, including transactions contrary to any recommendation herein, or have positions in the securities mentioned herein or options with respect thereto. Any recommendation contained in this report may not be suitable for all investors and it is not to be deemed an offer or solicitation on our part with respect to the purchase or sale of any securities. |
|
 |
Retail, Financial, and Tech Indexes Fell
Kenneth J. Gruneisen - Passed the CAN SLIM® Master's Exam
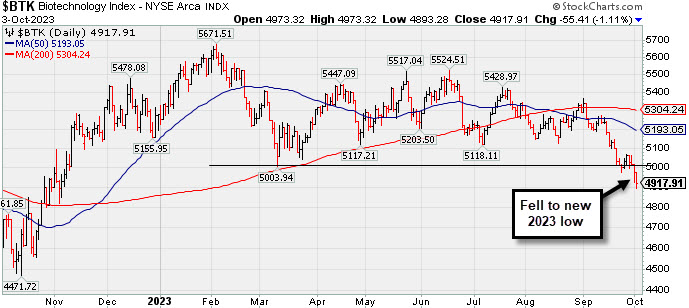
The Retail Index ($RLX -3.05%) outpaced the Bank Index ($BKX -2.13%) and Broker/Dealer Index ($XBD -2.46%) to the downside. The Semiconductor Index ($SOX -2.10%) and the Networking Index ($NWX -2.58%) both lost more than -2% while the Biotech Index ($BTK -1.11%) suffered a smaller loss. The Gold & Silver Index ($XAU +0.67%) and the Oil Services Index ($OSX +0.50%) were standout gainers as they edged higher while the Integrated Oil Index ($XOI -0.56%) lost ground.
PICTURED: The Biotech Index ($BTK -1.11%) ended lower for a 4th consecutive loss, slumping well below its 50-day and 200-day moving average (DMA) lines to a new 2023 low.
| Oil Services |
$OSX |
92.49 |
+0.46 |
+0.50% |
+10.29% |
| Integrated Oil |
$XOI |
1,881.88 |
-9.86 |
-0.52% |
+5.29% |
| Semiconductor |
$SOX |
3,376.58 |
-72.27 |
-2.10% |
+33.35% |
| Networking |
$NWX |
732.19 |
-19.41 |
-2.58% |
-6.53% |
| Broker/Dealer |
$XBD |
466.98 |
-11.80 |
-2.46% |
+3.97% |
| Retail |
$RLX |
3,287.04 |
-103.32 |
-3.05% |
+19.36% |
| Gold & Silver |
$XAU |
104.22 |
+0.69 |
+0.67% |
-13.77% |
| Bank |
$BKX |
74.79 |
-1.63 |
-2.13% |
-25.84% |
| Biotech |
$BTK |
4,917.91 |
-55.41 |
-1.11% |
-6.88% |
|
|
|
 |
Met Resistance at 50-Day Moving Average and Slumped
Kenneth J. Gruneisen - Passed the CAN SLIM® Master's Exam
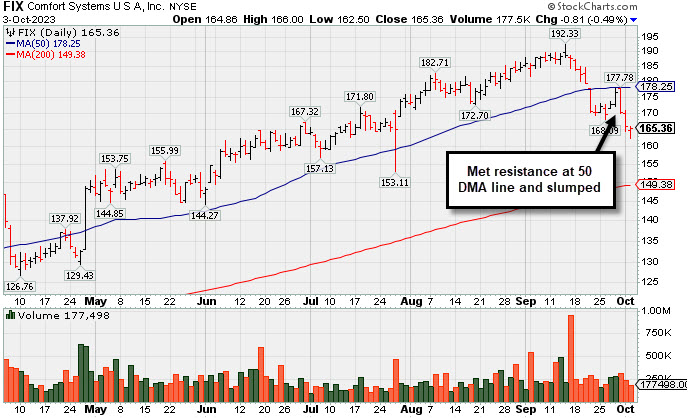
Comfort Systems U S A (FIX -$0.81 or -0.49% to $165.36) suffered a 3rd consecutive loss today, slumping after meeeting resistance near its 50-day moving average (DMA) line ($178.32). It will be dropped from the Featured Stocks list tonight. A rebound above the 50 DMA line is needed for its outlook to improve.
Fundamentals remain strong. Its annual earnings history (A criteria) has been strong and steady. It has a 98 Earnings Per Share Rating. It reported Jun '23 quarterly earnings +65% on +27% sales revenues versus the year-ago period. FIX was highlighted in yellow in the 2/23/23 mid-day report (read here) with a pivot point cited based on its 11/23/22 high plus 10 cents. It was last shown in greater detail on 9/21/23 with an annotated graph under the headline, "Violated 50-Day Moving Average With a Damaging Gap Down".
It hails from the Building - A/C & Heating Products group which is currently ranked 4th on the 197 Industry Groups list. It has a small supply of only 35.8 million shares outstanding (S criteria) which can contribute to greater price volatility in the event of institutional buying or selling. The number of top-rated funds that own its shares rose from 487 in Jun '22 to 659 in Jun '23, a reassuring sign regarding the I criteria. Its current Up/Down Volume Ratio of 0.8 is an unbiased indication its shares have been under distributional pressure over the past 50 days.
|
|
|
Color Codes Explained :
Y - Better candidates highlighted by our
staff of experts.
G - Previously featured
in past reports as yellow but may no longer be buyable under the
guidelines.
***Last / Change / Volume data in this table is the closing quote data***
Symbol/Exchange
Company Name
Industry Group |
PRICE |
CHANGE
(%Change) |
Day High |
Volume
(% DAV)
(% 50 day avg vol) |
52 Wk Hi
% From Hi |
Featured
Date |
Price
Featured |
Pivot Featured |
|
Max Buy |
 STRL
-
NASDAQ
STRL
-
NASDAQ
Sterling Infrastructure
Bldg-Heavy Construction
|
$70.89
|
-1.42
-1.96% |
$72.46
|
93,978
23.15% of 50 DAV
50 DAV is 406,000
|
$84.00
-15.61%
|
12/14/2022
|
$32.41
|
PP = $33.72
|
|
MB = $35.41
|
Most Recent Note - 9/27/2023 5:04:08 PM
G - Rebounded above its 50 DMA line ($72.39) with today's gain backed by higher (but still below-average) volume. Fundamentals remain strong. See the latest FSU analysis for more details and a new annotated graph.
>>> FEATURED STOCK ARTICLE : Found Support and Rebounded Above 50-Day Moving Average - 9/27/2023 |
View all notes |
Set NEW NOTE alert |
Company Profile |
SEC
News |
Chart |
Request a new note
C
A
S
I |
FIX
-
NYSE
Comfort Systems USA
Bldg-A/C and Heating Prds
|
$163.40
|
-2.78
-1.67% |
$166.00
|
56,912
22.32% of 50 DAV
50 DAV is 255,000
|
$192.33
-15.04%
|
4/27/2023
|
$148.85
|
PP = $152.23
|
|
MB = $159.84
|
Most Recent Note - 10/2/2023 5:26:29 PM
G - Suffered a 2nd consecutive loss today, slumping after meeeting resistance near its 50 DMA line ($178). A rebound above the 50 DMA line is still needed for its outlook to improve. Fundamentals remain strong.
>>> FEATURED STOCK ARTICLE : Violated 50-Day Moving Average With a Damaging Gap Down - 9/21/2023 |
View all notes |
Set NEW NOTE alert |
Company Profile |
SEC
News |
Chart |
Request a new note
C
A
S
I |
ANET
-
NYSE
Arista Networks
Computer-Networking
|
$183.88
|
-3.93
-2.09% |
$188.32
|
501,096
19.35% of 50 DAV
50 DAV is 2,590,000
|
$198.70
-7.46%
|
8/1/2023
|
$188.84
|
PP = $178.46
|
|
MB = $187.38
|
Most Recent Note - 10/2/2023 5:27:43 PM
G - Posted a gain today with light volume. Quietly consolidating above its 50 DMA line ($182). Fundamentals remain strong.
>>> FEATURED STOCK ARTICLE : Arista Consolidates Above 50-Day Moving Average Line - 9/29/2023 |
View all notes |
Set NEW NOTE alert |
Company Profile |
SEC
News |
Chart |
Request a new note
C
A
S
I |
MEDP
-
NASDAQ
Medpace Holdings
Medical-Research Eqp/Svc
|
$238.90
|
-3.66
-1.51% |
$246.73
|
55,886
19.47% of 50 DAV
50 DAV is 287,000
|
$282.73
-15.50%
|
7/25/2023
|
$196.32
|
PP = $241.57
|
|
MB = $253.65
|
Most Recent Note - 9/27/2023 5:06:39 PM
G - Holding its ground for the past week after violating its 50 DMA line ($259.53) with volume-driven losses. A rebound above the 50 DMA line is needed for its outlook to improve. Fundamentals remain strong.
>>> FEATURED STOCK ARTICLE : Damaging Streak of Losses Violated 50-Day Moving Average Line - 9/22/2023 |
View all notes |
Set NEW NOTE alert |
Company Profile |
SEC
News |
Chart |
Request a new note
C
A
S
I |
COKE
-
NASDAQ
Coca-Cola Consolidated
Beverages-Non-Alcoholic
|
$627.81
|
-8.59
-1.35% |
$636.20
|
3,859
10.16% of 50 DAV
50 DAV is 38,000
|
$745.53
-15.79%
|
8/3/2023
|
$718.56
|
PP = $694.30
|
|
MB = $729.02
|
Most Recent Note - 9/28/2023 5:15:52 PM
G - Posted a gain today with light volume. A rebound above the 50 DMA line ($673) is still needed to help its outlook improve.
>>> FEATURED STOCK ARTICLE : Lingering Below 50 DMA Line and Perched -12.3% Off High - 9/25/2023 |
View all notes |
Set NEW NOTE alert |
Company Profile |
SEC
News |
Chart |
Request a new note
C
A
S
I |
Symbol/Exchange
Company Name
Industry Group |
PRICE |
CHANGE
(%Change) |
Day High |
Volume
(% DAV)
(% 50 day avg vol) |
52 Wk Hi
% From Hi |
Featured
Date |
Price
Featured |
Pivot Featured |
|
Max Buy |
PLUS
-
NASDAQ
ePlus
Computer-Tech Services
|
$64.23
|
-0.41
-0.64% |
$64.97
|
10,066
8.99% of 50 DAV
50 DAV is 112,000
|
$75.90
-15.38%
|
8/8/2023
|
$67.60
|
PP = $62.92
|
|
MB = $66.07
|
Most Recent Note - 10/2/2023 5:28:51 PM
Y - Posted a gain today with above-average volume. Recently found support near its 50 DMA line ($63). More damaging losses may trigger a technical sell signal.
>>> FEATURED STOCK ARTICLE : Orderly Consolidation Continues for ePlus - 9/28/2023 |
View all notes |
Set NEW NOTE alert |
Company Profile |
SEC
News |
Chart |
Request a new note
C
A
S
I |
|
|
|
THESE ARE NOT BUY RECOMMENDATIONS!
Comments contained in the body of this report are technical
opinions only. The material herein has been obtained
from sources believed to be reliable and accurate, however,
its accuracy and completeness cannot be guaranteed.
This site is not an investment advisor, hence it does
not endorse or recommend any securities or other investments.
Any recommendation contained in this report may not
be suitable for all investors and it is not to be deemed
an offer or solicitation on our part with respect to
the purchase or sale of any securities. All trademarks,
service marks and trade names appearing in this report
are the property of their respective owners, and are
likewise used for identification purposes only.
This report is a service available
only to active Paid Premium Members.
You may opt-out of receiving report notifications
at any time. Questions or comments may be submitted
by writing to Premium Membership Services 665 S.E. 10 Street, Suite 201 Deerfield Beach, FL 33441-5634 or by calling 1-800-965-8307
or 954-785-1121.
|
|
|