You are not logged in.
This means you
CAN ONLY VIEW reports that were published prior to Tuesday, April 8, 2025.
You
MUST UPGRADE YOUR MEMBERSHIP if you want to see any current reports.
AFTER MARKET UPDATE - TUESDAY, OCTOBER 4TH, 2022
Previous After Market Report Next After Market Report >>>
|
|
|
|
DOW |
+825.43 |
30,316.32 |
+2.80% |
|
Volume |
1,090,651,195 |
+0% |
|
Volume |
4,951,096,200 |
+13% |
|
NASDAQ |
+360.97 |
11,176.41 |
+3.34% |
|
Advancers |
2,687 |
87% |
|
Advancers |
3,328 |
75% |
|
S&P 500 |
+112.50 |
3,790.93 |
+3.06% |
|
Decliners |
409 |
13% |
|
Decliners |
1,110 |
25% |
|
Russell 2000 |
+66.90 |
1,775.77 |
+3.91% |
|
52 Wk Highs |
30 |
|
|
52 Wk Highs |
66 |
|
|
S&P 600 |
+41.59 |
1,134.66 |
+3.80% |
|
52 Wk Lows |
78 |
|
|
52 Wk Lows |
161 |
|
|
The market (M criteria) is still in a correction. Disciplined investors know to protect cash by avoiding any new buys until a new uptrend is confirmed with a proper follow-through day.
|
 |
Indices Post Big Gains Marking Day 2 of New Rally Attempt
Kenneth J. Gruneisen - Passed the CAN SLIM® Master's Exam
The Dow added 825 points, while the Nasdaq Composite advanced 3.3%. The S&P 500 climbed 3.1% to notch its best two-day rally since March 2020. The volume totals reported were higher than the prior session on the NYSE and on the Nasdaq exchange, indicating an increase in institutional buying demand. Breadth was solidly positive as advancers led decliners by more than a 6-1 margin on the NYSE and more than 3-1 on the Nasdaq exchange. There were 13 high-ranked companies from the Leaders List that hit new 52-week highs and were listed on the BreakOuts Page, up from 3 on the prior session. New 52-week lows totals contracted yet still outnumbered improving new 52-week highs totals on both the NYSE and the Nasdaq exchange. The major indices have enjoyed 2 consecutive days of big gains but the market is still in a correction (M criteria). Caution and patience remain paramount because some of the biggest up days occur during ongoing corrections. Disciplined investors know to watch for a follow-through day of big gains to confirm a new uptrend, ideally on Day 4-7 of a new rally.
Chart courtesy of www.stockcharts.com%20on%20Tuesday.%20Yesterday,%20the%20broad%20benchmark%20eclipsed%20the%204,300%20level%20for%20the%20first%20time%20since%20late%20April.%20The%20Nasdaq%20Composite%20fell%201.3%%20amid%20weakness%20in%20mega-cap%20tech%20shares.%20The%20volume%20totals%20reported%20were%20mixed,%20lighter%20than%20the%20prior%20session%20on%20the%20NYSE%20and%20higher%20on%20the%20Nasdaq%20exchange.%20Decliners%20led%20advancers%20by%20a%204-1%20margin%20on%20the%20NYSE%20ad%20by%20a%203-1%20margin%20on%20the%20Nasdaq%20exchange.%20There%20were%2017%20high-ranked%20companies%20from%20the%20Leaders%20List%20that%20hit%20new%2052-week%20highs%20and%20were%20listed%20on%20the%20BreakOuts%20Page,%20down%20from%20the%20total%20of%2045%20on%20the%20prior%20session.%20New%2052-week%20highs%20outnumbered%20new%2052-week%20lows%20on%20the%20NYSE,%20but%20new%20lows%20outnumbered%20new%20highs%20on%20the%20Nasdaq%20exchange.%20The%20market%20is%20in%20a%20confirmed%20uptrend%20(M%20criteria).%20Any%20sustainable%20rally%20requires%20a%20healthy%20crop%20of%20leading%20stocks%20hitting%20new%20highs,%20so%20the%20recent%20improvement%20in%20leadership%20was%20a%20reassuring%20sign.) 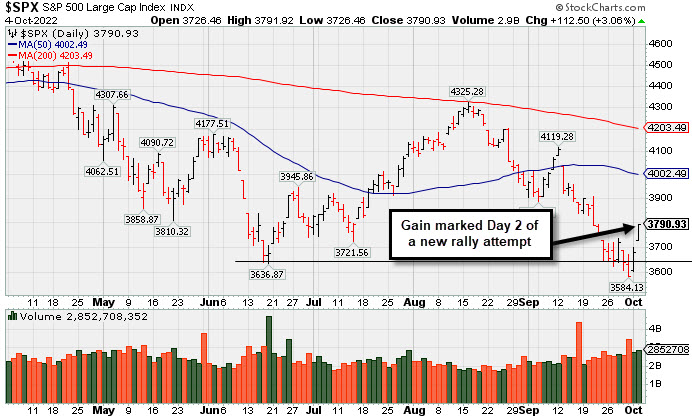 PICTURED: The S&P 500 Index posted another big gain marking Day 2 of a new rally attempt.
All U.S. equities finished higher Tuesday as investors digested fresh economic data. All sectors in the S&P 500 ended in positive territory, with Energy pacing gains.
Treasuries were mixed, with the yield on the benchmark 10-year note down two basis points (0.02%) to 3.63%, while the yield on the 30-year bond added one basis point (0.01%) to 3.70%. The yield on the two-year note shed one basis point (0.01%) to 4.11%. In commodities, West Texas Intermediate (WTI) crude jumped 3.2% to $86.27/barrel ahead of tomorrow’s Organization of Petroleum Exporting Countries and their allies (OPEC+) meeting. A gauge of the U.S. dollar declined 1.4%, further buoying oil prices.
On the data front, August factory orders saw no change from July’s print. A final reading for August’s durable goods orders was unchanged, while capital goods orders were upwardly revised to 1.4%. Meanwhile, the Bureau of Labor Statistic’s Job Openings and Labor Turnover Survey (JOLTS) showed the amount of job openings in August fell more than expected, dropping by over one million from July’s print and notching a 14-month low. The figure is an early indicator that the domestic labor gap is starting to close, which could lead to the Federal Reserve (Fed) easing off its aggressive monetary policy stance sooner than anticipated.. |
 Kenneth J. Gruneisen started out as a licensed stockbroker in August 1987, a couple of months prior to the historic stock market crash that took the Dow Jones Industrial Average down -22.6% in a single day. He has published daily fact-based fundamental and technical analysis on high-ranked stocks online for two decades. Through FACTBASEDINVESTING.COM, Kenneth provides educational articles, news, market commentary, and other information regarding proven investment systems that work in good times and bad.
Comments contained in the body of this report are technical opinions only and are not necessarily those of Gruneisen Growth Corp. The material herein has been obtained from sources believed to be reliable and accurate, however, its accuracy and completeness cannot be guaranteed. Our firm, employees, and customers may effect transactions, including transactions contrary to any recommendation herein, or have positions in the securities mentioned herein or options with respect thereto. Any recommendation contained in this report may not be suitable for all investors and it is not to be deemed an offer or solicitation on our part with respect to the purchase or sale of any securities. |
|
 |
Big Gains for Financial, Retail, Tech, and Commodity-Linked Groups
Kenneth J. Gruneisen - Passed the CAN SLIM® Master's Exam
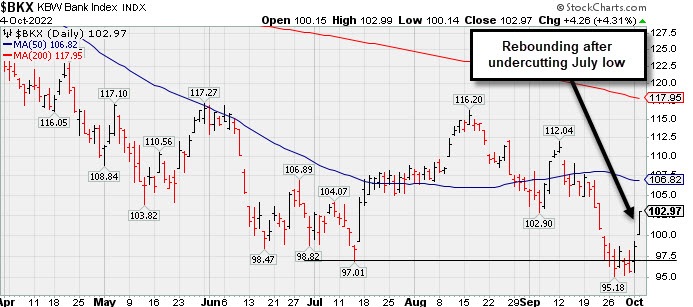
The Oil Services Index ($OSX +4.16%) and Integrated Oil Index ($XOI +4.56%) both posted solid gains and the Gold & Silver Index ($XAU +2.74%) also notched a big gain. The Semiconductor Index ($SOX +4.46%) and Networking Index ($NWX +5.37%) led the tech sector with big gains while the Biotech Index ($BTK +2.96%) followed. The Broker/Dealer Index ($XBD +4.57%), Bank Index ($BKX +4.31%), and Retail Index ($RLX +3.39%) rounded out the solidly bullish session with each posting a gain of greater than +3%.
PICTURED: The Bank Index ($BKX +4.31%) posted a solid gain, rebounding toward its 50-day moving average (DMA) line after undercutting the July low.
| Oil Services |
$OSX |
66.53 |
+2.66 |
+4.16% |
+26.19% |
| Integrated Oil |
$XOI |
1,666.11 |
+72.71 |
+4.56% |
+41.41% |
| Semiconductor |
$SOX |
2,500.11 |
+106.80 |
+4.46% |
-36.64% |
| Networking |
$NWX |
786.21 |
+40.09 |
+5.37% |
-19.04% |
| Broker/Dealer |
$XBD |
442.54 |
+19.34 |
+4.57% |
-9.10% |
| Retail |
$RLX |
3,148.12 |
+103.29 |
+3.39% |
-25.51% |
| Gold & Silver |
$XAU |
108.90 |
+2.90 |
+2.74% |
-17.78% |
| Bank |
$BKX |
102.97 |
+4.26 |
+4.31% |
-22.12% |
| Biotech |
$BTK |
4,739.16 |
+136.09 |
+2.96% |
-14.12% |
|
|
|
 |
No Resistance Remains Due to Overhead Supply
Kenneth J. Gruneisen - Passed the CAN SLIM® Master's Exam
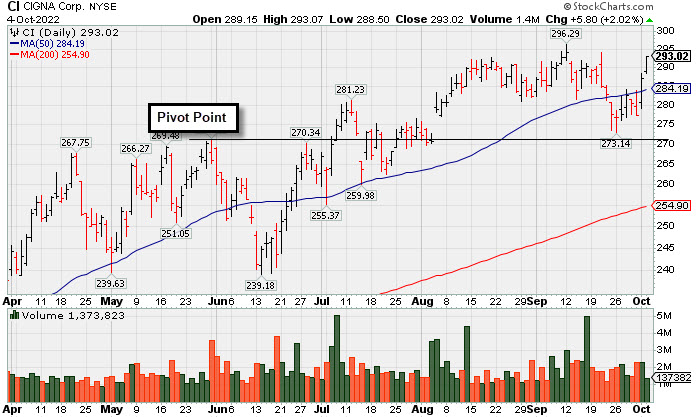
Cigna Corp (CI +$5.80 or +2.02% to $293.02) posted a 2nd consecutive big gain as it rebounded to close only -1.1% off its all-time high. No overhead supply remains to hinder its progress. On pullbacks the 50-day moving average (DMA) line defines near-term support to watch above the recent low ($273.14 on 9/26/22).
CI has a 94 Earnings Per Share Rating. However, earnings for the Jun '22 quarter rose +19% on +5% sales revenues versus the year ago period, breaking a streak of 3 quarterly earnings increases above the +25% minimum guideline (C criteria), raising fundamental concerns. Annual earnings growth (A criteria) has been strong. Its next earnings report is still a month away. The Medical - Managed Care group is currently ranked 31st on the 197 Industry Groups list and has a Group Relative Strength Rating of 84 (A-), a reassuring sign concerning the L criteria.
Cigna was highlighted in yellow with new pivot point based on its 5/31/22 high plus 10 cents in the 7/07/22 mid-day report (read here). It showed resilience after undercutting the 50 DMA line since 9/16/22 when last shown in this FSU section with an annotated graph under the headline, "Found Support Above 50-Day Moving Average Line This Week". The number of top-rated funds owning its shares rose from 2,628 in Dec '21 to 2,848 in Jun '22, a reassuring sign concerning the I criteria. Its current Up/Down Volume Ratio of 1.3 is an unbiased indication its shares have been under accumulation over the past 50 days.
|
|
|
Color Codes Explained :
Y - Better candidates highlighted by our
staff of experts.
G - Previously featured
in past reports as yellow but may no longer be buyable under the
guidelines.
***Last / Change / Volume data in this table is the closing quote data***
Symbol/Exchange
Company Name
Industry Group |
PRICE |
CHANGE
(%Change) |
Day High |
Volume
(% DAV)
(% 50 day avg vol) |
52 Wk Hi
% From Hi |
Featured
Date |
Price
Featured |
Pivot Featured |
|
Max Buy |
 CI
-
NYSE
CI
-
NYSE
Cigna Corp
Medical-Managed Care
|
$293.02
|
+5.80
2.02% |
$293.07
|
1,373,174
70.93% of 50 DAV
50 DAV is 1,936,000
|
$296.29
-1.10%
|
7/7/2022
|
$276.55
|
PP = $273.68
|
|
MB = $287.36
|
 Most Recent Note - 10/4/2022 5:12:52 PM
G - Closed 1.1% off its all-time high with today's 2nd big gain as it rebounded above its 50 DMA line ($284.83). Fundamental concerns remain after the Jun '22 quarter rose +19% on +5% sales revenues versus the year ago period, breaking a streak of 3 quarterly earnings increases above the +25% minimum guideline (C criteria). See the latest FSU analysis for more details and a new annotated graph.
>>> FEATURED STOCK ARTICLE : No Resistance Remains Due to Overhead Supply - 10/4/2022 |
View all notes |
Set NEW NOTE alert |
Company Profile |
SEC
News |
Chart |
Request a new note
C
A
S
I |
ESQ
-
NASDAQ
Esquire Financial Hldgs
Finance-Commercial Loans
|
$38.31
|
+0.17
0.45% |
$39.00
|
21,383
79.20% of 50 DAV
50 DAV is 27,000
|
$41.68
-8.09%
|
7/26/2022
|
$37.74
|
PP = $39.19
|
|
MB = $41.15
|
Most Recent Note - 10/4/2022 5:19:45 PM
Y - Color code is changed to yellow after it posted a 3rd consecutive gain today with lighter volume as it wedged above its 50 DMA line ($38.13). Recent slump below the pivot point raised concerns. Faces some near-term resistance due to overhead supply up to the $41 level. The market is in a correction (M criteria) and disciplined investors know to avoid new buying efforts until a new rally confirmed with a follow-through day.
>>> FEATURED STOCK ARTICLE : Thinly-Traded Esquire Still Perched Near High - 9/20/2022 |
View all notes |
Set NEW NOTE alert |
Company Profile |
SEC
News |
Chart |
Request a new note
C
A
S
I |
ENPH
-
NASDAQ
Enphase Energy Inc
Energy-Solar
|
$288.25
|
+1.64
0.57% |
$297.71
|
3,623,996
96.95% of 50 DAV
50 DAV is 3,738,000
|
$324.84
-11.26%
|
7/28/2022
|
$276.66
|
PP = $282.55
|
|
MB = $296.68
|
Most Recent Note - 10/4/2022 5:17:45 PM
G - Erased much of its big early gain today and slumped to close below its 50 DMA line ($291.25). The prior low ($270.57 on 9/23/22) defines the next important near-term support to watch. More damaging losses would raise greater concerns. Fundamentals remain strong. The market is in a correction (M criteria) and disciplined investors know to avoid new buying efforts until a new rally confirmed with a follow-through day.
>>> FEATURED STOCK ARTICLE : Found Support After Undercutting 50 DMA and Prior Low - 9/27/2022 |
View all notes |
Set NEW NOTE alert |
Company Profile |
SEC
News |
Chart |
Request a new note
C
A
S
I |
CCRN
-
NASDAQ
Cross Country Healthcare
DIVERSIFIED SERVICES - Staffing and Outsourcing Service
|
$33.59
|
+1.78
5.60% |
$34.98
|
1,546,010
177.50% of 50 DAV
50 DAV is 871,000
|
$32.20
4.32%
|
9/9/2022
|
$27.32
|
PP = $30.61
|
|
MB = $32.14
|
Most Recent Note - 10/4/2022 12:12:26 PM
G - Hitting another new 52-week high today and its color code is changed to green after rising above its "max buy" level. Rallied above its pivot point with a big gain on the prior session backed by +48% above average volume triggering a technical buy signal. Its 50 DMA line ($26.24) defines important near-term support where a violation would raise concerns and trigger a technical sell signal. The market is in a correction (M criteria) and disciplined investors know to avoid new buying efforts until a new rally confirmed with a follow-through day.
>>> FEATURED STOCK ARTICLE : Powerful Breakout While Market Rally Still Needs Confirmation - 10/3/2022 |
View all notes |
Set NEW NOTE alert |
Company Profile |
SEC
News |
Chart |
Request a new note
C
A
S
I |
|
|
|
THESE ARE NOT BUY RECOMMENDATIONS!
Comments contained in the body of this report are technical
opinions only. The material herein has been obtained
from sources believed to be reliable and accurate, however,
its accuracy and completeness cannot be guaranteed.
This site is not an investment advisor, hence it does
not endorse or recommend any securities or other investments.
Any recommendation contained in this report may not
be suitable for all investors and it is not to be deemed
an offer or solicitation on our part with respect to
the purchase or sale of any securities. All trademarks,
service marks and trade names appearing in this report
are the property of their respective owners, and are
likewise used for identification purposes only.
This report is a service available
only to active Paid Premium Members.
You may opt-out of receiving report notifications
at any time. Questions or comments may be submitted
by writing to Premium Membership Services 665 S.E. 10 Street, Suite 201 Deerfield Beach, FL 33441-5634 or by calling 1-800-965-8307
or 954-785-1121.
|
|
|