You are not logged in.
This means you
CAN ONLY VIEW reports that were published prior to Tuesday, April 8, 2025.
You
MUST UPGRADE YOUR MEMBERSHIP if you want to see any current reports.
AFTER MARKET UPDATE - WEDNESDAY, OCTOBER 5TH, 2022
Previous After Market Report Next After Market Report >>>
|
|
|
|
DOW |
-42.45 |
30,273.87 |
-0.14% |
|
Volume |
929,067,807 |
-15% |
|
Volume |
4,085,201,400 |
-17% |
|
NASDAQ |
-27.77 |
11,148.64 |
-0.25% |
|
Advancers |
939 |
31% |
|
Advancers |
1,583 |
36% |
|
S&P 500 |
-7.65 |
3,783.28 |
-0.20% |
|
Decliners |
2,132 |
69% |
|
Decliners |
2,835 |
64% |
|
Russell 2000 |
-13.07 |
1,762.69 |
-0.74% |
|
52 Wk Highs |
32 |
|
|
52 Wk Highs |
59 |
|
|
S&P 600 |
-7.20 |
1,127.46 |
-0.63% |
|
52 Wk Lows |
122 |
|
|
52 Wk Lows |
201 |
|
|
The market (M criteria) is still in a correction. Disciplined investors know to protect cash by avoiding any new buys until a new uptrend is confirmed with a proper follow-through day.
|
 |
Indices Pulled Back With Lighter Volume on Day 3 of Rally Attempt
Kenneth J. Gruneisen - Passed the CAN SLIM® Master's Exam
The Dow lost 42 points, while the Nasdaq Composite shed 0.3%. The S&P 500 slipped 0.2%. The volume totals reported were lighter than the prior session on the NYSE and on the Nasdaq exchange. Breadth was negative as decliners led advancers by more than a 2-1 margin on the NYSE and nearly 2-1 on the Nasdaq exchange. There were 9 high-ranked companies from the Leaders List that hit new 52-week highs and were listed on the BreakOuts Page, down from 13 on the prior session. New 52-week lows totals outnumbered new 52-week highs totals on both the NYSE and the Nasdaq exchange. The major indices paused after enjoying 2 consecutive days of big gains, and the market is still in a correction (M criteria). Caution and patience remain paramount because some of the biggest up days occur during ongoing corrections. Disciplined investors know to watch for a follow-through day of big gains to confirm a new uptrend on Day 4-7 of a new rally.
Chart courtesy of www.stockcharts.com%20on%20Tuesday.%20Yesterday,%20the%20broad%20benchmark%20eclipsed%20the%204,300%20level%20for%20the%20first%20time%20since%20late%20April.%20The%20Nasdaq%20Composite%20fell%201.3%%20amid%20weakness%20in%20mega-cap%20tech%20shares.%20The%20volume%20totals%20reported%20were%20mixed,%20lighter%20than%20the%20prior%20session%20on%20the%20NYSE%20and%20higher%20on%20the%20Nasdaq%20exchange.%20Decliners%20led%20advancers%20by%20a%204-1%20margin%20on%20the%20NYSE%20ad%20by%20a%203-1%20margin%20on%20the%20Nasdaq%20exchange.%20There%20were%2017%20high-ranked%20companies%20from%20the%20Leaders%20List%20that%20hit%20new%2052-week%20highs%20and%20were%20listed%20on%20the%20BreakOuts%20Page,%20down%20from%20the%20total%20of%2045%20on%20the%20prior%20session.%20New%2052-week%20highs%20outnumbered%20new%2052-week%20lows%20on%20the%20NYSE,%20but%20new%20lows%20outnumbered%20new%20highs%20on%20the%20Nasdaq%20exchange.%20The%20market%20is%20in%20a%20confirmed%20uptrend%20(M%20criteria).%20Any%20sustainable%20rally%20requires%20a%20healthy%20crop%20of%20leading%20stocks%20hitting%20new%20highs,%20so%20the%20recent%20improvement%20in%20leadership%20was%20a%20reassuring%20sign.) 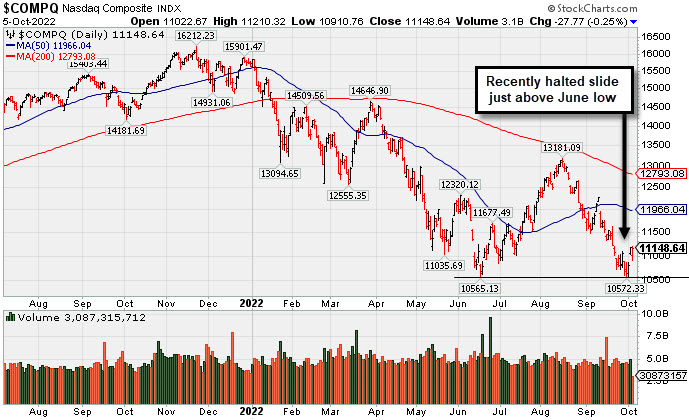 PICTURED: The Nasdaq Composite Index pulled back on Day 3 of the new rally attempt. It halted its slide just above the June low.
U.S. equities finished lower Wednesday after struggling for direction in afternoon trading. Treasury yields climbed as uncertainty over the future course of Federal Reserve (Fed) monetary policy grew. The benchmark 10-year note added 11 basis points (0.11%) to 3.74%, while the 30-year bond yield added five basis points (0.05%) to 3.75%. The more Fed-sensitive two-year note increased three basis points (0.03%) to 4.14%. A gauge of the U.S. dollar added 1% against a basket of currencies.
In commodities, West Texas Intermediate (WTI) crude jumped 1.6% to $87.89/barrel following the Organization of Petroleum Exporting Countries and their allies (OPEC+) meeting as concerns over tight supply outweighed recessionary worries and a stronger U.S. dollar. OPEC+ has announced they will cut production by two million barrels per day, its largest cut since 2020, despite pressure from the U.S. to continue pumping oil to alleviate supply strains.
On the data front, the ADP Employment Change survey showed the U.S. added 208,000 jobs in September, which implies demand for labor is strong despite a darkening economic outlook. Meanwhile, the U.S. trade balance narrowed for the fifth-straight month in August. Meanwhile, the final September readings for the S&P Global U.S. Services Purchasing Managers’ Index (PMI) and Composite PMI were both upwardly revised. The Institute of Supply Management’s (ISM) Services Index came in at a better-than-anticipated 56.7 in September.
|
 Kenneth J. Gruneisen started out as a licensed stockbroker in August 1987, a couple of months prior to the historic stock market crash that took the Dow Jones Industrial Average down -22.6% in a single day. He has published daily fact-based fundamental and technical analysis on high-ranked stocks online for two decades. Through FACTBASEDINVESTING.COM, Kenneth provides educational articles, news, market commentary, and other information regarding proven investment systems that work in good times and bad.
Comments contained in the body of this report are technical opinions only and are not necessarily those of Gruneisen Growth Corp. The material herein has been obtained from sources believed to be reliable and accurate, however, its accuracy and completeness cannot be guaranteed. Our firm, employees, and customers may effect transactions, including transactions contrary to any recommendation herein, or have positions in the securities mentioned herein or options with respect thereto. Any recommendation contained in this report may not be suitable for all investors and it is not to be deemed an offer or solicitation on our part with respect to the purchase or sale of any securities. |
|
 |
Commodity-Linked Groups and Tech Sector Posted Gains
Kenneth J. Gruneisen - Passed the CAN SLIM® Master's Exam
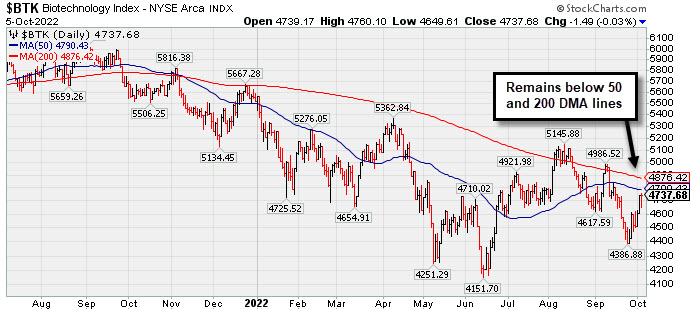
The Bank Index ($BKX -1.20%) created a drag on the major averages while the Broker/Dealer Index ($XBD -0.07%) and Retail Index ($RLX +0.07%) both were little changed. Commodity-linked groups had a positive bias as the Oil Services Index ($OSX +3.70%), Integrated Oil Index ($XOI +1.19%), and Gold & Silver Index ($XAU -1.48%) each posted gains. The Semiconductor Index ($SOX +0.94%) and Networking Index ($NWX +0.98%) both notched gains while the Biotech Index ($BTK -0.03%) finished flat.
PICTURED: The Biotech Index ($BTK -0.03%) remains below its 50-day and 200-day moving average (DMA) lines.
| Oil Services |
$OSX |
68.99 |
+2.46 |
+3.70% |
+30.86% |
| Integrated Oil |
$XOI |
1,685.87 |
+19.76 |
+1.19% |
+43.09% |
| Semiconductor |
$SOX |
2,523.61 |
+23.50 |
+0.94% |
-36.05% |
| Networking |
$NWX |
793.93 |
+7.72 |
+0.98% |
-18.24% |
| Broker/Dealer |
$XBD |
442.23 |
-0.32 |
-0.07% |
-9.17% |
| Retail |
$RLX |
3,150.33 |
+2.21 |
+0.07% |
-25.46% |
| Gold & Silver |
$XAU |
107.28 |
-1.61 |
-1.48% |
-19.00% |
| Bank |
$BKX |
101.74 |
-1.23 |
-1.20% |
-23.05% |
| Biotech |
$BTK |
4,737.68 |
-1.49 |
-0.03% |
-14.15% |
|
|
|
 |
Featured Stocks
Kenneth J. Gruneisen - Passed the CAN SLIM® Master's Exam
|
|
|
Color Codes Explained :
Y - Better candidates highlighted by our
staff of experts.
G - Previously featured
in past reports as yellow but may no longer be buyable under the
guidelines.
***Last / Change / Volume data in this table is the closing quote data***
Symbol/Exchange
Company Name
Industry Group |
PRICE |
CHANGE
(%Change) |
Day High |
Volume
(% DAV)
(% 50 day avg vol) |
52 Wk Hi
% From Hi |
Featured
Date |
Price
Featured |
Pivot Featured |
|
Max Buy |
 CI
-
NYSE
CI
-
NYSE
Cigna Corp
Medical-Managed Care
|
$294.03
|
+1.01
0.34% |
$295.16
|
1,220,401
62.71% of 50 DAV
50 DAV is 1,946,000
|
$296.29
-0.76%
|
7/7/2022
|
$276.55
|
PP = $273.68
|
|
MB = $287.36
|
Most Recent Note - 10/4/2022 5:12:52 PM
G - Closed 1.1% off its all-time high with today's 2nd big gain as it rebounded above its 50 DMA line ($284.83). Fundamental concerns remain after the Jun '22 quarter rose +19% on +5% sales revenues versus the year ago period, breaking a streak of 3 quarterly earnings increases above the +25% minimum guideline (C criteria). See the latest FSU analysis for more details and a new annotated graph.
>>> FEATURED STOCK ARTICLE : No Resistance Remains Due to Overhead Supply - 10/4/2022 |
View all notes |
Set NEW NOTE alert |
Company Profile |
SEC
News |
Chart |
Request a new note
C
A
S
I |
ESQ
-
NASDAQ
Esquire Financial Hldgs
Finance-Commercial Loans
|
$37.57
|
-0.74
-1.93% |
$38.32
|
10,959
40.59% of 50 DAV
50 DAV is 27,000
|
$41.68
-9.86%
|
7/26/2022
|
$37.74
|
PP = $39.19
|
|
MB = $41.15
|
Most Recent Note - 10/4/2022 5:19:45 PM
Y - Color code is changed to yellow after it posted a 3rd consecutive gain today with lighter volume as it wedged above its 50 DMA line ($38.13). Recent slump below the pivot point raised concerns. Faces some near-term resistance due to overhead supply up to the $41 level. The market is in a correction (M criteria) and disciplined investors know to avoid new buying efforts until a new rally confirmed with a follow-through day.
>>> FEATURED STOCK ARTICLE : Thinly-Traded Esquire Still Perched Near High - 9/20/2022 |
View all notes |
Set NEW NOTE alert |
Company Profile |
SEC
News |
Chart |
Request a new note
C
A
S
I |
ENPH
-
NASDAQ
Enphase Energy Inc
Energy-Solar
|
$261.60
|
-26.65
-9.25% |
$285.38
|
12,135,596
323.10% of 50 DAV
50 DAV is 3,756,000
|
$324.84
-19.47%
|
7/28/2022
|
$276.66
|
PP = $282.55
|
|
MB = $296.68
|
 Most Recent Note - 10/5/2022 6:20:56 PM
Suffered a damaging volume-driven loss slumping well below its 50 DMA line and violating the prior low ($270.57 on 9/23/22) raising greater concerns and triggering a technical sell signal. It will be dropped from the Featured Stocks list tonight.
>>> FEATURED STOCK ARTICLE : Found Support After Undercutting 50 DMA and Prior Low - 9/27/2022 |
View all notes |
Set NEW NOTE alert |
Company Profile |
SEC
News |
Chart |
Request a new note
C
A
S
I |
CCRN
-
NASDAQ
Cross Country Healthcare
DIVERSIFIED SERVICES - Staffing and Outsourcing Service
|
$31.56
|
-2.03
-6.04% |
$32.16
|
1,362,791
154.34% of 50 DAV
50 DAV is 883,000
|
$34.98
-9.78%
|
9/9/2022
|
$27.32
|
PP = $30.61
|
|
MB = $32.14
|
Most Recent Note - 10/5/2022 12:17:52 PM
Y - Color code is changed to yellow while pulling back below its "max buy" level. Rallied above its pivot point with big volume-driven gains triggering a technical buy signal. Its 50 DMA line ($26.32) defines important near-term support where a violation would raise concerns and trigger a technical sell signal. The market is in a correction (M criteria) and disciplined investors know to avoid new buying efforts until a new rally confirmed with a follow-through day.
>>> FEATURED STOCK ARTICLE : Powerful Breakout While Market Rally Still Needs Confirmation - 10/3/2022 |
View all notes |
Set NEW NOTE alert |
Company Profile |
SEC
News |
Chart |
Request a new note
C
A
S
I |
|
|
|
THESE ARE NOT BUY RECOMMENDATIONS!
Comments contained in the body of this report are technical
opinions only. The material herein has been obtained
from sources believed to be reliable and accurate, however,
its accuracy and completeness cannot be guaranteed.
This site is not an investment advisor, hence it does
not endorse or recommend any securities or other investments.
Any recommendation contained in this report may not
be suitable for all investors and it is not to be deemed
an offer or solicitation on our part with respect to
the purchase or sale of any securities. All trademarks,
service marks and trade names appearing in this report
are the property of their respective owners, and are
likewise used for identification purposes only.
This report is a service available
only to active Paid Premium Members.
You may opt-out of receiving report notifications
at any time. Questions or comments may be submitted
by writing to Premium Membership Services 665 S.E. 10 Street, Suite 201 Deerfield Beach, FL 33441-5634 or by calling 1-800-965-8307
or 954-785-1121.
|
|
|