You are not logged in.
This means you
CAN ONLY VIEW reports that were published prior to Wednesday, April 9, 2025.
You
MUST UPGRADE YOUR MEMBERSHIP if you want to see any current reports.
AFTER MARKET UPDATE - MONDAY, OCTOBER 3RD, 2022
Previous After Market Report Next After Market Report >>>
|
|
|
|
DOW |
+765.38 |
29,490.89 |
+2.66% |
|
Volume |
1,086,809,622 |
-31% |
|
Volume |
4,395,966,300 |
-3% |
|
NASDAQ |
+239.82 |
10,815.43 |
+2.27% |
|
Advancers |
2,627 |
83% |
|
Advancers |
2,998 |
69% |
|
S&P 500 |
+92.81 |
3,678.43 |
+2.59% |
|
Decliners |
529 |
17% |
|
Decliners |
1,337 |
31% |
|
Russell 2000 |
+44.15 |
1,708.87 |
+2.65% |
|
52 Wk Highs |
17 |
|
|
52 Wk Highs |
57 |
|
|
S&P 600 |
+28.12 |
1,093.07 |
+2.64% |
|
52 Wk Lows |
237 |
|
|
52 Wk Lows |
380 |
|
|
 |
Breadth Positive as Major Indices Posted Solid Gains
Kenneth J. Gruneisen - Passed the CAN SLIM® Master's Exam
U.S. equities rallied Monday to start the fourth quarter on a high note. The Dow added 765 points, while the Nasdaq Composite climbed 2.3%. The S&P 500 advanced 2.6%. The volume totals reported were much lighter than the prior session on the NYSE and on the Nasdaq exchange. Breadth was positive as advancers led decliners by a 5-1 margin on the NYSE and 3-1 on the Nasdaq exchange. There were 3 high-ranked companies from the Leaders List that hit new 52-week highs and were listed on the BreakOuts Page, up from zero on the 2 prior sessions. New 52-week lows totals contracted yet still solidly outnumbered new 52-week highs on both the NYSE and the Nasdaq exchange. The market is now in a correction (M criteria).
Chart courtesy of www.stockcharts.com%20on%20Tuesday.%20Yesterday,%20the%20broad%20benchmark%20eclipsed%20the%204,300%20level%20for%20the%20first%20time%20since%20late%20April.%20The%20Nasdaq%20Composite%20fell%201.3%%20amid%20weakness%20in%20mega-cap%20tech%20shares.%20The%20volume%20totals%20reported%20were%20mixed,%20lighter%20than%20the%20prior%20session%20on%20the%20NYSE%20and%20higher%20on%20the%20Nasdaq%20exchange.%20Decliners%20led%20advancers%20by%20a%204-1%20margin%20on%20the%20NYSE%20ad%20by%20a%203-1%20margin%20on%20the%20Nasdaq%20exchange.%20There%20were%2017%20high-ranked%20companies%20from%20the%20Leaders%20List%20that%20hit%20new%2052-week%20highs%20and%20were%20listed%20on%20the%20BreakOuts%20Page,%20down%20from%20the%20total%20of%2045%20on%20the%20prior%20session.%20New%2052-week%20highs%20outnumbered%20new%2052-week%20lows%20on%20the%20NYSE,%20but%20new%20lows%20outnumbered%20new%20highs%20on%20the%20Nasdaq%20exchange.%20The%20market%20is%20in%20a%20confirmed%20uptrend%20(M%20criteria).%20Any%20sustainable%20rally%20requires%20a%20healthy%20crop%20of%20leading%20stocks%20hitting%20new%20highs,%20so%20the%20recent%20improvement%20in%20leadership%20was%20a%20reassuring%20sign.) 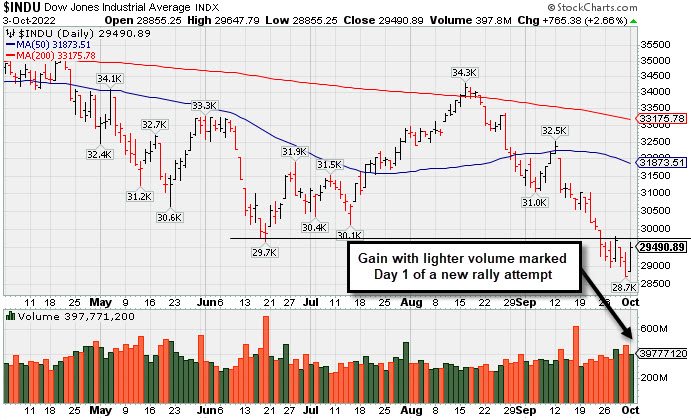 PICTURED: The Dow Jones Industrial Average posted a gain with lighter volume marking Day 1 of a new rally attempt. Caution and patience remain paramount. Disciplined investors know to watch for a follow-through day of big gains on Day 4-7 of a new rally to confirm a new uptrend.
All sectors in the S&P 500 ended in positive territory, with Energy pacing gains. Oversold conditions, a contrarian indicator, are cited as contributing to Monday’s rally. Treasuries continued to rally, with the yield on the benchmark 10-year note down 17 basis points (0.17%) to 3.65%, while the 30-year bond yield declined seven basis points (0.07%) to 3.69%. The yield on the policy-sensitive two-year note shed 13 basis points (0.13%) to 4.12%. In commodities, West Texas Intermediate (WTI) crude jumped 4.8% to $83.33/barrel as investors looked towards Wednesday’s Organization of Petroleum Exporting Countries and their allies (OPEC+) meeting. The group is expected to announce a production cut to help boost prices, and are currently weighing their largest cut since 2020. Meanwhile, a gauge of the U.S. dollar dropped 0.4%, further supporting commodity prices.
On the data front, a final September reading of S&P Global’s U.S. Manufacturing Purchasing Managers’ Index was upwardly revised from 51.8 to 52. Meanwhile, the Institute of Supply Management (ISM) Manufacturing Index came in at its slowest pace in over two years for the month of September. The softer print suggests there may be a slowdown in the economy due to rising interest rates, which could help keep the Federal Reserve (Fed) from overtightening. Construction spending in August declined by a larger-than-anticipated 0.7% after falling by 0.6% in July.
|
 Kenneth J. Gruneisen started out as a licensed stockbroker in August 1987, a couple of months prior to the historic stock market crash that took the Dow Jones Industrial Average down -22.6% in a single day. He has published daily fact-based fundamental and technical analysis on high-ranked stocks online for two decades. Through FACTBASEDINVESTING.COM, Kenneth provides educational articles, news, market commentary, and other information regarding proven investment systems that work in good times and bad.
Comments contained in the body of this report are technical opinions only and are not necessarily those of Gruneisen Growth Corp. The material herein has been obtained from sources believed to be reliable and accurate, however, its accuracy and completeness cannot be guaranteed. Our firm, employees, and customers may effect transactions, including transactions contrary to any recommendation herein, or have positions in the securities mentioned herein or options with respect thereto. Any recommendation contained in this report may not be suitable for all investors and it is not to be deemed an offer or solicitation on our part with respect to the purchase or sale of any securities. |
|
 |
Commodity-Linked Groups and Tech Led Widespread Gains
Kenneth J. Gruneisen - Passed the CAN SLIM® Master's Exam
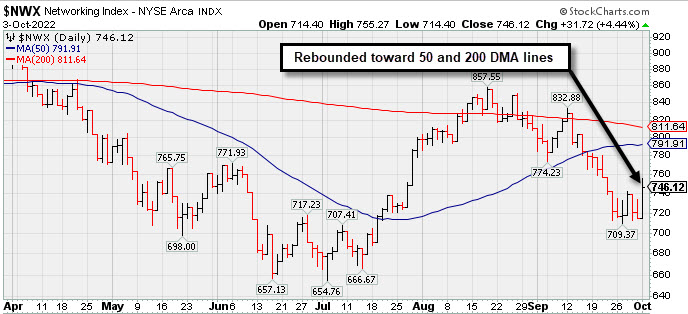
Commodity-linked groups were standout gainers as the Oil Services Index ($OSX +6.58%), Integrated Oil Index ($XOI +5.95%), and Gold & Silver Index ($XAU +5.05%) each posted a big gain. the tech sector saw unanimous gains from the Networking Index ($NWX +4.44%), Semiconductor Index ($SOX +3.76%), and Biotech Index ($BTK +2.08%). The Broker/Dealer Index ($XBD +3.17%), Bank Index ($BKX +3.01%), and Retail Index ($RLX +2.58%) rounded out a day of widespread advances.
PICTURED: The Networking Index ($NWX +4.44%) posted a solid gain, rebounding toward its 50-day 200-day moving average (DMA) lines.
| Oil Services |
$OSX |
63.87 |
+3.94 |
+6.58% |
+21.15% |
| Integrated Oil |
$XOI |
1,593.39 |
+89.44 |
+5.95% |
+35.24% |
| Semiconductor |
$SOX |
2,393.32 |
+86.62 |
+3.76% |
-39.35% |
| Networking |
$NWX |
746.12 |
+31.72 |
+4.44% |
-23.17% |
| Broker/Dealer |
$XBD |
423.21 |
+13.00 |
+3.17% |
-13.07% |
| Retail |
$RLX |
3,044.83 |
+76.53 |
+2.58% |
-27.96% |
| Gold & Silver |
$XAU |
106.00 |
+5.09 |
+5.05% |
-19.97% |
| Bank |
$BKX |
98.71 |
+2.89 |
+3.01% |
-25.34% |
| Biotech |
$BTK |
4,603.08 |
+93.62 |
+2.08% |
-16.59% |
|
|
|
 |
Powerful Breakout While Market Rally Still Needs Confirmation
Kenneth J. Gruneisen - Passed the CAN SLIM® Master's Exam
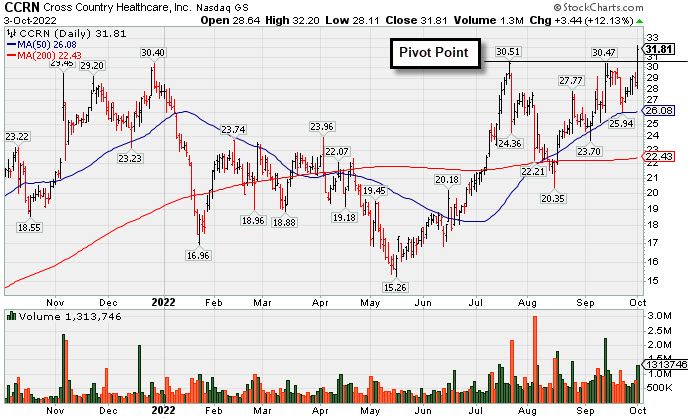
Cross Country Healthcare (CCRN +$3.44 or +12.13% to $31.81) hit a new 52-week high as it rallied above its pivot point with today's big gain backed by +48% above average volume triggering a technical buy signal. Its 50-day moving average (DMA) line ($26.08) defines important near-term support where a violation would raise concerns and trigger a technical sell signal. Members have been repeatedly reminded in the daily Market Commentaries - "The market is in a correction (M criteria) and disciplined investors know to avoid new buying efforts until a new rally confirmed with a follow-through day."
CCRN has a 99 Earnings Per Share Rating, the highest possible. It reported Jun '22 quarterly earnings +198% on +127% sales revenues versus the year ago period. Prior quarterly comparisons showed strong sales revenues and earnings increases. Annual earnings growth (A criteria) has been strong since a downturn in FY '17 and '18.
The company has only 38.2 million shares outstanding (S criteria). The number of top-rated funds owning its shares rose from 326 in Sep '21 to 399 in Jun '22, a reassuring sign concerning the I criteria. Its current Up/Down Volume Ratio of 1.2 is an unbiased indication its shares have been under accumulation over the past 50 days. It has a Timeliness Rating of A and Sponsorship Rating of B.
|
|
|
Color Codes Explained :
Y - Better candidates highlighted by our
staff of experts.
G - Previously featured
in past reports as yellow but may no longer be buyable under the
guidelines.
***Last / Change / Volume data in this table is the closing quote data***
Symbol/Exchange
Company Name
Industry Group |
PRICE |
CHANGE
(%Change) |
Day High |
Volume
(% DAV)
(% 50 day avg vol) |
52 Wk Hi
% From Hi |
Featured
Date |
Price
Featured |
Pivot Featured |
|
Max Buy |
 CI
-
NYSE
CI
-
NYSE
Cigna Corp
Medical-Managed Care
|
$287.22
|
+9.75
3.51% |
$288.61
|
2,314,946
120.19% of 50 DAV
50 DAV is 1,926,000
|
$296.29
-3.06%
|
7/7/2022
|
$276.55
|
PP = $273.68
|
|
MB = $287.36
|
 Most Recent Note - 10/3/2022 6:39:16 PM
G - Rebounded above its 50 DMA line ($284.42) with today's gain backed by near average volume. Fundamental concerns remain after the Jun '22 quarter rose +19% on +5% sales revenues versus the year ago period, breaking a streak of 3 quarterly earnings increases above the +25% minimum guideline (C criteria).
>>> FEATURED STOCK ARTICLE : Found Support Above 50-Day Moving Average Line This Week - 9/16/2022 |
View all notes |
Set NEW NOTE alert |
Company Profile |
SEC
News |
Chart |
Request a new note
C
A
S
I |
ESQ
-
NASDAQ
Esquire Financial Hldgs
Finance-Commercial Loans
|
$38.14
|
+0.59
1.57% |
$38.32
|
24,683
91.42% of 50 DAV
50 DAV is 27,000
|
$41.68
-8.49%
|
7/26/2022
|
$37.74
|
PP = $39.19
|
|
MB = $41.15
|
Most Recent Note - 10/3/2022 6:43:17 PM
G - Posted gain today with lighter volume and closed just above its 50 DMA line ($38.09). Recent slump below the pivot point raised concerns. Faces some near-term resistance due to overhead supply up to the $41 level. The market is in a correction (M criteria) and disciplined investors know to avoid new buying efforts until a new rally confirmed with a follow-through day.
>>> FEATURED STOCK ARTICLE : Thinly-Traded Esquire Still Perched Near High - 9/20/2022 |
View all notes |
Set NEW NOTE alert |
Company Profile |
SEC
News |
Chart |
Request a new note
C
A
S
I |
ENPH
-
NASDAQ
Enphase Energy Inc
Energy-Solar
|
$286.61
|
+9.14
3.29% |
$289.43
|
3,061,768
82.15% of 50 DAV
50 DAV is 3,727,000
|
$324.84
-11.77%
|
7/28/2022
|
$276.66
|
PP = $282.55
|
|
MB = $296.68
|
Most Recent Note - 10/3/2022 6:40:31 PM
G - Posted a gain today with below average volume. Recently sputtering below its 50 DMA line ($289.85) and testing the prior low ($270.57 on 9/23/22). More damaging losses would raise greater concerns. Fundamentals remain strong. The market is in a correction (M criteria) and disciplined investors know to avoid new buying efforts until a new rally confirmed with a follow-through day.
>>> FEATURED STOCK ARTICLE : Found Support After Undercutting 50 DMA and Prior Low - 9/27/2022 |
View all notes |
Set NEW NOTE alert |
Company Profile |
SEC
News |
Chart |
Request a new note
C
A
S
I |
CCRN
-
NASDAQ
Cross Country Healthcare
DIVERSIFIED SERVICES - Staffing and Outsourcing Service
|
$31.81
|
+3.44
12.13% |
$32.20
|
1,313,746
147.94% of 50 DAV
50 DAV is 888,000
|
$30.51
4.26%
|
9/9/2022
|
$27.32
|
PP = $30.61
|
|
MB = $32.14
|
Most Recent Note - 10/3/2022 6:32:42 PM
Y - Hit a new 52-week high as it rallied above its pivot point with today's big gain backed by +48% above average volume triggering a technical buy signal. Its 50 DMA line ($26.08) defines important near-term support where a violation would raise concerns and trigger a technical sell signal. The market is in a correction (M criteria) and disciplined investors know to avoid new buying efforts until a new rally confirmed with a follow-through day. See the latest FSU analysis for more details and a new annotated graph.
>>> FEATURED STOCK ARTICLE : Powerful Breakout While Market Rally Still Needs Confirmation - 10/3/2022 |
View all notes |
Set NEW NOTE alert |
Company Profile |
SEC
News |
Chart |
Request a new note
C
A
S
I |
|
|
|
THESE ARE NOT BUY RECOMMENDATIONS!
Comments contained in the body of this report are technical
opinions only. The material herein has been obtained
from sources believed to be reliable and accurate, however,
its accuracy and completeness cannot be guaranteed.
This site is not an investment advisor, hence it does
not endorse or recommend any securities or other investments.
Any recommendation contained in this report may not
be suitable for all investors and it is not to be deemed
an offer or solicitation on our part with respect to
the purchase or sale of any securities. All trademarks,
service marks and trade names appearing in this report
are the property of their respective owners, and are
likewise used for identification purposes only.
This report is a service available
only to active Paid Premium Members.
You may opt-out of receiving report notifications
at any time. Questions or comments may be submitted
by writing to Premium Membership Services 665 S.E. 10 Street, Suite 201 Deerfield Beach, FL 33441-5634 or by calling 1-800-965-8307
or 954-785-1121.
|
|
|