You are not logged in.
This means you
CAN ONLY VIEW reports that were published prior to Tuesday, April 15, 2025.
You
MUST UPGRADE YOUR MEMBERSHIP if you want to see any current reports.
AFTER MARKET UPDATE - TUESDAY, SEPTEMBER 20TH, 2011
Previous After Market Report Next After Market Report >>>
|
|
|
|
DOW |
+7.65 |
11,408.66 |
+0.07% |
|
Volume |
926,297,680 |
+2% |
|
Volume |
1,872,127,450 |
+1% |
|
NASDAQ |
-22.59 |
2,590.24 |
-0.86% |
|
Advancers |
1,088 |
35% |
|
Advancers |
711 |
27% |
|
S&P 500 |
-2.00 |
1,202.09 |
-0.17% |
|
Decliners |
1,926 |
62% |
|
Decliners |
1,828 |
69% |
|
Russell 2000 |
-12.28 |
689.95 |
-1.75% |
|
52 Wk Highs |
49 |
|
|
52 Wk Highs |
36 |
|
|
S&P 600 |
-6.59 |
376.95 |
-1.72% |
|
52 Wk Lows |
80 |
|
|
52 Wk Lows |
108 |
|
|
 |
Major Averages See Gains Fade in Late Afternoon
Kenneth J. Gruneisen - Passed the CAN SLIM® Master's Exam
The major indices started quietly on Tuesday then rallied for impressive gains, but the gains held up until late in the afternoon when they quickly vanished. The reported volume totals were slightly higher on the NYSE and on the Nasdaq exchange. Breadth was negative as declining issues beat advancers by nearly 2-1 on the NYSE and by more than 2-1 on the Nasdaq exchange. New 52-week lows outnumbered new 52-week highs on both the Nasdaq exchange and the NYSE. One bright note was that there were 40 high-ranked companies from the CANSLIM.net Leaders List that made new 52-week highs and appeared on the CANSLIM.net BreakOuts Page, doubling the prior session total of 20 stocks. There were gains from 8 of the 15 high-ranked companies included on the Featured Stocks Page as the list of most noteworthy buy candidates expanded again.
European markets advanced overnight as they looked past an S&P downgrade of Italian debt and the lowest level of German investor confidence in over two years. The Federal Reserve's two-day meeting began Tuesday, and while traders await the outcome, some believe that the Fed may announce it is altering the composition of its portfolio in an attempt to push down long-term interest rates.
The economic outlook remains on the gloomy side. The International Monetary Fund cut its forecast for global economic growth and predicted "severe" repercussions if Europe fails to contain its debt crisis or if U.S. policy makers fail to agree on a fiscal plan. In the U.S., August housing starts declined 5% to a three-month low and were lower than expected. Building permits unexpectedly climbed.
Netflix Inc (NFLX -9.54%) fell hard as investors turned thumbs down on the company's plan to split its shrinking DVD operation from its streaming service. Apple Inc (AAPL +0.44%) churned above average volume but ended with a small gain as it closed the session in the lower part of its intra-day range after hitting a new record for the second day in a row.
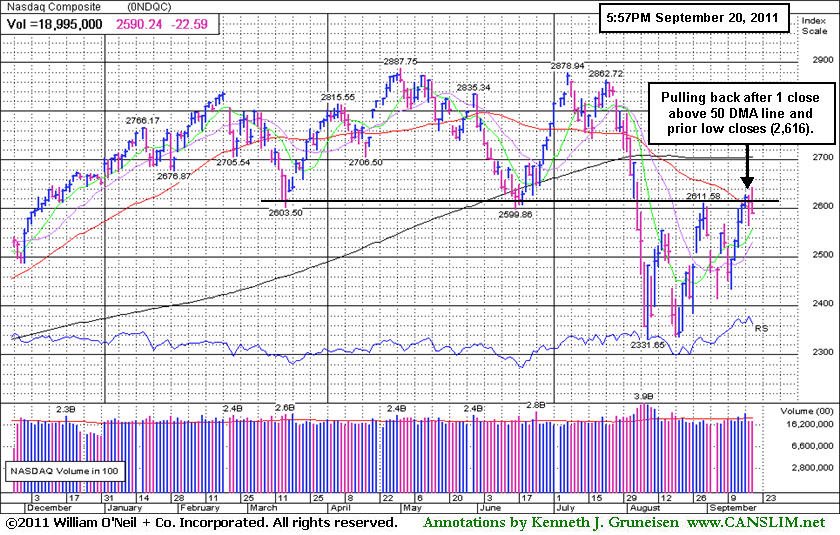
The market environment (M criteria) remains in an uptrend despite recent pressure, and disciplined investors may carefully consider new buying efforts when all key criteria are satisfied. While it is encouraging that the major averages have been keeping the rally alive by staying well above their Day 1 (8/09/11) lows, a further expansion in leadership (new 52-week highs) remains crucial to any sustained advance.
The September 2011 issue of CANSLIM.net News will be available soon. The Q3 2011 Webcast has also been scheduled for Wednesday, September 28th at 8PM EST. Links to all prior reports and webcasts are available on the Premium Member Homepage.
PICTURED: The Nasdaq Composite Index's negative reversal on Tuesday led to a close back below its 50-day moving average (DMA) line. It had managed to close last Friday's session above that important short-term average and above the earlier low closes (2,616).
|
 Kenneth J. Gruneisen started out as a licensed stockbroker in August 1987, a couple of months prior to the historic stock market crash that took the Dow Jones Industrial Average down -22.6% in a single day. He has published daily fact-based fundamental and technical analysis on high-ranked stocks online for two decades. Through FACTBASEDINVESTING.COM, Kenneth provides educational articles, news, market commentary, and other information regarding proven investment systems that work in good times and bad.
Comments contained in the body of this report are technical opinions only and are not necessarily those of Gruneisen Growth Corp. The material herein has been obtained from sources believed to be reliable and accurate, however, its accuracy and completeness cannot be guaranteed. Our firm, employees, and customers may effect transactions, including transactions contrary to any recommendation herein, or have positions in the securities mentioned herein or options with respect thereto. Any recommendation contained in this report may not be suitable for all investors and it is not to be deemed an offer or solicitation on our part with respect to the purchase or sale of any securities. |
|
 |
Gold & Silver Index Posted Standout Gain
Kenneth J. Gruneisen - Passed the CAN SLIM® Master's Exam
The tech sector had a mostly negative bias as the Internet Index ($IIX -1.54%), Networking Index ($NWX -1.53%), and Semiconductor Index ($SOX -1.25%) fell, meanwhile the Biotechnology Index ($BTK +0.66%) posted a modest gain even through the Healthcare Index ($HMO -1.82%) was one of the day's weaker group indexes. Negatively influencing the major averages, the Retail Index ($RLX -1.11%) and financial shares ended modestly lower while the Broker/Dealer Index ($XBD -0.65%) and Bank Index ($BKX -0.35%) fell less than -1% each on the session. The Oil Services Index ($OSX -1.04%) and Integrated Oil Index ($XOI -0.31%) also drifted lower.
Charts courtesy www.stockcharts.com
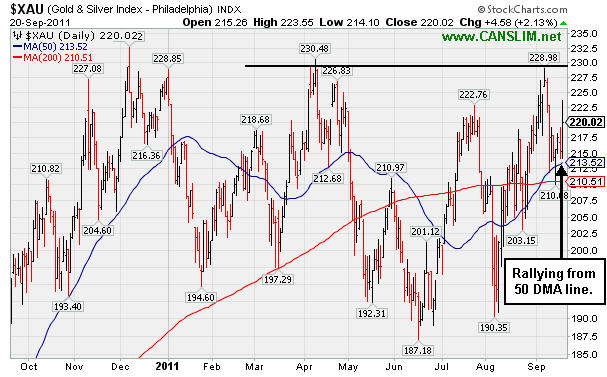
PICTURED: The Gold & Silver Index ($XAU +2.13%) was a standout gainer on Tuesday. It is rallying from its 50-day moving average line after its latest pullback from stubborn multi-month resistance. Out of the 34 high-ranked leaders that met today's Mid-Day Breakouts Report (read here) screening criteria there were 7 companies from the Mining - Gold/Silver/Gems group. Notes in the report pointed out certain strengths and shortcomings in each.
| Oil Services |
$OSX |
229.49 |
-2.41 |
-1.04% |
-6.38% |
| Healthcare |
$HMO |
2,040.25 |
-37.77 |
-1.82% |
+20.58% |
| Integrated Oil |
$XOI |
1,130.04 |
-3.53 |
-0.31% |
-6.85% |
| Semiconductor |
$SOX |
372.76 |
-4.73 |
-1.25% |
-9.48% |
| Networking |
$NWX |
234.75 |
-3.70 |
-1.55% |
-16.33% |
| Internet |
$IIX |
282.83 |
-4.41 |
-1.54% |
-8.09% |
| Broker/Dealer |
$XBD |
86.14 |
-0.56 |
-0.64% |
-29.11% |
| Retail |
$RLX |
526.36 |
-5.89 |
-1.11% |
+3.54% |
| Gold & Silver |
$XAU |
220.02 |
+4.58 |
+2.13% |
-2.90% |
| Bank |
$BKX |
37.46 |
-0.13 |
-0.35% |
-28.25% |
| Biotech |
$BTK |
1,189.31 |
+7.80 |
+0.66% |
-8.35% |
|
|
|
 |
Market Reaction Positive on Acquistion News
Kenneth J. Gruneisen - Passed the CAN SLIM® Master's Exam
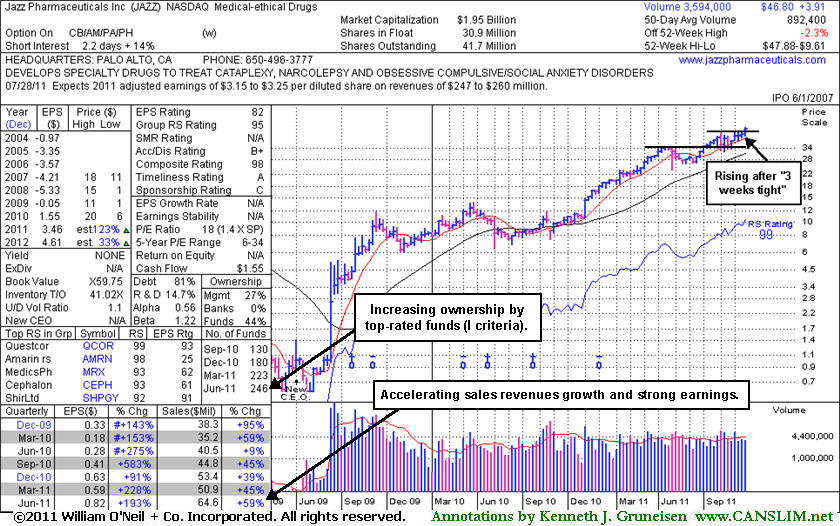
Jazz Pharmaceuticals Inc (JAZZ +$3.06 or +7.01% to $46.80) hit a new all-time high today with a gain backed by more than 3 times average volume. The breakout came after news it plans to take over Dublin-based Azur Pharma Ltd in a deal to add a new (N criteria) pain drug and diversify its product portfolio. The earlier mid-day report (read here) highlighted it in yellow after a recent consolidation was considered a "3-weeks tight" pattern. It quietly held its ground at all-time highs following the previously noted choppy 5-week consolidation not recognized as a sound base pattern.
Ownership by top-rated funds rose from 117 in Jun '10 to 246 in Jun '11, a reassuring sign concerning the I criteria. It reported earnings +193% on +59% sales revenues for the quarter ended June 30, 2011, and strong earnings in recent comparisons (C criteria) were backed by accelerating sales revenues growth. Regular readers may note prior concerns that FY '10 was its first ever profitable year, while the investment system's A criteria calls for a strong 3-5 year earnings growth history. Recent quarterly comparisons showed greatly improved sales revenues and earnings increases. Although the Medical - Ethical Drugs firm rose more than 80-fold from its low of $0.52 in April 2009, its fundamental and technical strength may warrant a closer look today. Disciplined investors know to always limit losses if ever any stock falls more than -7% from their purchase price.
 |
|
|
Color Codes Explained :
Y - Better candidates highlighted by our
staff of experts.
G - Previously featured
in past reports as yellow but may no longer be buyable under the
guidelines.
***Last / Change / Volume data in this table is the closing quote data***
Symbol/Exchange
Company Name
Industry Group |
PRICE |
CHANGE
(%Change) |
Day High |
Volume
(% DAV)
(% 50 day avg vol) |
52 Wk Hi
% From Hi |
Featured
Date |
Price
Featured |
Pivot Featured |
|
Max Buy |
AAPL
-
NASDAQ
Apple Inc
COMPUTER HARDWARE - Personal Computers
|
$413.45
|
+1.82
0.44% |
$422.86
|
27,687,717
126.34% of 50 DAV
50 DAV is 21,914,500
|
$413.23
0.05%
|
9/16/2011
|
$399.14
|
PP = $404.60
|
|
MB = $424.83
|
 Most Recent Note - 9/20/2011 12:14:05 PM
Y - Gapped up today following a finish near the session high on the prior session after rallying to a new all-time high with +36% above average volume behind a 6th consecutive gain. It is already heavily owned by the institutional crowd, and ownership by top-rated funds fell from 4,366 in Mar '11 to 4,343 in Jun '11. See the latest FSU analysis for more details and a new annotated graph.
>>> The latest Featured Stock Update with an annotated graph appeared on 9/19/2011. Click here.
View all notes |
Alert me of new notes |
CANSLIM.net Company Profile |
SEC |
Zacks Reports |
StockTalk |
News |
Chart |
Request a new note
C
A N
S L
I M


|
ALXN
-
NASDAQ
Alexion Pharmaceuticals
DRUGS - Drug Manufacturers - Other
|
$66.20
|
+2.35
3.68% |
$66.90
|
2,212,582
138.26% of 50 DAV
50 DAV is 1,600,300
|
$64.40
2.80%
|
9/15/2011
|
$63.20
|
PP = $60.81
|
|
MB = $63.85
|
Most Recent Note - 9/20/2011 12:20:47 PM
G - Color code was changed to green after rallying well above its "max buy" level. Prior resistance in the $59-60 area defines initial support to watch on pullbacks.
>>> The latest Featured Stock Update with an annotated graph appeared on 9/15/2011. Click here.
View all notes |
Alert me of new notes |
CANSLIM.net Company Profile |
SEC |
Zacks Reports |
StockTalk |
News |
Chart |
Request a new note
C
A N
S L
I M
|
ATHN
-
NASDAQ
Athenahealth Inc
DIVERSIFIED SERVICES - Business/Management Services
|
$68.31
|
-0.94
-1.36% |
$70.53
|
1,398,021
182.01% of 50 DAV
50 DAV is 768,100
|
$72.70
-6.04%
|
9/8/2011
|
$61.93
|
PP = $61.78
|
|
MB = $64.87
|
Most Recent Note - 9/20/2011 12:22:45 PM
G - Recent spurt of gains backed by above average volume lifted it to an all-time high. It is extended from its prior base. Prior highs in the $61 area define initial support on pullbacks.
>>> The latest Featured Stock Update with an annotated graph appeared on 9/8/2011. Click here.
View all notes |
Alert me of new notes |
CANSLIM.net Company Profile |
SEC |
Zacks Reports |
StockTalk |
News |
Chart |
Request a new note
C
A N
S L
I M
|
CELG
-
NASDAQ
Celgene Corp
DRUGS - Drug Manufacturers - Major
|
$65.56
|
+4.37
7.14% |
$65.86
|
11,115,318
291.89% of 50 DAV
50 DAV is 3,808,000
|
$63.46
3.31%
|
9/16/2011
|
$61.21
|
PP = $62.59
|
|
MB = $65.72
|
Most Recent Note - 9/20/2011 12:26:10 PM
Y - Considerable gain today with above average volume, hitting a new 52-week high while rallying above previously stubborn resistance in the $62 area. Disciplined investors use a tactic called "pyramiding" to avoid chasing stocks more than +5% above prior highs. See the latest FSU analysis for more details and an annotated weekly graph.
>>> The latest Featured Stock Update with an annotated graph appeared on 9/16/2011. Click here.
View all notes |
Alert me of new notes |
CANSLIM.net Company Profile |
SEC |
Zacks Reports |
StockTalk |
News |
Chart |
Request a new note
C
A N
S L
I M
|
DMND
-
NASDAQ
Diamond Foods Inc
FOOD and; BEVERAGE - Processed and; Packaged Goods
|
$92.47
|
+4.97
5.68% |
$93.33
|
580,663
204.96% of 50 DAV
50 DAV is 283,300
|
$90.33
2.37%
|
9/13/2011
|
$75.57
|
PP = $80.16
|
|
MB = $84.17
|
Most Recent Note - 9/20/2011 12:38:29 PM
G - Hitting another new all-time high today. Color code was changed to green after quickly getting extended from its prior base. Prior highs in the $80 area define initial support to watch on pullbacks.
>>> The latest Featured Stock Update with an annotated graph appeared on 9/13/2011. Click here.
View all notes |
Alert me of new notes |
CANSLIM.net Company Profile |
SEC |
Zacks Reports |
StockTalk |
News |
Chart |
Request a new note
C
A N
S L
I M
|
Symbol/Exchange
Company Name
Industry Group |
PRICE |
CHANGE
(%Change) |
Day High |
Volume
(% DAV)
(% 50 day avg vol) |
52 Wk Hi
% From Hi |
Featured
Date |
Price
Featured |
Pivot Featured |
|
Max Buy |
EXLS
-
NASDAQ
Exlservice Holdings Inc
DIVERSIFIED SERVICES - Business/Management Services
|
$22.79
|
-0.02
-0.09% |
$23.04
|
476,418
263.65% of 50 DAV
50 DAV is 180,700
|
$26.55
-14.16%
|
8/2/2011
|
$24.85
|
PP = $24.85
|
|
MB = $26.09
|
Most Recent Note - 9/20/2011 4:27:11 PM
G - Churning above average volume while still holding its ground above its 200 DMA line following its damaging 9/13/11 gap down. Priced its previously noted Secondary Offering at $23.00. A rebound above its 50 DMA line would help its outlook.
>>> The latest Featured Stock Update with an annotated graph appeared on 9/7/2011. Click here.
View all notes |
Alert me of new notes |
CANSLIM.net Company Profile |
SEC |
Zacks Reports |
StockTalk |
News |
Chart |
Request a new note
C
A N
S L
I M
|
FCFS
-
NASDAQ
First Cash Financial Svs
SPECIALTY RETAIL - Specialty Retail, Other
|
$50.36
|
-0.93
-1.81% |
$52.18
|
362,391
95.79% of 50 DAV
50 DAV is 378,300
|
$52.06
-3.26%
|
5/31/2011
|
$42.00
|
PP = $40.23
|
|
MB = $42.24
|
Most Recent Note - 9/20/2011 4:00:27 PM
G - Touched another new all-time high today then reversed into the red for a small loss on below average volume. It is extended from its prior base, and its 50 DMA line defines support to watch.
>>> The latest Featured Stock Update with an annotated graph appeared on 9/6/2011. Click here.
View all notes |
Alert me of new notes |
CANSLIM.net Company Profile |
SEC |
Zacks Reports |
StockTalk |
News |
Chart |
Request a new note
C
A N
S L
I M
|
JAZZ
-
NASDAQ
Jazz Pharmaceuticals Inc
DRUGS - Biotechnology
|
$46.80
|
+3.06
7.01% |
$47.88
|
2,910,444
326.14% of 50 DAV
50 DAV is 892,400
|
$45.00
4.00%
|
9/20/2011
|
$46.56
|
PP = $44.63
|
|
MB = $46.86
|
Most Recent Note - 9/20/2011 5:54:07 PM
Y - Hit a new all-time high today with more than 3 times average volume after news it plans to take over Dublin-based Azur Pharma Ltd in a deal to add a new (N criteria) pain drug and diversify its product portfolio. It was highlighted in yellow in the earlier mid-day report (read here) while rising from a "3-weeks tight" pattern, and its strong finish for a solid gain into new high territory triggered a technical buy signal. Ownership by top-rated funds rose from 117 in Jun '10 to 246 in Jun '11, a reassuring sign concerning the I criteria. See the latest FSU analysis for more details and an annotated weekly graph.
>>> The latest Featured Stock Update with an annotated graph appeared on 9/20/2011. Click here.
View all notes |
Alert me of new notes |
CANSLIM.net Company Profile |
SEC |
Zacks Reports |
StockTalk |
News |
Chart |
Request a new note
C
A N
S L
I M
|
JCOM
-
NASDAQ
J 2 Global Communication
INTERNET - Internet Software and Services
|
$30.25
|
-0.81
-2.61% |
$31.71
|
425,966
97.68% of 50 DAV
50 DAV is 436,100
|
$32.67
-7.42%
|
8/8/2011
|
$30.38
|
PP = $29.31
|
|
MB = $30.78
|
Most Recent Note - 9/20/2011 4:35:36 PM
G - Closed near the session low today with light volume behind its 3rd consecutive loss since touching a new 52-week high. Previous highs in the $30-31 area define initial chart support to watch above its closely coinciding 50 and 200 DMA lines.
>>> The latest Featured Stock Update with an annotated graph appeared on 8/29/2011. Click here.
View all notes |
Alert me of new notes |
CANSLIM.net Company Profile |
SEC |
Zacks Reports |
StockTalk |
News |
Chart |
Request a new note
C
A N
S L
I M
|
MA
-
NYSE
Mastercard Inc Cl A
DIVERSIFIED SERVICES - Business/Management Services
|
$353.78
|
+5.80
1.67% |
$361.94
|
2,290,133
148.30% of 50 DAV
50 DAV is 1,544,300
|
$352.00
0.51%
|
8/3/2011
|
$324.82
|
PP = $322.38
|
|
MB = $338.50
|
Most Recent Note - 9/20/2011 1:23:03 PM
G - Rallying to a new all-time high today, getting extended from prior chart highs in the $340 area that define initial support above its 50 DMA line.
>>> The latest Featured Stock Update with an annotated graph appeared on 9/12/2011. Click here.
View all notes |
Alert me of new notes |
CANSLIM.net Company Profile |
SEC |
Zacks Reports |
StockTalk |
News |
Chart |
Request a new note
C
A N
S L
I M
|
Symbol/Exchange
Company Name
Industry Group |
PRICE |
CHANGE
(%Change) |
Day High |
Volume
(% DAV)
(% 50 day avg vol) |
52 Wk Hi
% From Hi |
Featured
Date |
Price
Featured |
Pivot Featured |
|
Max Buy |
MG
-
NYSE
Mistras Group Inc
DIVERSIFIED SERVICES - Bulding and Faci;ity Management Services
|
$18.64
|
-1.04
-5.28% |
$19.98
|
139,630
78.27% of 50 DAV
50 DAV is 178,400
|
$20.82
-10.47%
|
8/10/2011
|
$17.89
|
PP = $17.58
|
|
MB = $18.46
|
Most Recent Note - 9/20/2011 3:58:33 PM
G - Down considerably today without heavy volume, slumping toward prior resistance in the $18 area and its 50 DMA line previously noted as important chart support to watch on pullbacks.
>>> The latest Featured Stock Update with an annotated graph appeared on 9/9/2011. Click here.
View all notes |
Alert me of new notes |
CANSLIM.net Company Profile |
SEC |
Zacks Reports |
StockTalk |
News |
Chart |
Request a new note
C
A N
S L
I M
|
MKTX
-
NASDAQ
Marketaxess Holdings Inc
FINANCIAL SERVICES - Investment Brokerage - Nationa
|
$27.17
|
-0.51
-1.84% |
$28.15
|
207,528
74.28% of 50 DAV
50 DAV is 279,400
|
$30.95
-12.21%
|
7/29/2011
|
$25.87
|
PP = $26.35
|
|
MB = $27.67
|
Most Recent Note - 9/20/2011 4:29:33 PM
G - Still consolidating above support at prior highs in the $26 area and its 50 DMA line. Gapped down on 9/16/11 following news of a small Secondary Offering of 950,000 shares priced at $28.65.
>>> The latest Featured Stock Update with an annotated graph appeared on 9/2/2011. Click here.
View all notes |
Alert me of new notes |
CANSLIM.net Company Profile |
SEC |
Zacks Reports |
StockTalk |
News |
Chart |
Request a new note
C
A N
S L
I M
|
PCLN
-
NASDAQ
Priceline.Com Inc
INTERNET - Internet Software and Services
|
$537.24
|
+5.79
1.09% |
$554.00
|
1,734,841
131.29% of 50 DAV
50 DAV is 1,321,400
|
$561.88
-4.39%
|
9/20/2011
|
$539.46
|
PP = $552.25
|
|
MB = $579.86
|
Most Recent Note - 9/20/2011 4:32:49 PM
Y - Perched within close striking distance of its 52-week high. It finished just below the mid-point of the session's range after highlighted in the earlier mid-day report (read here) in yellow with pivot point cited based on its 7/08/11 high plus 10 cents. A volume-driven gain may trigger a technical buy signal. PCLN rebounded after a brief violation of its 200 DMA line during its choppy consolidation since it was dropped from the Featured Stocks list on 8/18/11.
>>> The latest Featured Stock Update with an annotated graph appeared on 8/12/2011. Click here.
View all notes |
Alert me of new notes |
CANSLIM.net Company Profile |
SEC |
Zacks Reports |
StockTalk |
News |
Chart |
Request a new note
C
A N
S L
I M
|
PSMT
-
NASDAQ
Pricesmart Inc
RETAIL - Drug Stores
|
$72.56
|
-1.60
-2.16% |
$75.16
|
247,961
82.74% of 50 DAV
50 DAV is 299,700
|
$74.59
-2.72%
|
8/30/2011
|
$63.01
|
PP = $62.37
|
|
MB = $65.49
|
Most Recent Note - 9/20/2011 4:23:26 PM
G - Today's loss on light volume snapped a streak of 10 consecutive gains backed by above average volume. It is extended from its prior base. Prior highs and its 50 DMA line define support levels to watch on pullbacks.
>>> The latest Featured Stock Update with an annotated graph appeared on 9/14/2011. Click here.
View all notes |
Alert me of new notes |
CANSLIM.net Company Profile |
SEC |
Zacks Reports |
StockTalk |
News |
Chart |
Request a new note
C
A N
S L
I M
|
V
-
NYSE
Visa Inc Cl A
DIVERSIFIED SERVICES - Business/Management Services
|
$92.84
|
+2.81
3.12% |
$94.75
|
9,015,993
154.14% of 50 DAV
50 DAV is 5,849,100
|
$91.52
1.44%
|
9/20/2011
|
$93.91
|
PP = $90.93
|
|
MB = $95.48
|
Most Recent Note - 9/20/2011 1:45:26 PM
Y - Considerable gain today for a new all-time high with volume running at an above average pace, clearing an 11-week base during which it found impressive support near its 200 DMA line. Color code is changed to yellow with pivot point based on its 7/07/11 high plus 10 cents. Quarterly and annual earnings history has been strong.
There are no Featured Stock Updates™ available for this stock at this time. You may request one by clicking the Request a New Note link below
View all notes |
Alert me of new notes |
CANSLIM.net Company Profile |
SEC |
Zacks Reports |
StockTalk |
News |
Chart |
Request a new note
C
A N
S L
I M
|
Symbol/Exchange
Company Name
Industry Group |
PRICE |
CHANGE
(%Change) |
Day High |
Volume
(% DAV)
(% 50 day avg vol) |
52 Wk Hi
% From Hi |
Featured
Date |
Price
Featured |
Pivot Featured |
|
Max Buy |
|
|
|
THESE ARE NOT BUY RECOMMENDATIONS!
Comments contained in the body of this report are technical
opinions only. The material herein has been obtained
from sources believed to be reliable and accurate, however,
its accuracy and completeness cannot be guaranteed.
This site is not an investment advisor, hence it does
not endorse or recommend any securities or other investments.
Any recommendation contained in this report may not
be suitable for all investors and it is not to be deemed
an offer or solicitation on our part with respect to
the purchase or sale of any securities. All trademarks,
service marks and trade names appearing in this report
are the property of their respective owners, and are
likewise used for identification purposes only.
This report is a service available
only to active Paid Premium Members.
You may opt-out of receiving report notifications
at any time. Questions or comments may be submitted
by writing to Premium Membership Services 665 S.E. 10 Street, Suite 201 Deerfield Beach, FL 33441-5634 or by calling 1-800-965-8307
or 954-785-1121.
|
|
|

