You are not logged in.
This means
you CAN ONLY VIEW reports that were published prior to Monday, April 14, 2025.
You
MUST UPGRADE YOUR MEMBERSHIP if you want to see any current reports.
 MIDDAY BREAKOUTS REPORT - WEDNESDAY, SEPTEMBER 21ST, 2011 MIDDAY BREAKOUTS REPORT - WEDNESDAY, SEPTEMBER 21ST, 2011
Previous Mid Day Report Next Mid Day Report >>>
|
|
DOW 11357.19 -51.47 (-0.45%) | NASDAQ 2601.62 11.38 (0.44%) | S&P 500 1193.99 -8.1 (-0.67%)
|
Time of Screening :
9/21/2011 12:21:41 PM Report Released :
9/21/2011 1:17:19 PM
Price is:
Above 52W High and Less Than 52W High
but within 10% of the 52 Week High
Volume Is:
At least 57.5% of 50 Day Average at
the time of the screening.
More details about this report...
At around
mid-way through each trading day we run
a screen against our database of
high-ranked stocks, searching for
possible buy candidates that are trading
at or near their 52-week high on above
average volume. The results of that
screen are split into the two sections
you see below. The first, titled
"TODAY's FEATURED STOCKS" shows stocks
that our experts have recently
identified as among the strongest candidates to
consider. Stocks highlighted in yellow
are the most timely and noteworthy, so
particular attention and prompt action
may be appropriate. The second section,
titled "TODAY's BREAKOUT SCREEN" shows
the remainder of stocks meeting today's
screen parameters. Our experts have
reviewed and included notes on these
stocks as well, but found that they may
not match up as favorably.
|
|
Y - Today's strongest
candidates
highlighted
by our staff
of experts.
|
|
G - Previously featured in
this report as yellow and
now may no longer be buyable
under the guidelines.
|
|
|
Symbol/Exchange
Company Name
Industry Group |
PRICE |
CHANGE
(%Change) |
Day High |
Volume
(% DAV)
(50 DAV) |
52 Wk Hi
% From Hi |
Date
Featured |
Price
Featured |
Pivot Point |
|
Max Buy |
ATHN
- NASDAQ
Athenahealth Inc
|
$68.46
|
+0.15
0.22%
|
$69.59
|
595,237
75.30% of 50 DAV
50 DAV is 790,500
|
$72.70
-5.83%
|
9/8/2011 |
$61.93
|
PP = $61.78
MB = $64.87 |
Most Recent Note - 9/21/2011 12:24:49 PM
G - Holding its ground perched near its all-time high after a recent spurt of gains backed by above average volume. It is extended from its prior base. Prior highs in the $61 area define initial support on pullbacks.
>>> The latest Featured Stock Update with an annotated graph appeared on 9/8/2011. Click here.
|
|
View all notes |
Alert me of new notes |
Company Profile |
SEC |
News |
Chart | C
A N
S L
I M
|
CELG
- NASDAQ
Celgene Corp
|
$64.92
|
-0.64
-0.98%
|
$65.83
|
2,362,732
59.15% of 50 DAV
50 DAV is 3,994,500
|
$65.86
-1.43%
|
9/16/2011 |
$61.21
|
PP = $62.59
MB = $65.72 |
Most Recent Note - 9/21/2011 12:29:08 PM
Y - Pulling back marginally thus far today after trading near its "max buy" level. Its considerable gain on 9/20/11 with more than 3 times average volume triggered a technical buy signal as it spiked to a new 52-week high and rallied above previously stubborn resistance in the $62 area. Disciplined investors use a tactic called "pyramiding" to avoid chasing stocks more than +5% above prior highs. See the latest FSU analysis for more details and an annotated weekly graph.
>>> The latest Featured Stock Update with an annotated graph appeared on 9/16/2011. Click here.
|
|
View all notes |
Alert me of new notes |
Company Profile |
SEC |
News |
Chart | C
A N
S L
I M
|
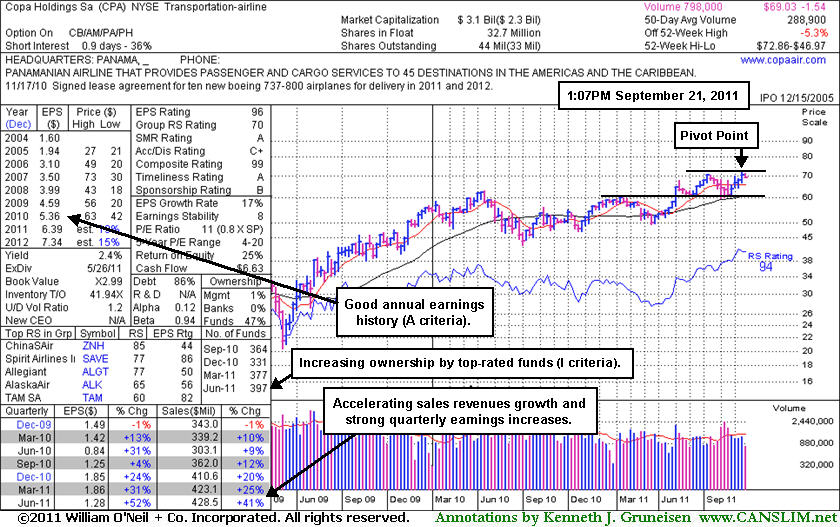
CPA
- NYSE
Copa Holdings Sa
|
$69.67
|
-0.94
-1.33%
|
$70.87
|
173,873
60.18% of 50 DAV
50 DAV is 288,900
|
$72.86
-4.38%
|
9/21/2011 |
$69.67
|
PP = $72.86
MB = $76.50 |
Most Recent Note - 9/21/2011
Y - Confirming gains with heavy volume for a new high close are needed before disciplined investors might consider this high-ranked Panama-based airline a legitimate buy candidate. Color code is changed to yellow with pivot point based on its 9/14/11 high while it is now forming a high handle following a 10-week cup shaped base pattern. Found support above its 200 DMA line and prior highs in the $59 area during its recent consolidation. It is hovering near its 52-week high and within close striking distance of its 2007 all-time high ($73.33). Reported earnings +52% on +41% sales revenues for the quarter ended June 30, 2011 versus the year ago period. Sales revenues and earnings have improved in the 3 most recent quarterly comparisons (Dec '10, Mar and Jun '11) after a streak of negative or weak comparisons. Annual earnings (the A criteria) growth has been good, and increasing institutional ownership (the I criteria) is an encouraging sign.
There are no Featured Stock Updates™ available for this stock at this time. You may request one by clicking the Request a New Note link below
|
|
View all notes |
Alert me of new notes |
Company Profile |
SEC |
News |
Chart | C
A N
S L
I M
|
DMND
- NASDAQ
Diamond Foods Inc
|
$91.15
|
-1.32
-1.43%
|
$96.13
|
430,124
147.45% of 50 DAV
50 DAV is 291,700
|
$96.13
-5.18%
|
9/13/2011 |
$75.57
|
PP = $80.16
MB = $84.17 |
Most Recent Note - 9/21/2011 12:48:42 PM
G - Hit another new all-time high today before reversing into the red. It is extended from its latest sound base pattern, and prior highs in the $80 area define initial chart support to watch on pullbacks.
>>> The latest Featured Stock Update with an annotated graph appeared on 9/13/2011. Click here.
|
|
View all notes |
Alert me of new notes |
Company Profile |
SEC |
News |
Chart | C
A N
S L
I M
|
|
 |
Symbol - Exchange - Industry Group
Company Name |
Last |
Chg |
Day
High |
52 WK Hi |
% From Hi |
Volume
% DAV |
DAV |
CMG
- NYSE - LEISURE - Restaurants
Chipotle Mexican Grill
|
$340.87 |
+7.68
2.30%
|
$340.99
|
$346.78
|
-1.70% |
942,391
97.60%
|
965,600
|
Most Recent Note for CMG - 9/21/2011 12:32:11 PM
Trading up today following a negative reversal on the prior session after reaching a new all-time high with a spurt of 6 consecutive gains. Found support above its 200 DMA line during its consolidation since fundamental concerns prompted it to be dropped from the Featured Stocks list on 8/02/11. Reported earnings per share +12% on +22% sales revenues for the quarter ended June 30, 2011 versus the year ago period, marking its 2nd consecutive quarterly comparison with earnings below the +25% guideline.
|
|
View all notes |
Alert me of new notes |
Company Profile |
SEC |
News |
Chart | C
A N
S L
I M
|
CSH
- NYSE - SPECIALTY RETAIL - Specialty Retail, Other
Cash America Intl Inc
|
$58.21 |
-1.34
-2.25%
|
$59.87
|
$62.33
|
-6.61% |
205,670
64.55%
|
318,600
|
Most Recent Note for CSH - 9/21/2011 12:46:56 PM
Pulling back today following a negative reversal on the prior session after touching a new all-time high. Volume was heavy behind its breakout gain as the 9/15/11 mid-day report noted - "Slumped below its 50 DMA line in the interim, yet now clearing the prior high hit when noted in the 7/22/11 mid-day report -'Reported earnings +28% on +14% sales revenues for the quarter ended June 30, 2011 versus the year ago period. Earnings increases have been strong on an annual basis (A criteria), however quarterly comparisons through Mar '11 had sales revenues and earnings increases below the fact-based investment system's guidelines.'"
|
|
View all notes |
Alert me of new notes |
Company Profile |
SEC |
News |
Chart | C
A N
S L
I M
|
FMX
- NYSE - FOOD & BEVERAGE - Beverages - Brewers
Fomento Econ Mex Sab Ads
|
$68.00 |
+0.50
0.74%
|
$68.51
|
$73.84
|
-7.91% |
455,918
71.40%
|
638,500
|
Most Recent Note for FMX - 9/21/2011 12:49:34 PM
Consolidating near its 50 DMA line. Rebounded after slumping to its 200 DMA line since noted at its 52-week and all-time high in the 7/28/11 mid-day report - "Sales revenues and earnings growth has not been strong and steady. Its annual earnings history (A criteria) included a downturn in FY '08."
|
|
View all notes |
Alert me of new notes |
Company Profile |
SEC |
News |
Chart | C
A N
S L
I M
|
KEX
- NYSE - TRANSPORTATION - Shipping
Kirby Corp
|
$54.93 |
-1.41
-2.50%
|
$56.58
|
$60.00
|
-8.45% |
303,662
65.73%
|
462,000
|
Most Recent Note for KEX - 9/21/2011 12:54:41 PM
Pulling back today following a negative reversal on the prior session after challenging its 52-week high. The 9/13/11 mid-day report noted - "Reported earnings +56% on +60% sales revenues for the quarter ended June 30, 2011 versus the year ago period. Prior quarterly comparisons showed sub par sales and earnings results. It survived but failed to impress since it was dropped from the Featured Stocks list on 6/12/2008. Traded up as much as +21.5% after first featured at $50.74 in the 3/18/08 CANSLIM.net Mid-Day BreakOuts Report (read here)."
|
|
View all notes |
Alert me of new notes |
Company Profile |
SEC |
News |
Chart | C
A N
S L
I M
|
RIC
- AMEX - METALS & MINING - Gold
Richmont Mines Inc
|
$13.11 |
+0.02
0.15%
|
$13.17
|
$13.40
|
-2.16% |
345,238
62.25%
|
554,600
|
Most Recent Note for RIC - 9/21/2011 12:57:06 PM
Perched at its all-time high today after a streak of 3 consecutive volume-driven gains, getting more extended from prior highs in the $10 area. Leadership in the Mining - Gold/Silver/Gems group (L criteria) has helped it rally among numerous other gold mining firms showing recent strength. Recent quarterly comparisons show sales revenues and earnings improvement, but its prior earnings history is below the investment system guidelines.
|
|
View all notes |
Alert me of new notes |
Company Profile |
SEC |
News |
Chart | C
A N
S L
I M
|
UL
- NYSE - FOOD & BEVERAGE - Food - Major Diversified
Unilever Plc
|
$31.17 |
-0.03
-0.10%
|
$31.21
|
$34.55
|
-9.78% |
1,330,364
64.24%
|
2,071,000
|
Most Recent Note for UL - 9/21/2011 12:58:16 PM
Slumped under its 200 DMA line while enduring mild distributional pressure in recent weeks, trading near its August lows. Prior mid-day reports noted - "Annual and quarterly earnings history have been below guidelines."
|
|
View all notes |
Alert me of new notes |
Company Profile |
SEC |
News |
Chart | C
A N
S L
I M
|
WES
- NYSE - ENERGY - Oil &; Gas Pipelines
Western Gas Partners Lp
|
$35.90 |
+0.00
0.00%
|
$36.03
|
$37.48
|
-4.22% |
292,192
120.44%
|
242,600
|
Most Recent Note for WES - 9/21/2011 1:04:10 PM
Consolidating above its 50 and 200 DMA lines after a gap down following a new Public Offering on 9/20/11. It was just challenging its all-time high on the prior session. This Master Limited Partnership's quarterly earnings and sales revenues growth history are below guidelines of the fact-based investment system.
|
|
View all notes |
Alert me of new notes |
Company Profile |
SEC |
News |
Chart | C
A N
S L
I M
|
|
|
|
THESE ARE NOT BUY RECOMMENDATIONS!
Comments contained in the body of this report are technical
opinions only. The material herein has been obtained
from sources believed to be reliable and accurate, however,
its accuracy and completeness cannot be guaranteed.
We are not an investment advisor, hence it does
not endorse or recommend any securities or other investments.
Any recommendation contained in this report may not
be suitable for all investors and it is not to be deemed
an offer or solicitation on our part with respect to
the purchase or sale of any securities. All trademarks,
service marks and trade names appearing in this report
are the property of their respective owners, and are
likewise used for identification purposes only.
This report is a service available
only to active Paid Premium Members.
You may opt-out of receiving report notifications
at any time. Questions or comments may be submitted
by writing to FactBasedInvesting.com c/o Premium
Member Services 665 S.E. 10 Street, Suite 201
Deerfield Beach, FL 33441-5634 or by calling 954-785-1121.
We appreciate any feedback
members may wish to send via the inquiry form
here.
|
|
|


