You are not logged in.
This means you
CAN ONLY VIEW reports that were published prior to Tuesday, April 8, 2025.
You
MUST UPGRADE YOUR MEMBERSHIP if you want to see any current reports.
AFTER MARKET UPDATE - THURSDAY, AUGUST 29TH, 2013
Previous After Market Report Next After Market Report >>>
|
|
|
|
DOW |
+16.44 |
14,840.95 |
+0.11% |
|
Volume |
547,233,260 |
-9% |
|
Volume |
1,292,413,980 |
-3% |
|
NASDAQ |
+26.95 |
3,620.30 |
+0.75% |
|
Advancers |
1,940 |
62% |
|
Advancers |
1,801 |
69% |
|
S&P 500 |
+3.21 |
1,638.17 |
+0.20% |
|
Decliners |
1,064 |
34% |
|
Decliners |
711 |
27% |
|
Russell 2000 |
+10.44 |
1,026.94 |
+1.03% |
|
52 Wk Highs |
27 |
|
|
52 Wk Highs |
61 |
|
|
S&P 600 |
+5.16 |
581.52 |
+0.90% |
|
52 Wk Lows |
33 |
|
|
52 Wk Lows |
20 |
|
|
 |
Major Averages Edged Higher With Weaker Volume Totals
Kenneth J. Gruneisen - Passed the CAN SLIM® Master's Exam
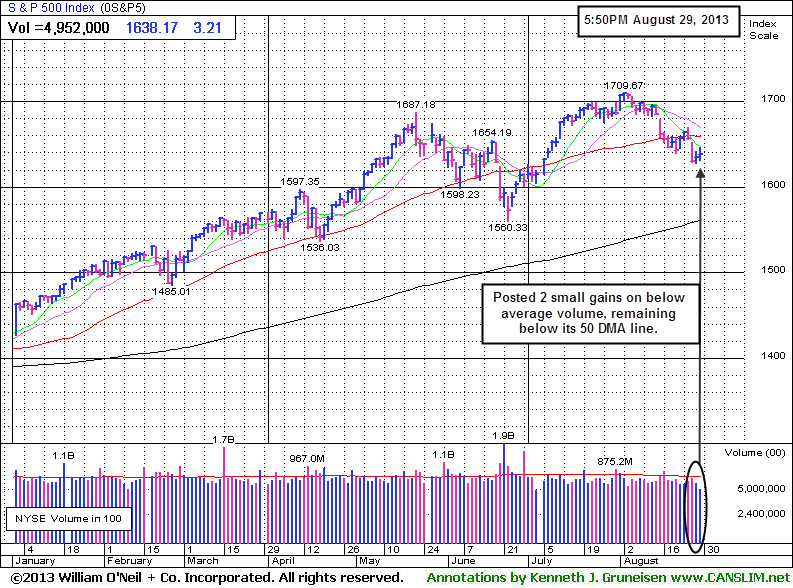
The major averages rose for a second day as encouraging economic data helped offset concerns surrounding Syria. Thursday's volume totals were reported lighter than the prior session totals on the NYSE and on the Nasdaq exchange. Breadth was positive as advancers led decliners by an 11-6 margin on the NYSE and by a 13-5 margin on the Nasdaq exchange. There were 14 high-ranked companies from the CANSLIM.net Leaders List that made new 52-week highs and appeared on the CANSLIM.net BreakOuts Page, up from a total of 11 stocks on the prior session. The list of stocks hitting new 52-week lows outnumbered new 52-week highs on the NYSE while new highs outnumbered new lows on the Nasdaq exchange. There were gains for 15 of the 16 high-ranked companies currently included on the Featured Stocks Page. The market (M criteria) is technically still in a "correction", and historic studies suggest that no new buying efforts should be made during market corrections. An ideal turning point to watch for would be a solid follow-through day of gains greater than +1.5% from at least one of the 3 major averages with higher volume totals and an expansion in leadership (new 52-week highs).
Before the open, the Commerce Department reported second-quarter GDP grew at a 2.5% annualized pace, up from the initial reading of 1.7%. A separate release revealed first time filings for unemployment benefits edged lower by 6,000 to 331,000 in the most recent week.
On the earnings front, Guess Inc (GES +12.85%) rose on its better-than-expected quarterly results and increased full-year guidance. Campbell Soup Corp (CPB -3.09%) dropped as its sales fell short of consensus estimates. Saleforce.com Inc (CRM +2.03%) climbed ahead of its earnings release after the close. Telecom was the best performing sector on the session. Verizon Communications Inc (VZ +2.71%) climbed after Vodafone (VOD +8.13%)said it is in talks to sell its stake in Verizon Wireless to the company. Shares of Exxon Mobil Corp (XOM -1.77%) and Chevron Corp (CVX -1.18%) fell as Energy stocks retreated as crude oil pulled back from a two-year high. .
Treasuries market reversed early losses to close higher. The 10-year note gained 2/32 to yield 2.76%. The 30-year bond rose 15/32 to yield 3.71%.
Stay familiar with companies listed on the CANSLIM.net Featured Stocks Page - a page showing the most action-worthy candidates' latest notes and links to additional resources including detailed analysis with data-packed graphs which are annotated by a Certified expert. The Premium Member Homepage - includes "dynamic archives" to all prior pay reports published. Watch for an announcement via email concerning the next WEBCAST.
PICTURED: The S&P 500 Index rose on Day 2 of a nascent rally attempt. The benchmark index remains below its 50-day moving average line. It is important to watch for a proper follow-through day (FTD) to signal convincingly that a solid rally is at hand before new buying efforts in stocks may be justified under the fact-based system. Patience and discipline remain paramount.
|
 Kenneth J. Gruneisen started out as a licensed stockbroker in August 1987, a couple of months prior to the historic stock market crash that took the Dow Jones Industrial Average down -22.6% in a single day. He has published daily fact-based fundamental and technical analysis on high-ranked stocks online for two decades. Through FACTBASEDINVESTING.COM, Kenneth provides educational articles, news, market commentary, and other information regarding proven investment systems that work in good times and bad.
Comments contained in the body of this report are technical opinions only and are not necessarily those of Gruneisen Growth Corp. The material herein has been obtained from sources believed to be reliable and accurate, however, its accuracy and completeness cannot be guaranteed. Our firm, employees, and customers may effect transactions, including transactions contrary to any recommendation herein, or have positions in the securities mentioned herein or options with respect thereto. Any recommendation contained in this report may not be suitable for all investors and it is not to be deemed an offer or solicitation on our part with respect to the purchase or sale of any securities. |
|
 |
Financial, Tech, Retail and Defensive Groups Rose; Energy Group Fell
Kenneth J. Gruneisen - Passed the CAN SLIM® Master's Exam
Financial shares were a positive influence on the major averages as the Broker/Dealer Index ($XBD +1.04%) outpaced the Bank Index ($BKX +0.22%). The tech sector was led higher by the Biotechnology Index ($BTK +1.07%) and the Semiconductor Index ($SOX +1.19%) while the Internet Index ($IIX +0.70%) and Networking Index ($NWX +0.33%) posted smaller gains. The Retail Index ($RLX +0.37%) had a slightly positive bias, and defensive groups also had a positive slant as the Healthcare Index ($HMO +0.97%) and the Gold & Silver Index ($XAU +0.51%) rose. Weakness in energy-related shares pressured the Oil Services Index ($OSX -1.21%) and the Integrated Oil Index ($XOI -0.94%).
Charts courtesy www.stockcharts.com
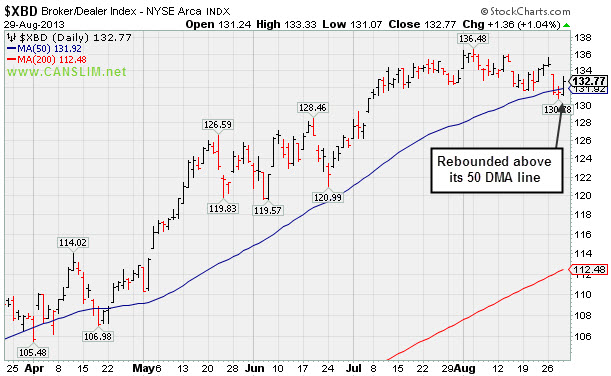
PICTURED: The Broker/Dealer Index ($XBD +1.04%) rebounded above its 50-day moving average (DMA) line today, an encouraging sign of support.
| Oil Services |
$OSX |
258.77 |
-3.18 |
-1.21% |
+17.54% |
| Healthcare |
$HMO |
3,383.86 |
+32.37 |
+0.97% |
+34.59% |
| Integrated Oil |
$XOI |
1,375.04 |
-12.99 |
-0.94% |
+10.73% |
| Semiconductor |
$SOX |
461.82 |
+5.43 |
+1.19% |
+20.25% |
| Networking |
$NWX |
278.50 |
+0.92 |
+0.33% |
+22.93% |
| Internet |
$IIX |
396.86 |
+2.78 |
+0.70% |
+21.36% |
| Broker/Dealer |
$XBD |
132.77 |
+1.36 |
+1.04% |
+40.75% |
| Retail |
$RLX |
814.38 |
+3.02 |
+0.37% |
+24.70% |
| Gold & Silver |
$XAU |
104.83 |
+0.53 |
+0.51% |
-36.70% |
| Bank |
$BKX |
62.59 |
+0.14 |
+0.22% |
+22.06% |
| Biotech |
$BTK |
2,085.82 |
+22.03 |
+1.07% |
+34.83% |
|
|
|
 |
Finished at Best-Ever Close With Gain on Light Volume
Kenneth J. Gruneisen - Passed the CAN SLIM® Master's Exam
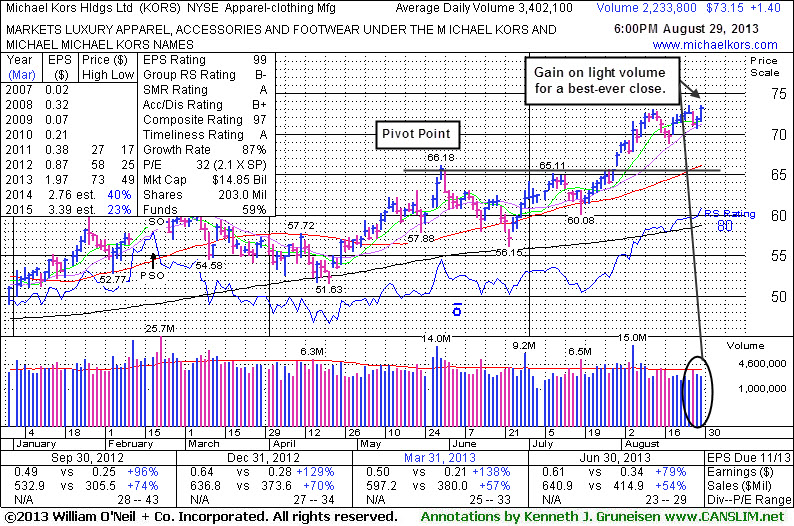
Michael Kors Hldgs Ltd (KORS +$1.40 or +1.95% to $73.15) posted a small gain for a best-ever close. It is extended from any sound base, and the broader market (M criteria) weakness also is an overriding concern that currently argues against new buying efforts in stocks until a new confirmed rally is noted.
Prior highs in the $66 area define support to watch on pullbacks. It held its ground stubbornly since last shown in this FSU section on 8/06/13 with an annotated graph under the headline, " Four Times Average Volume Behind Rally to New Highs", as it hit 52-week and all-time highs with a considerable gain backed by 4 times average. The heavy volume was noted as a clear sign of institutional buying demand.
Its Relative Strength rating is currently 80, right at the 80+ minimum guideline for buy candidates. Fundamentally, it has maintained high ranks due to its strong earnings history (meeting C and A criteria) including earnings +79% on +54% sales for the Jun '13 quarter just reported.
This high-ranked Apparel - Clothing Manufacturing firm has headquarters in Hong Kong. It completed Secondary Offerings on 9/25/12 and 2/20/13, each time while perched near its all-time highs. Prior reports noted - "Such offerings often are a short-term hindrance to upward price progress yet typically result in broader institutional ownership interest."
The number of top-rated funds owning its shares rose from 326 in Mar '12 to 657 in Jun '13, a reassuring sign concerning the I criteria. Its current Up/Down Volume Ratio of 2.0 is an unbiased indication that its shares have been under slight accumulation over the past 50 days.
|
|
|
Color Codes Explained :
Y - Better candidates highlighted by our
staff of experts.
G - Previously featured
in past reports as yellow but may no longer be buyable under the
guidelines.
***Last / Change / Volume data in this table is the closing quote data***
Symbol/Exchange
Company Name
Industry Group |
PRICE |
CHANGE
(%Change) |
Day High |
Volume
(% DAV)
(% 50 day avg vol) |
52 Wk Hi
% From Hi |
Featured
Date |
Price
Featured |
Pivot Featured |
|
Max Buy |
BITA
-
NYSE
Bitauto Hldgs Ltd Ads
INTERNET - Internet Information Providers
|
$14.06
|
+0.07
0.50% |
$14.56
|
227,030
99.71% of 50 DAV
50 DAV is 227,700
|
$18.10
-22.32%
|
8/7/2013
|
$12.01
|
PP = $13.30
|
|
MB = $13.97
|
Most Recent Note - 8/27/2013 7:41:23 PM
G - Down considerably today with above average volume. Still consolidating well above its 50 DMA line and prior highs. Disciplined investors always limit losses if any stock falls more than -7-8% from their purchase price.
>>> The latest Featured Stock Update with an annotated graph appeared on 8/7/2013. Click here.
View all notes |
Alert me of new notes |
CANSLIM.net Company Profile |
SEC |
Zacks Reports |
StockTalk |
News |
Chart |
Request a new note
C
A N
S L
I M


|
CELG
-
NASDAQ
Celgene Corp
DRUGS - Drug Manufacturers - Major
|
$142.58
|
+3.48
2.50% |
$143.00
|
2,441,345
96.26% of 50 DAV
50 DAV is 2,536,100
|
$149.92
-4.89%
|
7/11/2013
|
$133.25
|
PP = $131.92
|
|
MB = $138.52
|
Most Recent Note - 8/27/2013 7:53:51 PM
Y - Down today amid widespread market weakness (M criteria). Still consolidating above prior highs in the $131 area and above its 50 DMA line, defining important chart support.
>>> The latest Featured Stock Update with an annotated graph appeared on 8/21/2013. Click here.
View all notes |
Alert me of new notes |
CANSLIM.net Company Profile |
SEC |
Zacks Reports |
StockTalk |
News |
Chart |
Request a new note
C
A N
S L
I M
|
FLT
-
NYSE
Fleetcor Technologies
DIVERSIFIED SERVICES - Business/Management Services
|
$104.48
|
+1.39
1.35% |
$105.22
|
295,209
42.45% of 50 DAV
50 DAV is 695,500
|
$108.38
-3.60%
|
8/19/2013
|
$99.01
|
PP = $100.97
|
|
MB = $106.02
|
Most Recent Note - 8/26/2013 8:16:45 PM
Y- Rallied with above average volume again today for a new high. Rising from an advanced "3-weeks tight" base, albeit a riskier "late stage" base. Keep in mind the M criteria argues against new buying efforts until a new confirmed rally.
>>> The latest Featured Stock Update with an annotated graph appeared on 8/12/2013. Click here.
View all notes |
Alert me of new notes |
CANSLIM.net Company Profile |
SEC |
Zacks Reports |
StockTalk |
News |
Chart |
Request a new note
C
A N
S L
I M
|
GNRC
-
NYSE
Generac Hldgs Inc
CONSUMER DURABLES - Electronic Equipment
|
$40.88
|
+0.52
1.29% |
$41.54
|
1,438,200
144.62% of 50 DAV
50 DAV is 994,500
|
$44.30
-7.72%
|
7/30/2013
|
$42.60
|
PP = $42.10
|
|
MB = $44.21
|
 Most Recent Note - 8/29/2013 12:37:49 PM
Y - Testing support at its 50 DMA line today. Any further deterioration would raise concerns and trigger a technical sell signal. Stalled after a recent rally from an advanced "3-weeks tight" base as it priced a Secondary Offering. Disciplined investors always limit losses by selling if any stock falls more than -7% from its purchase price.
>>> The latest Featured Stock Update with an annotated graph appeared on 8/22/2013. Click here.
View all notes |
Alert me of new notes |
CANSLIM.net Company Profile |
SEC |
Zacks Reports |
StockTalk |
News |
Chart |
Request a new note
C
A N
S L
I M
|
KORS
-
NYSE
Michael Kors Hldgs Ltd
RETAIL - Apparel Stores
|
$73.15
|
+1.40
1.95% |
$73.52
|
2,234,960
65.69% of 50 DAV
50 DAV is 3,402,100
|
$73.59
-0.60%
|
8/6/2013
|
$69.66
|
PP = $66.28
|
|
MB = $69.59
|
Most Recent Note - 8/29/2013 6:24:31 PM
G - Finished at a new high close today with another gain on below average volume. Prior highs in the $66 area define initial support to watch on pullbacks. See the latest FSU analysis for more details and a new annotated graph.
>>> The latest Featured Stock Update with an annotated graph appeared on 8/29/2013. Click here.
View all notes |
Alert me of new notes |
CANSLIM.net Company Profile |
SEC |
Zacks Reports |
StockTalk |
News |
Chart |
Request a new note
C
A N
S L
I M
|
Symbol/Exchange
Company Name
Industry Group |
PRICE |
CHANGE
(%Change) |
Day High |
Volume
(% DAV)
(% 50 day avg vol) |
52 Wk Hi
% From Hi |
Featured
Date |
Price
Featured |
Pivot Featured |
|
Max Buy |
LOPE
-
NASDAQ
Grand Canyon Education
DIVERSIFIED SERVICES - Education and; Training Services
|
$34.69
|
+0.38
1.11% |
$34.88
|
170,913
39.03% of 50 DAV
50 DAV is 437,900
|
$37.17
-6.67%
|
6/19/2013
|
$31.47
|
PP = $34.17
|
|
MB = $35.88
|
Most Recent Note - 8/28/2013 9:07:30 PM
G - Consolidating near its 50 DMA line, an important support level for chart readers. Recently reported earnings +15% on +19% sales for the Jun '13 quarter, below the +25% minimum earnings guideline (C criteria), raising fundamental concerns.
>>> The latest Featured Stock Update with an annotated graph appeared on 8/14/2013. Click here.
View all notes |
Alert me of new notes |
CANSLIM.net Company Profile |
SEC |
Zacks Reports |
StockTalk |
News |
Chart |
Request a new note
C
A N
S L
I M
|
PCLN
-
NASDAQ
Priceline.Com Inc
INTERNET - Internet Software and Services
|
$940.65
|
+6.04
0.65% |
$946.89
|
331,459
48.29% of 50 DAV
50 DAV is 686,400
|
$994.98
-5.46%
|
7/8/2013
|
$878.28
|
PP = $847.43
|
|
MB = $889.80
|
Most Recent Note - 8/23/2013 6:51:58 PM
G - Posted a 3rd consecutive gain on light volume, consolidating above prior highs, extended from any sound base. Reported earnings +24% on +27% sales revenues for the Jun '13 quarter, just under the +25% minimum earnings guideline (C criteria).
>>> The latest Featured Stock Update with an annotated graph appeared on 8/19/2013. Click here.
View all notes |
Alert me of new notes |
CANSLIM.net Company Profile |
SEC |
Zacks Reports |
StockTalk |
News |
Chart |
Request a new note
C
A N
S L
I M
|
PRAA
-
NASDAQ
Portfolio Recovery Assoc
DIVERSIFIED SERVICES - Business/Management Services
|
$53.59
|
+0.76
1.44% |
$54.43
|
272,785
52.32% of 50 DAV
50 DAV is 521,400
|
$57.57
-6.91%
|
7/31/2013
|
$51.43
|
PP = $54.72
|
|
MB = $57.46
|
Most Recent Note - 8/28/2013 9:06:04 PM
Y - Slump below its old high close ($53.86 on 6/17/13) completely negated the recent technical breakout. See latest FSU analysis for more details and a new annotated graph.
>>> The latest Featured Stock Update with an annotated graph appeared on 8/28/2013. Click here.
View all notes |
Alert me of new notes |
CANSLIM.net Company Profile |
SEC |
Zacks Reports |
StockTalk |
News |
Chart |
Request a new note
C
A N
S L
I M
|
PRLB
-
NYSE
Proto Labs Inc
MANUFACTURING - Small Tools and Accessories
|
$71.80
|
+0.88
1.24% |
$72.91
|
210,560
44.56% of 50 DAV
50 DAV is 472,500
|
$72.25
-0.62%
|
7/29/2013
|
$64.86
|
PP = $67.50
|
|
MB = $70.88
|
Most Recent Note - 8/27/2013 8:10:44 PM
Y - Pulled back on light volume today, consolidating above support at its 50 DMA line. See the latest FSU analysis for more details and a new annotated graph.
>>> The latest Featured Stock Update with an annotated graph appeared on 8/27/2013. Click here.
View all notes |
Alert me of new notes |
CANSLIM.net Company Profile |
SEC |
Zacks Reports |
StockTalk |
News |
Chart |
Request a new note
C
A N
S L
I M
|
QCOR
-
NASDAQ
Questcor Pharmaceuticals
DRUGS - Biotechnology
|
$69.78
|
+1.63
2.39% |
$70.80
|
1,104,269
63.86% of 50 DAV
50 DAV is 1,729,300
|
$74.76
-6.66%
|
7/31/2013
|
$66.46
|
PP = $59.01
|
|
MB = $61.96
|
Most Recent Note - 8/27/2013 8:12:17 PM
G - Down today amid a widely negative market (M criteria). It is extended beyond its "max buy" level.
>>> The latest Featured Stock Update with an annotated graph appeared on 8/26/2013. Click here.
View all notes |
Alert me of new notes |
CANSLIM.net Company Profile |
SEC |
Zacks Reports |
StockTalk |
News |
Chart |
Request a new note
C
A N
S L
I M
|
Symbol/Exchange
Company Name
Industry Group |
PRICE |
CHANGE
(%Change) |
Day High |
Volume
(% DAV)
(% 50 day avg vol) |
52 Wk Hi
% From Hi |
Featured
Date |
Price
Featured |
Pivot Featured |
|
Max Buy |
SFUN
-
NYSE
Soufun Hldgs Ltd Ads A
INTERNET - Internet Information Providers
|
$38.90
|
+1.12
2.96% |
$39.57
|
942,521
164.17% of 50 DAV
50 DAV is 574,100
|
$42.15
-7.71%
|
7/16/2013
|
$29.54
|
PP = $27.90
|
|
MB = $29.30
|
Most Recent Note - 8/29/2013 1:04:00 PM
G - Hovering near its 52-week high, showing resilience amid widespread market (M criteria) weakness. It is extended from a sound base and prior reports cautioned - "Disciplined investors avoid chasing stocks too extended from sound bases."
>>> The latest Featured Stock Update with an annotated graph appeared on 8/8/2013. Click here.
View all notes |
Alert me of new notes |
CANSLIM.net Company Profile |
SEC |
Zacks Reports |
StockTalk |
News |
Chart |
Request a new note
C
A N
S L
I M
|
SSNC
-
NASDAQ
S S & C Technologies
COMPUTER SOFTWARE and SERVICES - Application Software
|
$36.07
|
+0.32
0.90% |
$36.18
|
185,286
43.91% of 50 DAV
50 DAV is 422,000
|
$38.80
-7.04%
|
7/11/2013
|
$35.80
|
PP = $34.54
|
|
MB = $36.27
|
Most Recent Note - 8/23/2013 6:53:34 PM
Y - Recently consolidating above its 50 DMA line and prior highs in the $34 area defining important support. Disciplined investors always limit losses if ever any stock falls more than -7% from their purchase price.
>>> The latest Featured Stock Update with an annotated graph appeared on 8/9/2013. Click here.
View all notes |
Alert me of new notes |
CANSLIM.net Company Profile |
SEC |
Zacks Reports |
StockTalk |
News |
Chart |
Request a new note
C
A N
S L
I M
|
SSYS
-
NASDAQ
Stratasys Ltd
COMPUTER HARDWARE - Computer Peripherals
|
$109.24
|
+4.36
4.16% |
$109.72
|
715,195
83.95% of 50 DAV
50 DAV is 851,900
|
$113.49
-3.74%
|
7/8/2013
|
$91.44
|
PP = $95.00
|
|
MB = $99.75
|
Most Recent Note - 8/29/2013 6:25:52 PM
G - Posted a gain on light volume today for its second-best close. It is extended from its prior base. Prior highs in the $96 area define initial support to watch on pullbacks.
>>> The latest Featured Stock Update with an annotated graph appeared on 8/16/2013. Click here.
View all notes |
Alert me of new notes |
CANSLIM.net Company Profile |
SEC |
Zacks Reports |
StockTalk |
News |
Chart |
Request a new note
C
A N
S L
I M
|
STMP
-
NASDAQ
Stamps.Com Inc
INTERNET - Internet Software and Services
|
$41.87
|
+0.71
1.72% |
$42.11
|
54,471
41.27% of 50 DAV
50 DAV is 132,000
|
$46.47
-9.90%
|
7/31/2013
|
$40.00
|
PP = $42.98
|
|
MB = $45.13
|
Most Recent Note - 8/23/2013 6:44:17 PM
Y - Recently found support at its 50 DMA line. See the latest FSU analysis for more details and a new annotated graph.
>>> The latest Featured Stock Update with an annotated graph appeared on 8/23/2013. Click here.
View all notes |
Alert me of new notes |
CANSLIM.net Company Profile |
SEC |
Zacks Reports |
StockTalk |
News |
Chart |
Request a new note
C
A N
S L
I M
|
VRX
-
NYSE
Valeant Pharmaceuticals
DRUGS - Drug Manufacturers - Other
|
$98.95
|
+1.10
1.12% |
$99.57
|
830,594
52.36% of 50 DAV
50 DAV is 1,586,400
|
$105.40
-6.12%
|
4/30/2013
|
$60.24
|
PP = $76.66
|
|
MB = $80.49
|
Most Recent Note - 8/23/2013 6:48:24 PM
G- Holding its ground -5.6% off its 52-week high. Reported earnings +33% on +34% sales revenues for the Jun '13 quarter, above the +25% minimum earnings guideline (C criteria).
>>> The latest Featured Stock Update with an annotated graph appeared on 8/15/2013. Click here.
View all notes |
Alert me of new notes |
CANSLIM.net Company Profile |
SEC |
Zacks Reports |
StockTalk |
News |
Chart |
Request a new note
C
A N
S L
I M
|
Symbol/Exchange
Company Name
Industry Group |
PRICE |
CHANGE
(%Change) |
Day High |
Volume
(% DAV)
(% 50 day avg vol) |
52 Wk Hi
% From Hi |
Featured
Date |
Price
Featured |
Pivot Featured |
|
Max Buy |
YNDX
-
NASDAQ
Yandex N V Class A
INTERNET - Internet Information Providers
|
$32.01
|
-0.40
-1.23% |
$32.25
|
4,330,866
180.75% of 50 DAV
50 DAV is 2,396,000
|
$34.79
-7.99%
|
7/10/2013
|
$29.29
|
PP = $29.59
|
|
MB = $31.07
|
Most Recent Note - 8/29/2013 1:06:01 PM
G - Enduring mild distributional pressure this week and nearly testing its 50 DMA line today, important near-term support to watch.
>>> The latest Featured Stock Update with an annotated graph appeared on 8/20/2013. Click here.
View all notes |
Alert me of new notes |
CANSLIM.net Company Profile |
SEC |
Zacks Reports |
StockTalk |
News |
Chart |
Request a new note
C
A N
S L
I M
|
|
|
|
THESE ARE NOT BUY RECOMMENDATIONS!
Comments contained in the body of this report are technical
opinions only. The material herein has been obtained
from sources believed to be reliable and accurate, however,
its accuracy and completeness cannot be guaranteed.
This site is not an investment advisor, hence it does
not endorse or recommend any securities or other investments.
Any recommendation contained in this report may not
be suitable for all investors and it is not to be deemed
an offer or solicitation on our part with respect to
the purchase or sale of any securities. All trademarks,
service marks and trade names appearing in this report
are the property of their respective owners, and are
likewise used for identification purposes only.
This report is a service available
only to active Paid Premium Members.
You may opt-out of receiving report notifications
at any time. Questions or comments may be submitted
by writing to Premium Membership Services 665 S.E. 10 Street, Suite 201 Deerfield Beach, FL 33441-5634 or by calling 1-800-965-8307
or 954-785-1121.
|
|
|

