You are not logged in.
This means you
CAN ONLY VIEW reports that were published prior to Tuesday, April 8, 2025.
You
MUST UPGRADE YOUR MEMBERSHIP if you want to see any current reports.
AFTER MARKET UPDATE - WEDNESDAY, AUGUST 28TH, 2013
Previous After Market Report Next After Market Report >>>
|
|
|
|
DOW |
+48.38 |
14,824.51 |
+0.33% |
|
Volume |
598,779,590 |
-12% |
|
Volume |
1,332,902,700 |
-16% |
|
NASDAQ |
+14.83 |
3,593.35 |
+0.41% |
|
Advancers |
1,672 |
53% |
|
Advancers |
1,454 |
56% |
|
S&P 500 |
+4.48 |
1,634.96 |
+0.27% |
|
Decliners |
1,329 |
43% |
|
Decliners |
1,057 |
41% |
|
Russell 2000 |
+3.01 |
1,016.50 |
+0.30% |
|
52 Wk Highs |
26 |
|
|
52 Wk Highs |
33 |
|
|
S&P 600 |
+1.43 |
576.36 |
+0.25% |
|
52 Wk Lows |
71 |
|
|
52 Wk Lows |
26 |
|
|
 |
Major Averages Posted Small Gains With Lighter Volume Totals
Kenneth J. Gruneisen - Passed the CAN SLIM® Master's Exam
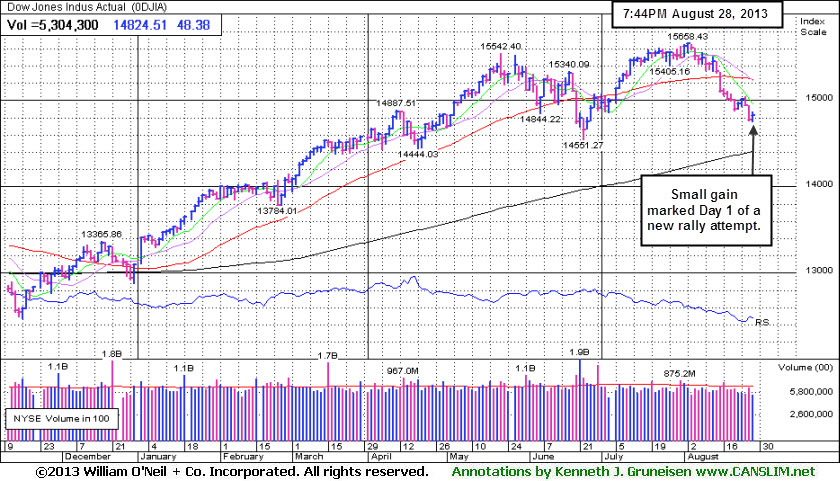
Stocks rebounded timidly on Wednesday as the S&P 500 Index rose from an eight-week low and gained over 4 points to 1,634. The volume totals were reported lighter than the prior session totals on the NYSE and on the Nasdaq exchange. Breadth was slightly positive as advancers led decliners by an 8-7 margin on the NYSE and by a 7-5 margin on the Nasdaq exchange. There were 11 high-ranked companies from the CANSLIM.net Leaders List that made new 52-week highs and appeared on the CANSLIM.net BreakOuts Page, up from a total of 3 stocks on the prior session. The list of stocks hitting new 52-week lows outnumbered new 52-week highs on the NYSE and on the Nasdaq exchange. There were gains for 9 of the 16 high-ranked companies currently included on the Featured Stocks Page. The market (M criteria) clearly signaled that the major averages are in a "correction" based on recent technical damage. Individual holdings should be closely monitored for any worrisome technical sell signals. This is precisely how the fact-based system helps investors avoid serious setbacks and raise cash levels during market downdrafts. Historic studies suggest that no new buying efforts should be made during market corrections.
The major averages snapped a two-day slump thanks to a rally in energy stocks amid ongoing fears of U.S. military action against Syria. The advance came despite weak housing data as pending home sales dropped in July by the most this year amid rising mortgage rates. As a result of geopolitical tension, WTI crude rose to its highest level since May 2011 which helped Exxon Mobil Corp (XOM +2.33%) rise. But Joy Global (JOY -4.4%) fell as lower coal demand led to a drop in mining equipment orders.
Overall, most sectors finished higher. Energy was the best performing group, but Health Care and Technology also helped pace the advance as Gilead Sciences (GILD +3.1%) and Apple Inc (AAPL +0.5%) posted gains. Consumer Staples and Telecommunications lagged behind as Procter & Gamble (PG -1.44%) and Verizon Communications Inc (VZ -0.7%) declined.
Earnings results also garnered attention. TiVo Inc (TIVO +5.56%) rallied after posting record revenue and profit, Profit tallies remain in focus with reports after the closing bell from Williams-Sonoma and Guess.
In fixed-income, Treasuries broke a four-day advance. The 10-year note was down 17/32 to yield 2.77% and the 30-year bond lost 30/32 to yield 3.74%.
Stay familiar with companies listed on the CANSLIM.net Featured Stocks Page - a page showing the most action-worthy candidates' latest notes and links to additional resources including detailed analysis with data-packed graphs which are annotated by a Certified expert. The Premium Member Homepage - includes "dynamic archives" to all prior pay reports published. Watch for an announcement via email concerning the next WEBCAST.
PICTURED: The Dow Jones Industrial Average posted a gain with the other indices which can be considered Day 1 of a new rally effort. It is important to watch for a proper follow-through day (FTD) to signal convincingly that a solid rally is at hand before new buying efforts in stocks may be justified under the fact-based system. Patience and discipline remain paramount.
|
 Kenneth J. Gruneisen started out as a licensed stockbroker in August 1987, a couple of months prior to the historic stock market crash that took the Dow Jones Industrial Average down -22.6% in a single day. He has published daily fact-based fundamental and technical analysis on high-ranked stocks online for two decades. Through FACTBASEDINVESTING.COM, Kenneth provides educational articles, news, market commentary, and other information regarding proven investment systems that work in good times and bad.
Comments contained in the body of this report are technical opinions only and are not necessarily those of Gruneisen Growth Corp. The material herein has been obtained from sources believed to be reliable and accurate, however, its accuracy and completeness cannot be guaranteed. Our firm, employees, and customers may effect transactions, including transactions contrary to any recommendation herein, or have positions in the securities mentioned herein or options with respect thereto. Any recommendation contained in this report may not be suitable for all investors and it is not to be deemed an offer or solicitation on our part with respect to the purchase or sale of any securities. |
|
 |
Energy, Tech and Retail Indices Posted Gains
Kenneth J. Gruneisen - Passed the CAN SLIM® Master's Exam
Energy-related shares rallied and the Oil Services Index ($OSX +1.33%) and Integrated Oil Index ($XOI +1.80%) posted solid gains. The Biotechnology Index ($BTK +1.10%) and the Semiconductor Index ($SOX +1.15%) led the tech sector higher while the Networking Index ($NWX +0.22%) and the Internet Index ($IIX +0.42%) posted smaller gains. The Retail Index ($RLX +0.45%) posted a modest gain. Financial shares were little changed as the Broker/Dealer Index ($XBD -0.05%) finished flat and the Bank Index ($BKX +0.13%) inched higher. The Healthcare Index ($HMO +0.05%) ended virtually unchanged and the Gold & Silver Index ($XAU -2.80%) was a standout decliner lagging the mostly positive market.
Charts courtesy www.stockcharts.com
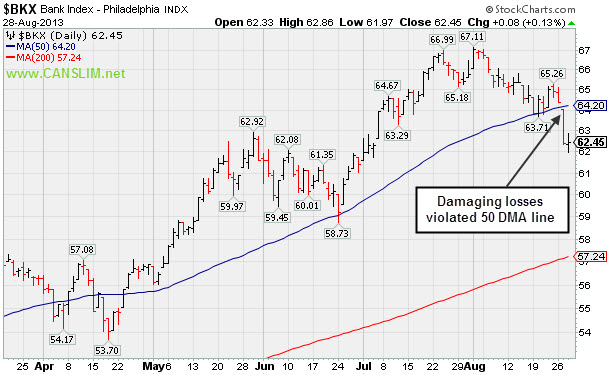
PICTURED: The Bank Index ($BKX +0.13%) recently violated its 50-day moving average (DMA) line with damaging losses. Further deterioration in the influential financial groups would bode badly for the major averages outlook since financial stocks have been recognized as reliable "leading indicators".
| Oil Services |
$OSX |
261.95 |
+3.45 |
+1.33% |
+18.98% |
| Healthcare |
$HMO |
3,351.49 |
+1.64 |
+0.05% |
+33.30% |
| Integrated Oil |
$XOI |
1,388.02 |
+24.58 |
+1.80% |
+11.77% |
| Semiconductor |
$SOX |
456.39 |
+5.17 |
+1.15% |
+18.83% |
| Networking |
$NWX |
277.58 |
+0.60 |
+0.22% |
+22.53% |
| Internet |
$IIX |
394.09 |
+1.66 |
+0.42% |
+20.52% |
| Broker/Dealer |
$XBD |
131.41 |
-0.06 |
-0.05% |
+39.31% |
| Retail |
$RLX |
811.36 |
+3.66 |
+0.45% |
+24.24% |
| Gold & Silver |
$XAU |
104.30 |
-3.01 |
-2.80% |
-37.02% |
| Bank |
$BKX |
62.45 |
+0.08 |
+0.13% |
+21.78% |
| Biotech |
$BTK |
2,063.79 |
+22.36 |
+1.10% |
+33.40% |
|
|
|
 |
Slump Into Prior Base During Market Correction Negated Breakout
Kenneth J. Gruneisen - Passed the CAN SLIM® Master's Exam
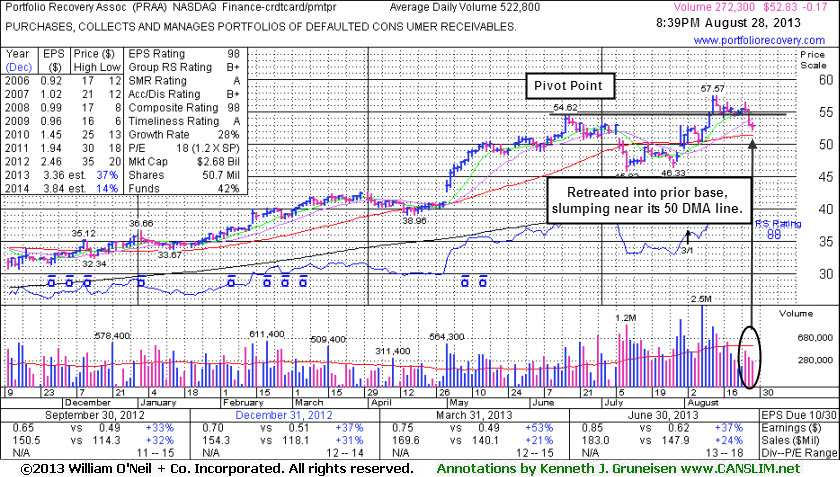
Portfolio Recovery Assoc (PRAA -$0.17 or -0.32% to $52.83) has seen light volume behind losses while it slumped below its old high close ($53.86 on 6/17/13) previously noted. The deterioration has completely negated the recent technical breakout, raising concerns. Disciplined investors always limit losses if any stock falls more than -7% from their purchase price.
PRAA triggered a technical buy signal with volume driven gains since last shown in this FSU section with an annotated graph on 8/02/13 under the headline, "Facing Some Resistance While Rallying With Volume". Keep in mind that the broader market's (M criteria) ongoing correction (noted regularly in the Market Commentary) is an overriding concern arguing against any new buying efforts because as 3 out of 4 stocks typically move in the same direction as the major averages.
Do not be confused by 3:1 share split impacting prices on 8/02/13. Strong earnings +37% on +24% sales revenues for the Jun '13 quarter continued its track record of strong earnings increases above the +25% minimum guideline (C criteria). This high-ranked leader from the Finance - Credit Card/Payment Processing industry group has strong fundamentals and has earned great ranks. The number of top-rated funds owning its shares rose from 308 in Jun '12 to 424 in Jun '13, a reassuring sign concerning the I criteria.
 |
|
|
Color Codes Explained :
Y - Better candidates highlighted by our
staff of experts.
G - Previously featured
in past reports as yellow but may no longer be buyable under the
guidelines.
***Last / Change / Volume data in this table is the closing quote data***
Symbol/Exchange
Company Name
Industry Group |
PRICE |
CHANGE
(%Change) |
Day High |
Volume
(% DAV)
(% 50 day avg vol) |
52 Wk Hi
% From Hi |
Featured
Date |
Price
Featured |
Pivot Featured |
|
Max Buy |
BITA
-
NYSE
Bitauto Hldgs Ltd Ads
INTERNET - Internet Information Providers
|
$13.99
|
-0.26
-1.82% |
$14.38
|
186,851
82.53% of 50 DAV
50 DAV is 226,400
|
$18.10
-22.71%
|
8/7/2013
|
$12.01
|
PP = $13.30
|
|
MB = $13.97
|
Most Recent Note - 8/27/2013 7:41:23 PM
G - Down considerably today with above average volume. Still consolidating well above its 50 DMA line and prior highs. Disciplined investors always limit losses if any stock falls more than -7-8% from their purchase price.
>>> The latest Featured Stock Update with an annotated graph appeared on 8/7/2013. Click here.
View all notes |
Alert me of new notes |
CANSLIM.net Company Profile |
SEC |
Zacks Reports |
StockTalk |
News |
Chart |
Request a new note
C
A N
S L
I M


|
CELG
-
NASDAQ
Celgene Corp
DRUGS - Drug Manufacturers - Major
|
$139.10
|
+2.14
1.56% |
$139.82
|
2,653,459
105.31% of 50 DAV
50 DAV is 2,519,600
|
$149.92
-7.21%
|
7/11/2013
|
$133.25
|
PP = $131.92
|
|
MB = $138.52
|
Most Recent Note - 8/27/2013 7:53:51 PM
Y - Down today amid widespread market weakness (M criteria). Still consolidating above prior highs in the $131 area and above its 50 DMA line, defining important chart support.
>>> The latest Featured Stock Update with an annotated graph appeared on 8/21/2013. Click here.
View all notes |
Alert me of new notes |
CANSLIM.net Company Profile |
SEC |
Zacks Reports |
StockTalk |
News |
Chart |
Request a new note
C
A N
S L
I M
|
FLT
-
NYSE
Fleetcor Technologies
DIVERSIFIED SERVICES - Business/Management Services
|
$103.09
|
-0.08
-0.08% |
$103.87
|
643,827
92.36% of 50 DAV
50 DAV is 697,100
|
$108.38
-4.88%
|
8/19/2013
|
$99.01
|
PP = $100.97
|
|
MB = $106.02
|
Most Recent Note - 8/26/2013 8:16:45 PM
Y- Rallied with above average volume again today for a new high. Rising from an advanced "3-weeks tight" base, albeit a riskier "late stage" base. Keep in mind the M criteria argues against new buying efforts until a new confirmed rally.
>>> The latest Featured Stock Update with an annotated graph appeared on 8/12/2013. Click here.
View all notes |
Alert me of new notes |
CANSLIM.net Company Profile |
SEC |
Zacks Reports |
StockTalk |
News |
Chart |
Request a new note
C
A N
S L
I M
|
GNRC
-
NYSE
Generac Hldgs Inc
CONSUMER DURABLES - Electronic Equipment
|
$40.36
|
-0.74
-1.80% |
$41.20
|
690,240
68.27% of 50 DAV
50 DAV is 1,011,000
|
$44.30
-8.89%
|
7/30/2013
|
$42.60
|
PP = $42.10
|
|
MB = $44.21
|
Most Recent Note - 8/22/2013 5:46:33 PM
Y - Holding its ground stubbornly after it recently rallied from an advanced "3-weeks tight" base and priced a Secondary Offering. Disciplined investors always limit losses by selling if any stock falls more than -7% from its purchase price. See the latest FSU analysis for more details and a new annotated graph.
>>> The latest Featured Stock Update with an annotated graph appeared on 8/22/2013. Click here.
View all notes |
Alert me of new notes |
CANSLIM.net Company Profile |
SEC |
Zacks Reports |
StockTalk |
News |
Chart |
Request a new note
C
A N
S L
I M
|
KORS
-
NYSE
Michael Kors Hldgs Ltd
RETAIL - Apparel Stores
|
$71.75
|
+0.52
0.73% |
$72.19
|
2,476,058
72.95% of 50 DAV
50 DAV is 3,394,200
|
$73.59
-2.50%
|
8/6/2013
|
$69.66
|
PP = $66.28
|
|
MB = $69.59
|
Most Recent Note - 8/23/2013 6:50:01 PM
G - Finished at a new high close today with a 4th consecutive gain on below average volume. Prior highs in the $66 area define initial support to watch on pullbacks.
>>> The latest Featured Stock Update with an annotated graph appeared on 8/6/2013. Click here.
View all notes |
Alert me of new notes |
CANSLIM.net Company Profile |
SEC |
Zacks Reports |
StockTalk |
News |
Chart |
Request a new note
C
A N
S L
I M
|
Symbol/Exchange
Company Name
Industry Group |
PRICE |
CHANGE
(%Change) |
Day High |
Volume
(% DAV)
(% 50 day avg vol) |
52 Wk Hi
% From Hi |
Featured
Date |
Price
Featured |
Pivot Featured |
|
Max Buy |
LOPE
-
NASDAQ
Grand Canyon Education
DIVERSIFIED SERVICES - Education and; Training Services
|
$34.31
|
-0.20
-0.58% |
$34.66
|
154,467
34.85% of 50 DAV
50 DAV is 443,200
|
$37.17
-7.69%
|
6/19/2013
|
$31.47
|
PP = $34.17
|
|
MB = $35.88
|
 Most Recent Note - 8/28/2013 9:07:30 PM
G - Consolidating near its 50 DMA line, an important support level for chart readers. Recently reported earnings +15% on +19% sales for the Jun '13 quarter, below the +25% minimum earnings guideline (C criteria), raising fundamental concerns.
>>> The latest Featured Stock Update with an annotated graph appeared on 8/14/2013. Click here.
View all notes |
Alert me of new notes |
CANSLIM.net Company Profile |
SEC |
Zacks Reports |
StockTalk |
News |
Chart |
Request a new note
C
A N
S L
I M
|
PCLN
-
NASDAQ
Priceline.Com Inc
INTERNET - Internet Software and Services
|
$934.61
|
-0.99
-0.11% |
$939.13
|
307,010
44.31% of 50 DAV
50 DAV is 692,900
|
$994.98
-6.07%
|
7/8/2013
|
$878.28
|
PP = $847.43
|
|
MB = $889.80
|
Most Recent Note - 8/23/2013 6:51:58 PM
G - Posted a 3rd consecutive gain on light volume, consolidating above prior highs, extended from any sound base. Reported earnings +24% on +27% sales revenues for the Jun '13 quarter, just under the +25% minimum earnings guideline (C criteria).
>>> The latest Featured Stock Update with an annotated graph appeared on 8/19/2013. Click here.
View all notes |
Alert me of new notes |
CANSLIM.net Company Profile |
SEC |
Zacks Reports |
StockTalk |
News |
Chart |
Request a new note
C
A N
S L
I M
|
PRAA
-
NASDAQ
Portfolio Recovery Assoc
DIVERSIFIED SERVICES - Business/Management Services
|
$52.83
|
-0.17
-0.32% |
$53.38
|
272,709
52.16% of 50 DAV
50 DAV is 522,800
|
$57.57
-8.23%
|
7/31/2013
|
$51.43
|
PP = $54.72
|
|
MB = $57.46
|
Most Recent Note - 8/28/2013 9:06:04 PM
Y - Slump below its old high close ($53.86 on 6/17/13) completely negated the recent technical breakout. See latest FSU analysis for more details and a new annotated graph.
>>> The latest Featured Stock Update with an annotated graph appeared on 8/28/2013. Click here.
View all notes |
Alert me of new notes |
CANSLIM.net Company Profile |
SEC |
Zacks Reports |
StockTalk |
News |
Chart |
Request a new note
C
A N
S L
I M
|
PRLB
-
NYSE
Proto Labs Inc
MANUFACTURING - Small Tools and Accessories
|
$70.92
|
+1.34
1.93% |
$71.60
|
182,866
37.10% of 50 DAV
50 DAV is 492,900
|
$72.25
-1.84%
|
7/29/2013
|
$64.86
|
PP = $67.50
|
|
MB = $70.88
|
Most Recent Note - 8/27/2013 8:10:44 PM
Y - Pulled back on light volume today, consolidating above support at its 50 DMA line. See the latest FSU analysis for more details and a new annotated graph.
>>> The latest Featured Stock Update with an annotated graph appeared on 8/27/2013. Click here.
View all notes |
Alert me of new notes |
CANSLIM.net Company Profile |
SEC |
Zacks Reports |
StockTalk |
News |
Chart |
Request a new note
C
A N
S L
I M
|
QCOR
-
NASDAQ
Questcor Pharmaceuticals
DRUGS - Biotechnology
|
$68.15
|
-0.34
-0.50% |
$69.49
|
1,187,471
68.90% of 50 DAV
50 DAV is 1,723,400
|
$74.76
-8.84%
|
7/31/2013
|
$66.46
|
PP = $59.01
|
|
MB = $61.96
|
Most Recent Note - 8/27/2013 8:12:17 PM
G - Down today amid a widely negative market (M criteria). It is extended beyond its "max buy" level.
>>> The latest Featured Stock Update with an annotated graph appeared on 8/26/2013. Click here.
View all notes |
Alert me of new notes |
CANSLIM.net Company Profile |
SEC |
Zacks Reports |
StockTalk |
News |
Chart |
Request a new note
C
A N
S L
I M
|
Symbol/Exchange
Company Name
Industry Group |
PRICE |
CHANGE
(%Change) |
Day High |
Volume
(% DAV)
(% 50 day avg vol) |
52 Wk Hi
% From Hi |
Featured
Date |
Price
Featured |
Pivot Featured |
|
Max Buy |
SFUN
-
NYSE
Soufun Hldgs Ltd Ads A
INTERNET - Internet Information Providers
|
$37.78
|
+0.95
2.58% |
$38.15
|
324,674
56.90% of 50 DAV
50 DAV is 570,600
|
$42.15
-10.37%
|
7/16/2013
|
$29.54
|
PP = $27.90
|
|
MB = $29.30
|
Most Recent Note - 8/27/2013 8:13:48 PM
G - Down considerably today amid widespread market (M criteria) weakness. Prior reports cautioned - "Disciplined investors avoid chasing stocks too extended from sound bases."
>>> The latest Featured Stock Update with an annotated graph appeared on 8/8/2013. Click here.
View all notes |
Alert me of new notes |
CANSLIM.net Company Profile |
SEC |
Zacks Reports |
StockTalk |
News |
Chart |
Request a new note
C
A N
S L
I M
|
SSNC
-
NASDAQ
S S & C Technologies
COMPUTER SOFTWARE and SERVICES - Application Software
|
$35.75
|
+0.16
0.45% |
$35.98
|
189,795
44.79% of 50 DAV
50 DAV is 423,700
|
$38.80
-7.86%
|
7/11/2013
|
$35.80
|
PP = $34.54
|
|
MB = $36.27
|
Most Recent Note - 8/23/2013 6:53:34 PM
Y - Recently consolidating above its 50 DMA line and prior highs in the $34 area defining important support. Disciplined investors always limit losses if ever any stock falls more than -7% from their purchase price.
>>> The latest Featured Stock Update with an annotated graph appeared on 8/9/2013. Click here.
View all notes |
Alert me of new notes |
CANSLIM.net Company Profile |
SEC |
Zacks Reports |
StockTalk |
News |
Chart |
Request a new note
C
A N
S L
I M
|
SSYS
-
NASDAQ
Stratasys Ltd
COMPUTER HARDWARE - Computer Peripherals
|
$104.88
|
+0.64
0.61% |
$108.11
|
702,665
82.85% of 50 DAV
50 DAV is 848,100
|
$113.49
-7.59%
|
7/8/2013
|
$91.44
|
PP = $95.00
|
|
MB = $99.75
|
Most Recent Note - 8/27/2013 8:15:20 PM
G - Down considerably today on higher volume amid widespread market weakness. It is extended from its prior base. Prior highs in the $96 area define initial support to watch on pullbacks.
>>> The latest Featured Stock Update with an annotated graph appeared on 8/16/2013. Click here.
View all notes |
Alert me of new notes |
CANSLIM.net Company Profile |
SEC |
Zacks Reports |
StockTalk |
News |
Chart |
Request a new note
C
A N
S L
I M
|
STMP
-
NASDAQ
Stamps.Com Inc
INTERNET - Internet Software and Services
|
$41.16
|
+0.51
1.25% |
$41.40
|
60,029
44.97% of 50 DAV
50 DAV is 133,500
|
$46.47
-11.43%
|
7/31/2013
|
$40.00
|
PP = $42.98
|
|
MB = $45.13
|
Most Recent Note - 8/23/2013 6:44:17 PM
Y - Recently found support at its 50 DMA line. See the latest FSU analysis for more details and a new annotated graph.
>>> The latest Featured Stock Update with an annotated graph appeared on 8/23/2013. Click here.
View all notes |
Alert me of new notes |
CANSLIM.net Company Profile |
SEC |
Zacks Reports |
StockTalk |
News |
Chart |
Request a new note
C
A N
S L
I M
|
VRX
-
NYSE
Valeant Pharmaceuticals
DRUGS - Drug Manufacturers - Other
|
$97.85
|
+2.05
2.14% |
$98.04
|
798,809
49.33% of 50 DAV
50 DAV is 1,619,300
|
$105.40
-7.16%
|
4/30/2013
|
$60.24
|
PP = $76.66
|
|
MB = $80.49
|
Most Recent Note - 8/23/2013 6:48:24 PM
G- Holding its ground -5.6% off its 52-week high. Reported earnings +33% on +34% sales revenues for the Jun '13 quarter, above the +25% minimum earnings guideline (C criteria).
>>> The latest Featured Stock Update with an annotated graph appeared on 8/15/2013. Click here.
View all notes |
Alert me of new notes |
CANSLIM.net Company Profile |
SEC |
Zacks Reports |
StockTalk |
News |
Chart |
Request a new note
C
A N
S L
I M
|
Symbol/Exchange
Company Name
Industry Group |
PRICE |
CHANGE
(%Change) |
Day High |
Volume
(% DAV)
(% 50 day avg vol) |
52 Wk Hi
% From Hi |
Featured
Date |
Price
Featured |
Pivot Featured |
|
Max Buy |
YNDX
-
NASDAQ
Yandex N V Class A
INTERNET - Internet Information Providers
|
$32.41
|
+0.27
0.84% |
$32.62
|
1,340,845
55.89% of 50 DAV
50 DAV is 2,398,900
|
$34.79
-6.84%
|
7/10/2013
|
$29.29
|
PP = $29.59
|
|
MB = $31.07
|
Most Recent Note - 8/26/2013 8:14:57 PM
G - Volume totals have been cooling while consolidating neat its 52-week high in a tight range. Its 50 DMA line defines important near-term support to watch.
>>> The latest Featured Stock Update with an annotated graph appeared on 8/20/2013. Click here.
View all notes |
Alert me of new notes |
CANSLIM.net Company Profile |
SEC |
Zacks Reports |
StockTalk |
News |
Chart |
Request a new note
C
A N
S L
I M
|
|
|
|
THESE ARE NOT BUY RECOMMENDATIONS!
Comments contained in the body of this report are technical
opinions only. The material herein has been obtained
from sources believed to be reliable and accurate, however,
its accuracy and completeness cannot be guaranteed.
This site is not an investment advisor, hence it does
not endorse or recommend any securities or other investments.
Any recommendation contained in this report may not
be suitable for all investors and it is not to be deemed
an offer or solicitation on our part with respect to
the purchase or sale of any securities. All trademarks,
service marks and trade names appearing in this report
are the property of their respective owners, and are
likewise used for identification purposes only.
This report is a service available
only to active Paid Premium Members.
You may opt-out of receiving report notifications
at any time. Questions or comments may be submitted
by writing to Premium Membership Services 665 S.E. 10 Street, Suite 201 Deerfield Beach, FL 33441-5634 or by calling 1-800-965-8307
or 954-785-1121.
|
|
|

