You are not logged in.
This means you
CAN ONLY VIEW reports that were published prior to Tuesday, April 8, 2025.
You
MUST UPGRADE YOUR MEMBERSHIP if you want to see any current reports.
AFTER MARKET UPDATE - FRIDAY, AUGUST 30TH, 2013
Previous After Market Report Next After Market Report >>>
|
|
|
|
DOW |
-30.64 |
14,810.31 |
-0.21% |
|
Volume |
768,151,410 |
+40% |
|
Volume |
1,239,144,900 |
-4% |
|
NASDAQ |
-30.43 |
3,589.87 |
-0.84% |
|
Advancers |
874 |
28% |
|
Advancers |
600 |
23% |
|
S&P 500 |
-5.20 |
1,632.97 |
-0.32% |
|
Decliners |
2,111 |
68% |
|
Decliners |
1,903 |
73% |
|
Russell 2000 |
-16.04 |
1,010.90 |
-1.56% |
|
52 Wk Highs |
18 |
|
|
52 Wk Highs |
37 |
|
|
S&P 600 |
-8.70 |
572.82 |
-1.50% |
|
52 Wk Lows |
46 |
|
|
52 Wk Lows |
28 |
|
|
 |
Major Averages in Ongoing "Correction" Lost Ground in August
Kenneth J. Gruneisen - Passed the CAN SLIM® Master's Exam
The Dow Jones Industrial Average ended August down -4.5%. The S&P 500 lost -3.1% for the month while the Nasdaq Composite index fell -1.0%. The major averages lost ground on Friday while the volume totals were reported mixed, higher than the prior session total on the NYSE and lower on the Nasdaq exchange. Breadth was negative as decliners led advancers by a 5-2 margin on the NYSE and by a 3-1 margin on the Nasdaq exchange. There were 15 high-ranked companies from the CANSLIM.net Leaders List that made new 52-week highs and appeared on the CANSLIM.net BreakOuts Page, up a notch from a total of 14 stocks on the prior session. The list of stocks hitting new 52-week lows outnumbered new 52-week highs on the NYSE while new highs outnumbered new lows on the Nasdaq exchange. There were gains for only 3 of the 16 high-ranked companies currently included on the Featured Stocks Page. The market (M criteria) is technically still in a "correction", and historic studies suggest that no new buying efforts should be made during market corrections. An ideal turning point to watch for would be a solid follow-through day of gains greater than +1.5% from at least one of the 3 major averages with higher volume totals and an expansion in leadership (new 52-week highs).
The major averages declined Friday while heading into the Labor Day weekend after Secretary of State John Kerry made the case for limited U.S. military action against Syria. Investors digested the latest economic data. Before the open, reports showed personal income and spending both rose +0.1% in July, less than the consensus projections for an +0.3% increase. Separate releases revealed consumer confidence declined from a six year high while Midwest manufacturing activity expanded in August. Treasuries were mostly lower with the 10-year note down 4/32 to yield 2.78%.
Eight of 10 sectors were down on the session. Technology was the worst performing group. Apple Inc (AAPL -0.91%) as the company began its iPhone trade-in program. Financials and industrials also underperformed as The ADT Corp (ADT -2.16%) and The Hartford Financial Services Group, Inc (HIG -1.1%) lost ground. Saleforce.com Inc (CRM +12.55%) was the best performing stock in the S&P 500, rallying on its increased full year forecast.
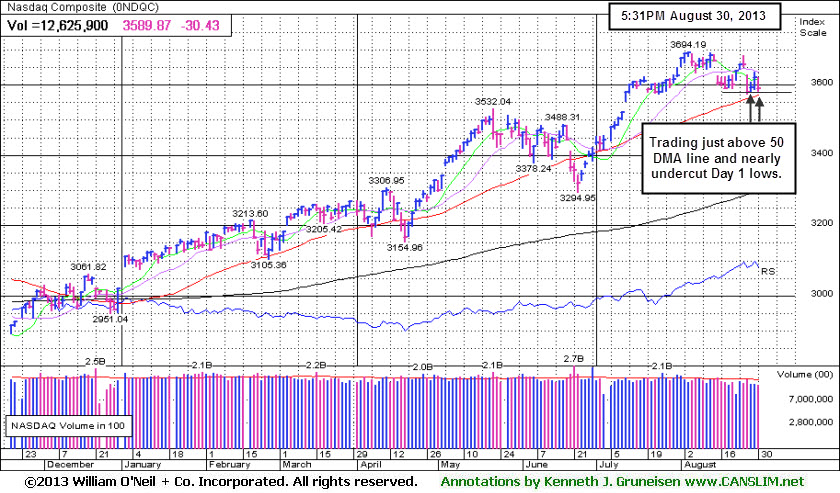
The Dow ended August down -4.5%. The S&P 500 lost -3.1% for the month while the Nasdaq Composite index fell -1.0%. The Dow and S&P remain below their respective 50-day moving average lines, and rebounds above those short term averages would be another encouraging sign to watch for before one can truly consider those indices in "healthy" shape chart-wise.
Stay familiar with companies listed on the CANSLIM.net Featured Stocks Page - a page showing the most action-worthy candidates' latest notes and links to additional resources including detailed analysis with data-packed graphs which are annotated by a Certified expert. The Premium Member Homepage - includes "dynamic archives" to all prior pay reports published. Watch for an announcement via email concerning the next WEBCAST.
PICTURED: The Nasdaq Composite Index fell on Day 3 of a nascent rally attempt. Losses threatened to undercut the indices' Day 1 lows which would technically end the brief rally attempt and signal that the correction was worsening. It is the only one of the 3 major averages which is still above its 50-day moving average (DMA) line. It is important to watch for a proper follow-through day (FTD) to signal convincingly that a solid rally is at hand before new buying efforts in stocks may be justified under the fact-based system. Patience and discipline remain paramount.
|
 Kenneth J. Gruneisen started out as a licensed stockbroker in August 1987, a couple of months prior to the historic stock market crash that took the Dow Jones Industrial Average down -22.6% in a single day. He has published daily fact-based fundamental and technical analysis on high-ranked stocks online for two decades. Through FACTBASEDINVESTING.COM, Kenneth provides educational articles, news, market commentary, and other information regarding proven investment systems that work in good times and bad.
Comments contained in the body of this report are technical opinions only and are not necessarily those of Gruneisen Growth Corp. The material herein has been obtained from sources believed to be reliable and accurate, however, its accuracy and completeness cannot be guaranteed. Our firm, employees, and customers may effect transactions, including transactions contrary to any recommendation herein, or have positions in the securities mentioned herein or options with respect thereto. Any recommendation contained in this report may not be suitable for all investors and it is not to be deemed an offer or solicitation on our part with respect to the purchase or sale of any securities. |
|
 |
Widespread Losses Dragged All Groups Lower Again
Kenneth J. Gruneisen - Passed the CAN SLIM® Master's Exam
Losses for the Retail Index ($RLX -0.65%) and financial groups weighed on the major averages on Friday's session while the Broker/Dealer Index ($XBD -1.31%) outpaced the Bank Index ($BKX -0.61%) to the downside. The tech sector saw unanimous losses from the Biotechnology Index ($BTK -1.38%), Internet Index ($IIX -1.12%), Networking Index ($NWX -1.02%), and the Semiconductor Index ($SOX -0.89%). Defensive groups were weak as the Healthcare Index ($HMO -1.11%) and the Gold & Silver Index ($XAU -1.33%) fell. Energy relates shares also sputtered as the Oil Services Index ($OSX -0.81%) and Integrated Oil Index ($XOI -0.49%) sank, rounding out a widely negative session.
Charts courtesy www.stockcharts.com
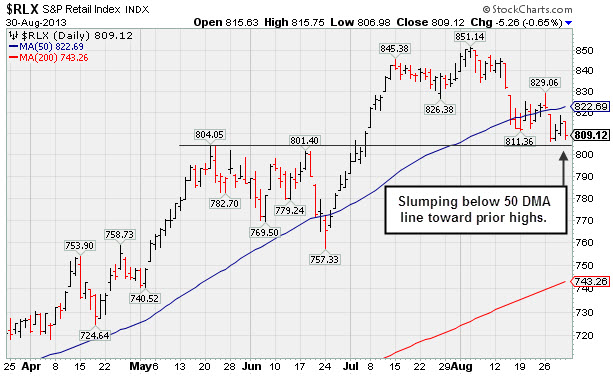
PICTURED: The Retail Index ($RLX -0.65%) is slumping below its 50-day moving average (DMA) line toward prior highs.
| Oil Services |
$OSX |
256.67 |
-2.10 |
-0.81% |
+16.58% |
| Healthcare |
$HMO |
3,346.43 |
-37.43 |
-1.11% |
+33.10% |
| Integrated Oil |
$XOI |
1,368.33 |
-6.71 |
-0.49% |
+10.19% |
| Semiconductor |
$SOX |
457.70 |
-4.12 |
-0.89% |
+19.17% |
| Networking |
$NWX |
275.67 |
-2.84 |
-1.02% |
+21.68% |
| Internet |
$IIX |
392.43 |
-4.43 |
-1.12% |
+20.01% |
| Broker/Dealer |
$XBD |
131.03 |
-1.74 |
-1.31% |
+38.90% |
| Retail |
$RLX |
809.12 |
-5.26 |
-0.65% |
+23.90% |
| Gold & Silver |
$XAU |
103.44 |
-1.39 |
-1.33% |
-37.54% |
| Bank |
$BKX |
62.21 |
-0.38 |
-0.61% |
+21.31% |
| Biotech |
$BTK |
2,057.01 |
-28.81 |
-1.38% |
+32.97% |
|
|
|
 |
Volume-Driven Gain For a New High Close
Kenneth J. Gruneisen - Passed the CAN SLIM® Master's Exam
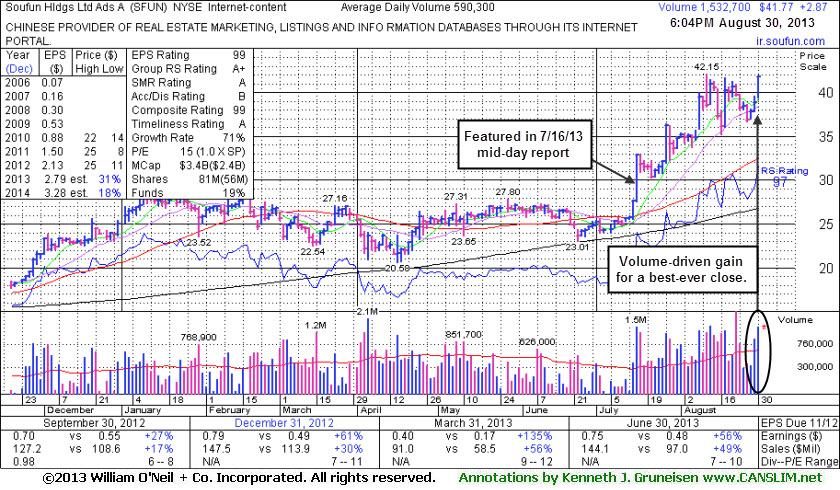
Soufun Hldgs Ltd Ads (SFUN +$2.87 or +7.38% to $41.77) rallied to a best-ever close with another big volume-driven gain. It has shown strength and resilience amid widespread market (M criteria) weakness. It is extended from a sound base and prior reports cautioned - "Disciplined investors avoid chasing stocks too extended from sound bases." It was last shown in this FSU section on 8/08/13 with an annotated graph under the headline, "Finished at New High After Another Volume-Driven Gain", as it gapped up. It has traded up as much as +42.7% since it first appeared highlighted in yellow in the 7/16/13 the mid-day report (read here) while it spiked to new 52-week and all-time highs and quickly rallied above its "max buy" level.
Fundamentals remain strong as it reported +56% earnings on +49% sales revenues for the Jun '13 quarter versus the year ago period, solidly satisfying the C criteria. The number of top-rated funds owning its shares rose from 76 in Sep '12 to 96 in Jun '13, a reassuring sign concerning the I criteria. Its small supply (S criteria) of only 33.3 million shares in the public float can contribute to greater price volatility in the event of institutional buying or selling.
|
|
|
Color Codes Explained :
Y - Better candidates highlighted by our
staff of experts.
G - Previously featured
in past reports as yellow but may no longer be buyable under the
guidelines.
***Last / Change / Volume data in this table is the closing quote data***
Symbol/Exchange
Company Name
Industry Group |
PRICE |
CHANGE
(%Change) |
Day High |
Volume
(% DAV)
(% 50 day avg vol) |
52 Wk Hi
% From Hi |
Featured
Date |
Price
Featured |
Pivot Featured |
|
Max Buy |
BITA
-
NYSE
Bitauto Hldgs Ltd Ads
INTERNET - Internet Information Providers
|
$13.72
|
-0.34
-2.42% |
$14.16
|
138,503
60.01% of 50 DAV
50 DAV is 230,800
|
$18.10
-24.20%
|
8/7/2013
|
$12.01
|
PP = $13.30
|
|
MB = $13.97
|
Most Recent Note - 8/27/2013 7:41:23 PM
G - Down considerably today with above average volume. Still consolidating well above its 50 DMA line and prior highs. Disciplined investors always limit losses if any stock falls more than -7-8% from their purchase price.
>>> The latest Featured Stock Update with an annotated graph appeared on 8/7/2013. Click here.
View all notes |
Alert me of new notes |
CANSLIM.net Company Profile |
SEC |
Zacks Reports |
StockTalk |
News |
Chart |
Request a new note
C
A N
S L
I M


|
CELG
-
NASDAQ
Celgene Corp
DRUGS - Drug Manufacturers - Major
|
$139.98
|
-2.60
-1.82% |
$143.00
|
2,162,317
84.83% of 50 DAV
50 DAV is 2,549,000
|
$149.92
-6.63%
|
7/11/2013
|
$133.25
|
PP = $131.92
|
|
MB = $138.52
|
Most Recent Note - 8/27/2013 7:53:51 PM
Y - Down today amid widespread market weakness (M criteria). Still consolidating above prior highs in the $131 area and above its 50 DMA line, defining important chart support.
>>> The latest Featured Stock Update with an annotated graph appeared on 8/21/2013. Click here.
View all notes |
Alert me of new notes |
CANSLIM.net Company Profile |
SEC |
Zacks Reports |
StockTalk |
News |
Chart |
Request a new note
C
A N
S L
I M
|
FLT
-
NYSE
Fleetcor Technologies
DIVERSIFIED SERVICES - Business/Management Services
|
$103.11
|
-1.37
-1.31% |
$106.18
|
324,955
47.14% of 50 DAV
50 DAV is 689,300
|
$108.38
-4.86%
|
8/19/2013
|
$99.01
|
PP = $100.97
|
|
MB = $106.02
|
Most Recent Note - 8/26/2013 8:16:45 PM
Y- Rallied with above average volume again today for a new high. Rising from an advanced "3-weeks tight" base, albeit a riskier "late stage" base. Keep in mind the M criteria argues against new buying efforts until a new confirmed rally.
>>> The latest Featured Stock Update with an annotated graph appeared on 8/12/2013. Click here.
View all notes |
Alert me of new notes |
CANSLIM.net Company Profile |
SEC |
Zacks Reports |
StockTalk |
News |
Chart |
Request a new note
C
A N
S L
I M
|
GNRC
-
NYSE
Generac Hldgs Inc
CONSUMER DURABLES - Electronic Equipment
|
$39.59
|
-1.29
-3.16% |
$40.91
|
789,126
78.33% of 50 DAV
50 DAV is 1,007,500
|
$44.30
-10.63%
|
7/30/2013
|
$42.60
|
PP = $42.10
|
|
MB = $44.21
|
Most Recent Note - 8/29/2013 12:37:49 PM
Y - Testing support at its 50 DMA line today. Any further deterioration would raise concerns and trigger a technical sell signal. Stalled after a recent rally from an advanced "3-weeks tight" base as it priced a Secondary Offering. Disciplined investors always limit losses by selling if any stock falls more than -7% from its purchase price.
>>> The latest Featured Stock Update with an annotated graph appeared on 8/22/2013. Click here.
View all notes |
Alert me of new notes |
CANSLIM.net Company Profile |
SEC |
Zacks Reports |
StockTalk |
News |
Chart |
Request a new note
C
A N
S L
I M
|
KORS
-
NYSE
Michael Kors Hldgs Ltd
RETAIL - Apparel Stores
|
$74.09
|
+0.94
1.29% |
$74.28
|
11,765,452
346.28% of 50 DAV
50 DAV is 3,397,700
|
$73.59
0.68%
|
8/6/2013
|
$69.66
|
PP = $66.28
|
|
MB = $69.59
|
Most Recent Note - 8/29/2013 6:24:31 PM
G - Finished at a new high close today with another gain on below average volume. Prior highs in the $66 area define initial support to watch on pullbacks. See the latest FSU analysis for more details and a new annotated graph.
>>> The latest Featured Stock Update with an annotated graph appeared on 8/29/2013. Click here.
View all notes |
Alert me of new notes |
CANSLIM.net Company Profile |
SEC |
Zacks Reports |
StockTalk |
News |
Chart |
Request a new note
C
A N
S L
I M
|
Symbol/Exchange
Company Name
Industry Group |
PRICE |
CHANGE
(%Change) |
Day High |
Volume
(% DAV)
(% 50 day avg vol) |
52 Wk Hi
% From Hi |
Featured
Date |
Price
Featured |
Pivot Featured |
|
Max Buy |
LOPE
-
NASDAQ
Grand Canyon Education
DIVERSIFIED SERVICES - Education and; Training Services
|
$34.51
|
-0.18
-0.52% |
$34.82
|
277,640
63.40% of 50 DAV
50 DAV is 437,900
|
$37.17
-7.16%
|
6/19/2013
|
$31.47
|
PP = $34.17
|
|
MB = $35.88
|
Most Recent Note - 8/28/2013 9:07:30 PM
G - Consolidating near its 50 DMA line, an important support level for chart readers. Recently reported earnings +15% on +19% sales for the Jun '13 quarter, below the +25% minimum earnings guideline (C criteria), raising fundamental concerns.
>>> The latest Featured Stock Update with an annotated graph appeared on 8/14/2013. Click here.
View all notes |
Alert me of new notes |
CANSLIM.net Company Profile |
SEC |
Zacks Reports |
StockTalk |
News |
Chart |
Request a new note
C
A N
S L
I M
|
PCLN
-
NASDAQ
Priceline.Com Inc
INTERNET - Internet Software and Services
|
$938.53
|
-2.12
-0.23% |
$946.27
|
381,713
56.04% of 50 DAV
50 DAV is 681,200
|
$994.98
-5.67%
|
7/8/2013
|
$878.28
|
PP = $847.43
|
|
MB = $889.80
|
 Most Recent Note - 8/30/2013 4:48:13 PM
G - Consolidating above prior highs with volume totals cooling, extended from any sound base. Reported earnings +24% on +27% sales revenues for the Jun '13 quarter, just under the +25% minimum earnings guideline (C criteria).
>>> The latest Featured Stock Update with an annotated graph appeared on 8/19/2013. Click here.
View all notes |
Alert me of new notes |
CANSLIM.net Company Profile |
SEC |
Zacks Reports |
StockTalk |
News |
Chart |
Request a new note
C
A N
S L
I M
|
PRAA
-
NASDAQ
Portfolio Recovery Assoc
DIVERSIFIED SERVICES - Business/Management Services
|
$53.04
|
-0.55
-1.03% |
$53.54
|
364,066
69.61% of 50 DAV
50 DAV is 523,000
|
$57.57
-7.87%
|
7/31/2013
|
$51.43
|
PP = $54.72
|
|
MB = $57.46
|
Most Recent Note - 8/28/2013 9:06:04 PM
Y - Slump below its old high close ($53.86 on 6/17/13) completely negated the recent technical breakout. See latest FSU analysis for more details and a new annotated graph.
>>> The latest Featured Stock Update with an annotated graph appeared on 8/28/2013. Click here.
View all notes |
Alert me of new notes |
CANSLIM.net Company Profile |
SEC |
Zacks Reports |
StockTalk |
News |
Chart |
Request a new note
C
A N
S L
I M
|
PRLB
-
NYSE
Proto Labs Inc
MANUFACTURING - Small Tools and Accessories
|
$71.04
|
-0.76
-1.06% |
$72.41
|
170,604
36.94% of 50 DAV
50 DAV is 461,800
|
$72.25
-1.67%
|
7/29/2013
|
$64.86
|
PP = $67.50
|
|
MB = $70.88
|
Most Recent Note - 8/27/2013 8:10:44 PM
Y - Pulled back on light volume today, consolidating above support at its 50 DMA line. See the latest FSU analysis for more details and a new annotated graph.
>>> The latest Featured Stock Update with an annotated graph appeared on 8/27/2013. Click here.
View all notes |
Alert me of new notes |
CANSLIM.net Company Profile |
SEC |
Zacks Reports |
StockTalk |
News |
Chart |
Request a new note
C
A N
S L
I M
|
QCOR
-
NASDAQ
Questcor Pharmaceuticals
DRUGS - Biotechnology
|
$66.68
|
-3.10
-4.44% |
$70.48
|
1,568,656
91.01% of 50 DAV
50 DAV is 1,723,600
|
$74.76
-10.81%
|
7/31/2013
|
$66.46
|
PP = $59.01
|
|
MB = $61.96
|
Most Recent Note - 8/30/2013 7:17:20 PM
G - Encountered mild distributional pressure with a loss on higher (near average) volume amid a widely negative market (M criteria). It is extended beyond its "max buy" level.
>>> The latest Featured Stock Update with an annotated graph appeared on 8/26/2013. Click here.
View all notes |
Alert me of new notes |
CANSLIM.net Company Profile |
SEC |
Zacks Reports |
StockTalk |
News |
Chart |
Request a new note
C
A N
S L
I M
|
Symbol/Exchange
Company Name
Industry Group |
PRICE |
CHANGE
(%Change) |
Day High |
Volume
(% DAV)
(% 50 day avg vol) |
52 Wk Hi
% From Hi |
Featured
Date |
Price
Featured |
Pivot Featured |
|
Max Buy |
SFUN
-
NYSE
Soufun Hldgs Ltd Ads A
INTERNET - Internet Information Providers
|
$41.77
|
+2.87
7.38% |
$41.92
|
1,532,743
259.65% of 50 DAV
50 DAV is 590,300
|
$42.15
-0.90%
|
7/16/2013
|
$29.54
|
PP = $27.90
|
|
MB = $29.30
|
Most Recent Note - 8/30/2013 7:15:55 PM
G - Volume-driven gain for a new high close today, showing strength and recent resilience amid widespread market (M criteria) weakness. It is extended from a sound base. See the latest FSU analysis for more details and a new annotated graph.
>>> The latest Featured Stock Update with an annotated graph appeared on 8/30/2013. Click here.
View all notes |
Alert me of new notes |
CANSLIM.net Company Profile |
SEC |
Zacks Reports |
StockTalk |
News |
Chart |
Request a new note
C
A N
S L
I M
|
SSNC
-
NASDAQ
S S & C Technologies
COMPUTER SOFTWARE and SERVICES - Application Software
|
$35.39
|
-0.68
-1.89% |
$36.12
|
231,128
54.99% of 50 DAV
50 DAV is 420,300
|
$38.80
-8.79%
|
7/11/2013
|
$35.80
|
PP = $34.54
|
|
MB = $36.27
|
Most Recent Note - 8/30/2013 6:59:28 PM
Y - Still quietly consolidating above its 50 DMA line and prior highs in the $34 area defining important support with volume totals cooling. Disciplined investors always limit losses if ever any stock falls more than -7% from their purchase price.
>>> The latest Featured Stock Update with an annotated graph appeared on 8/9/2013. Click here.
View all notes |
Alert me of new notes |
CANSLIM.net Company Profile |
SEC |
Zacks Reports |
StockTalk |
News |
Chart |
Request a new note
C
A N
S L
I M
|
SSYS
-
NASDAQ
Stratasys Ltd
COMPUTER HARDWARE - Computer Peripherals
|
$107.27
|
-1.97
-1.80% |
$110.00
|
419,040
48.88% of 50 DAV
50 DAV is 857,200
|
$113.49
-5.48%
|
7/8/2013
|
$91.44
|
PP = $95.00
|
|
MB = $99.75
|
Most Recent Note - 8/29/2013 6:25:52 PM
G - Posted a gain on light volume today for its second-best close. It is extended from its prior base. Prior highs in the $96 area define initial support to watch on pullbacks.
>>> The latest Featured Stock Update with an annotated graph appeared on 8/16/2013. Click here.
View all notes |
Alert me of new notes |
CANSLIM.net Company Profile |
SEC |
Zacks Reports |
StockTalk |
News |
Chart |
Request a new note
C
A N
S L
I M
|
STMP
-
NASDAQ
Stamps.Com Inc
INTERNET - Internet Software and Services
|
$41.88
|
+0.01
0.02% |
$42.42
|
133,376
102.36% of 50 DAV
50 DAV is 130,300
|
$46.47
-9.88%
|
7/31/2013
|
$40.00
|
PP = $42.98
|
|
MB = $45.13
|
Most Recent Note - 8/30/2013 7:03:50 PM
Y - Posted a 3rd consecutive gain today against a mostly negative market backdrop (M criteria). Recently found encouraging support at its 50 DMA line.
>>> The latest Featured Stock Update with an annotated graph appeared on 8/23/2013. Click here.
View all notes |
Alert me of new notes |
CANSLIM.net Company Profile |
SEC |
Zacks Reports |
StockTalk |
News |
Chart |
Request a new note
C
A N
S L
I M
|
VRX
-
NYSE
Valeant Pharmaceuticals
DRUGS - Drug Manufacturers - Other
|
$98.34
|
-0.61
-0.62% |
$99.60
|
1,030,068
71.73% of 50 DAV
50 DAV is 1,436,100
|
$105.40
-6.70%
|
4/30/2013
|
$60.24
|
PP = $76.66
|
|
MB = $80.49
|
Most Recent Note - 8/30/2013 7:05:51 PM
G- Holding its ground -6.7% off its 52-week high and recent insider buying while trading near its highs is an encouraging sign. Reported earnings +33% on +34% sales revenues for the Jun '13 quarter, above the +25% minimum earnings guideline (C criteria).
>>> The latest Featured Stock Update with an annotated graph appeared on 8/15/2013. Click here.
View all notes |
Alert me of new notes |
CANSLIM.net Company Profile |
SEC |
Zacks Reports |
StockTalk |
News |
Chart |
Request a new note
C
A N
S L
I M
|
Symbol/Exchange
Company Name
Industry Group |
PRICE |
CHANGE
(%Change) |
Day High |
Volume
(% DAV)
(% 50 day avg vol) |
52 Wk Hi
% From Hi |
Featured
Date |
Price
Featured |
Pivot Featured |
|
Max Buy |
YNDX
-
NASDAQ
Yandex N V Class A
INTERNET - Internet Information Providers
|
$32.00
|
-0.01
-0.03% |
$32.71
|
1,630,550
66.31% of 50 DAV
50 DAV is 2,458,800
|
$34.79
-8.02%
|
7/10/2013
|
$29.29
|
PP = $29.59
|
|
MB = $31.07
|
Most Recent Note - 8/29/2013 1:06:01 PM
G - Enduring mild distributional pressure this week and nearly testing its 50 DMA line today, important near-term support to watch.
>>> The latest Featured Stock Update with an annotated graph appeared on 8/20/2013. Click here.
View all notes |
Alert me of new notes |
CANSLIM.net Company Profile |
SEC |
Zacks Reports |
StockTalk |
News |
Chart |
Request a new note
C
A N
S L
I M
|
|
|
|
THESE ARE NOT BUY RECOMMENDATIONS!
Comments contained in the body of this report are technical
opinions only. The material herein has been obtained
from sources believed to be reliable and accurate, however,
its accuracy and completeness cannot be guaranteed.
This site is not an investment advisor, hence it does
not endorse or recommend any securities or other investments.
Any recommendation contained in this report may not
be suitable for all investors and it is not to be deemed
an offer or solicitation on our part with respect to
the purchase or sale of any securities. All trademarks,
service marks and trade names appearing in this report
are the property of their respective owners, and are
likewise used for identification purposes only.
This report is a service available
only to active Paid Premium Members.
You may opt-out of receiving report notifications
at any time. Questions or comments may be submitted
by writing to Premium Membership Services 665 S.E. 10 Street, Suite 201 Deerfield Beach, FL 33441-5634 or by calling 1-800-965-8307
or 954-785-1121.
|
|
|

