You are not logged in.
This means you
CAN ONLY VIEW reports that were published prior to Monday, March 24, 2025.
You
MUST UPGRADE YOUR MEMBERSHIP if you want to see any current reports.
AFTER MARKET UPDATE - WEDNESDAY, JULY 27TH, 2022
Previous After Market Report Next After Market Report >>>
|
|
|
|
DOW |
+436.05 |
32,197.59 |
+1.37% |
|
Volume |
891,565,459 |
+9% |
|
Volume |
4,521,179,200 |
+6% |
|
NASDAQ |
+469.85 |
12,032.42 |
+4.06% |
|
Advancers |
2,560 |
83% |
|
Advancers |
3,048 |
74% |
|
S&P 500 |
+102.56 |
4,023.61 |
+2.62% |
|
Decliners |
516 |
17% |
|
Decliners |
1,097 |
26% |
|
Russell 2000 |
+43.09 |
1,848.33 |
+2.39% |
|
52 Wk Highs |
33 |
|
|
52 Wk Highs |
58 |
|
|
S&P 600 |
+27.67 |
1,214.22 |
+2.33% |
|
52 Wk Lows |
45 |
|
|
52 Wk Lows |
144 |
|
|
 |
Major Indices Rose After Another Rate Hike by Fed
Kenneth J. Gruneisen - Passed the CAN SLIM® Master's Exam
The S&P 500 soared 2.6%, on course for its strongest monthly performance since October (+6.3%). The Dow added 436 points, while the Nasdaq Composite rallied 4.1% in its best session since April 2020. The volume totals reported were higher than the prior session on the NYSE and on the Nasdaq exchange, showing an increase in institutional buying demand. Breadth was positive as advancers led decliners by almost a 5-1 margin on the NYSE and nearly 3-1 on the Nasdaq exchange. Leadership improved as there were 18 high-ranked companies from the Leaders List that hit new 52-week highs and were listed on the BreakOuts Page, up from the total of 10 on the prior session. New 52-week lows totals still outnumbered new 52-week highs on the NYSE and on the Nasdaq exchange. The market uptrend has been under some pressure (M criteria). Any sustainable rally requires a healthy crop of leading stocks hitting new highs, so the improvement in leadership was a reassuring sign.
Chart courtesy of www.stockcharts.com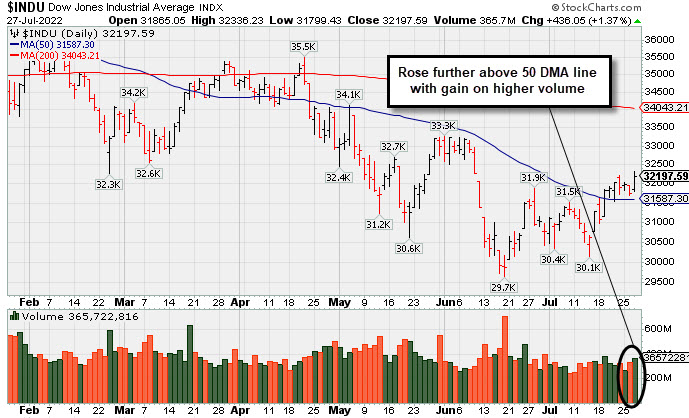 PICTURED: The Nasdaq Composite Index pulled back toward its 50-day moving average (DMA) line with higher volume (closing volume not shown on graph). It remains well below its 200 DMA line.
U.S. stocks finished firmly higher on Wednesday as Wall Street assessed “better-than-feared” big tech earnings and digested the Federal Reserve’s (Fed) policy decision. As widely anticipated, officials delivered a second straight 75-basis point (0.75%) rate hike as they remain focused on quelling the highest inflation in over four decades. Fed Chair Jerome Powell’s post-meeting press conference helped buoy sentiment, as market participants latched on to the possibility that the magnitude of rate increases could eventually slow. The Fed chief stated that committee members would remain data-dependent, determining moves on a meeting-by-meeting basis. Treasuries were mixed, with the yield on the 10-year note unchanged at 2.80%, while a gauge of the U.S. dollar eased 0.7%.
In earnings, Google parent Alphabet Inc. (GOOGL +7.66%) rose amid resilience in its core search advertising business. Meanwhile, Tech titan Microsoft Corp. (MSFT +6.69%) rose as a strong revenue outlook offset a slowdown in its cloud computing segment. Chipmaker Texas Instruments Inc. (TXN 6.65%) rose following optimistic guidance. Elsewhere, Chipotle Mexican Grill Inc. (CMG +14.70%) gapped up as a bottom line beat offered evidence that price increases were well-received by its customers.
On the data front, preliminary June readings showed durable goods orders unexpectedly surged 1.9%, while capital goods orders rose 0.5%. Separately, pending home sales fell a worse-than-forecasted 8.6%, the steepest drop since April 2020. In commodities, West Texas Intermediate crude increased 3.5% to $98.28/barrel following the sharpest weekly drawdown in domestic crude stockpiles since May.
|
 Kenneth J. Gruneisen started out as a licensed stockbroker in August 1987, a couple of months prior to the historic stock market crash that took the Dow Jones Industrial Average down -22.6% in a single day. He has published daily fact-based fundamental and technical analysis on high-ranked stocks online for two decades. Through FACTBASEDINVESTING.COM, Kenneth provides educational articles, news, market commentary, and other information regarding proven investment systems that work in good times and bad.
Comments contained in the body of this report are technical opinions only and are not necessarily those of Gruneisen Growth Corp. The material herein has been obtained from sources believed to be reliable and accurate, however, its accuracy and completeness cannot be guaranteed. Our firm, employees, and customers may effect transactions, including transactions contrary to any recommendation herein, or have positions in the securities mentioned herein or options with respect thereto. Any recommendation contained in this report may not be suitable for all investors and it is not to be deemed an offer or solicitation on our part with respect to the purchase or sale of any securities. |
|
 |
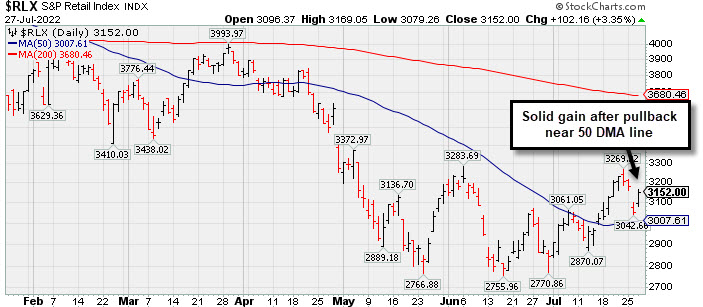
Retail, Financial, Tech, and Commodity-Linked Groups Rose
Kenneth J. Gruneisen - Passed the CAN SLIM® Master's Exam
The Retail Index ($RLX +3.35%) and financials had a positive influence on the major averages as the Broker/Dealer Index ($XBD +2.45%) outpaced the Bank Index ($BKX +1.98%). The Semiconductor Index ($SOX +4.75%) and Networking Index ($NWX +3.10%) led the tech sector higher while the Biotech Index ($BTK +1.28%) posted a smaller gain. Commodity-linked groups had a positive bias as the Oil Services Index ($OSX +4.03%) and Integrated Oil Index ($XOI +2.63%) both outpaced the Gold & Silver Index ($XAU +1.89%). PICTURED: The Retail Index ($RLX +3.35%) posted a solid gain after pulling back toward its 50-day moving average (DMA) line.
| Oil Services |
$OSX |
66.00 |
+2.56 |
+4.03% |
+25.18% |
| Integrated Oil |
$XOI |
1,533.64 |
+39.25 |
+2.63% |
+30.17% |
| Semiconductor |
$SOX |
2,911.00 |
+132.04 |
+4.75% |
-26.23% |
| Networking |
$NWX |
748.49 |
+22.49 |
+3.10% |
-22.92% |
| Broker/Dealer |
$XBD |
416.77 |
+9.95 |
+2.45% |
-14.40% |
| Retail |
$RLX |
3,152.00 |
+102.16 |
+3.35% |
-25.42% |
| Gold & Silver |
$XAU |
104.19 |
+1.94 |
+1.89% |
-21.34% |
| Bank |
$BKX |
107.30 |
+2.08 |
+1.98% |
-18.84% |
| Biotech |
$BTK |
4,776.04 |
+60.52 |
+1.28% |
-13.45% |
|
|
|
 |
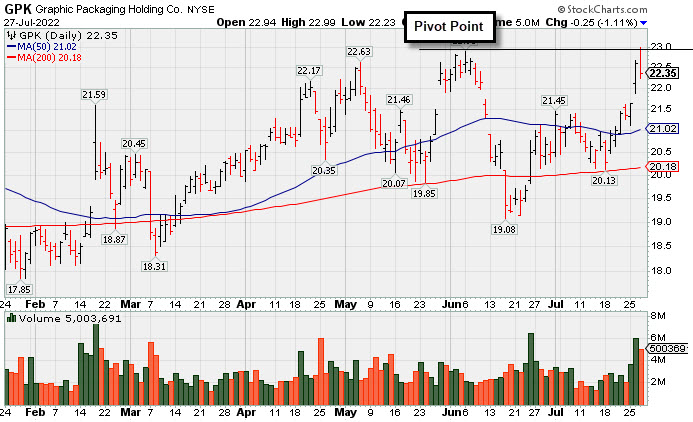
Negative Reversal After Matching 52-Week High
Kenneth J. Gruneisen - Passed the CAN SLIM® Master's Exam
Graphic Packaging Hldg (GPK -$0.25 or -1.11% to $22.35) matched its 52-week high today but reversed into the red and closed in the bottom third of its intra-day range, action indicative of distributional pressure. It was highlighted in yellow in the 7/26/22 mid-day report with pivot point cited based on its 6/06/22 high plus 10 cents (read here). Subsequent gains above the pivot point backed by at least +40% above average volume are needed to trigger a proper technical buy signal.
GPK has a 97 Earnings Per Share Rating. Earnings rose +108% on +36% sales revenues for the Jun '22 quarter versus the year ago period. Three of the past 4 quarterly comparisons were above the +25% minimum earnings guideline (C criteria). Its annual earnings history has been good since a downturn in FY '16 and '17, meeting the fact-based investment system's fundamental guidelines (A criteria).
The Paper & Paper Products group is ranked 61st on the 197 Industry Groups list and it has a B+ Group Relative Strength Rating (L criteria). The number of top-rated funds owning its shares rose from 596 in Sep '21 to 632 in Jun '22, a reassuring sign concerning the I criteria. Its current Up/Down Volume Ration of 1.3 is an unbiased indication its shares have been under accumulation over the past 50 days.
|
|
|
Color Codes Explained :
Y - Better candidates highlighted by our
staff of experts.
G - Previously featured
in past reports as yellow but may no longer be buyable under the
guidelines.
***Last / Change / Volume data in this table is the closing quote data***
Symbol/Exchange
Company Name
Industry Group |
PRICE |
CHANGE
(%Change) |
Day High |
Volume
(% DAV)
(% 50 day avg vol) |
52 Wk Hi
% From Hi |
Featured
Date |
Price
Featured |
Pivot Featured |
|
Max Buy |
 LLY
-
NYSE
LLY
-
NYSE
Eli Lilly & Co
Medical-Diversified
|
$328.94
|
-2.62
-0.79% |
$330.87
|
1,632,100
56.75% of 50 DAV
50 DAV is 2,876,000
|
$335.33
-1.91%
|
5/16/2022
|
$302.46
|
PP = $314.10
|
|
MB = $329.81
|
 Most Recent Note - 7/27/2022 5:00:14 PM
Y - Pulled back with light volume today and its color code is changed to yellow after dipping below its "max buy" level. Its 50 DMA line ($313.47) defines near-term support to watch.
>>> FEATURED STOCK ARTICLE : Hovering Near "Max Buy" Level With Volume Totals Cooling - 7/22/2022 |
View all notes |
Set NEW NOTE alert |
Company Profile |
SEC
News |
Chart |
Request a new note
C
A
S
I |
IMXI
-
NASDAQ
International Money Exp
Financial Svcs-Specialty
|
$23.64
|
+0.67
2.92% |
$23.73
|
766,617
185.62% of 50 DAV
50 DAV is 413,000
|
$23.52
0.51%
|
7/1/2022
|
$21.27
|
PP = $21.38
|
|
MB = $22.45
|
Most Recent Note - 7/27/2022 4:58:48 PM
G - Posted a gain today with above average volume hitting a new 52-week high. Color code is changed to green after rising above its "max buy" level. Its 50 DMA line ($20.75) defines important near-term support to watch on pullbacks. Due to report Jun '22 quarterly results on 8/03/22.
>>> FEATURED STOCK ARTICLE : Stalled Since Clearing Double Bottom Base - 7/15/2022 |
View all notes |
Set NEW NOTE alert |
Company Profile |
SEC
News |
Chart |
Request a new note
C
A
S
I |
HRMY
-
NASDAQ
Harmony Biosciences Hldg
Medical-Biomed/Biotech
|
$51.26
|
+0.66
1.30% |
$51.83
|
316,682
67.96% of 50 DAV
50 DAV is 466,000
|
$57.13
-10.27%
|
7/6/2022
|
$54.12
|
PP = $52.85
|
|
MB = $55.49
|
Most Recent Note - 7/27/2022 4:55:58 PM
Y - Posted a quiet gain today following 4 consecutive losses which raised concerns. The next important near-term support to watch is its 50 DMA line ($47.75).
>>> FEATURED STOCK ARTICLE : Harmony Has Been Encountering Distributional Pressure - 7/18/2022 |
View all notes |
Set NEW NOTE alert |
Company Profile |
SEC
News |
Chart |
Request a new note
C
A
S
I |
CI
-
NYSE
Cigna Corp
Medical-Managed Care
|
$274.73
|
-0.10
-0.04% |
$276.60
|
1,115,090
57.27% of 50 DAV
50 DAV is 1,947,000
|
$282.33
-2.69%
|
7/7/2022
|
$276.55
|
PP = $273.68
|
|
MB = $287.36
|
Most Recent Note - 7/27/2022 4:48:53 PM
Y - Pulled back with lighter volume today. Tested support at its 50 DMA line ($264) twice following a recent technical breakout. More damaging losses would raise greater concerns.
>>> FEATURED STOCK ARTICLE : Pulled Back and Tested Support at 50-Day Moving Average - 7/19/2022 |
View all notes |
Set NEW NOTE alert |
Company Profile |
SEC
News |
Chart |
Request a new note
C
A
S
I |
AN
-
NYSE
Autonation Inc
SPECIALTY RETAIL - Auto Dealerships
|
$112.61
|
+1.56
1.40% |
$112.74
|
1,037,610
138.35% of 50 DAV
50 DAV is 750,000
|
$133.48
-15.64%
|
7/20/2022
|
$122.03
|
PP = $126.49
|
|
MB = $132.81
|
Most Recent Note - 7/27/2022 4:48:05 PM
G - Posted a gain today with +38% above average volume but remains below its 200 DMA line ($114.76). A prompt rebound above the 50 DMA line ($115.61) is needed for its outlook to improve. Subsequent volume-driven gains above the pivot point may trigger a technical buy signal. Reported Jun '22 quarterly earnings +34% on -2% sales revenues versus the year ago period. Faces some resistance due to overhead supply up to the $133 level.
>>> FEATURED STOCK ARTICLE : Autonation Earnings Due While Perched Near Pivot Point - 7/20/2022 |
View all notes |
Set NEW NOTE alert |
Company Profile |
SEC
News |
Chart |
Request a new note
C
A
S
I |
Symbol/Exchange
Company Name
Industry Group |
PRICE |
CHANGE
(%Change) |
Day High |
Volume
(% DAV)
(% 50 day avg vol) |
52 Wk Hi
% From Hi |
Featured
Date |
Price
Featured |
Pivot Featured |
|
Max Buy |
ESQ
-
NASDAQ
Esquire Financial Hldgs
Finance-Commercial Loans
|
$37.40
|
+0.23
0.62% |
$37.98
|
37,885
62.11% of 50 DAV
50 DAV is 61,000
|
$39.09
-4.32%
|
7/26/2022
|
$37.74
|
PP = $39.19
|
|
MB = $41.15
|
Most Recent Note - 7/27/2022 4:52:00 PM
Y - Posted a 4th consecutive gain today. It was highlighted in yellow with pivot point cited based on its 4/25/22 high plus 10 cents in the 7/26/22 mid-day report. Subsequent gains above the pivot point backed by at least +40% above average volume may trigger a technical buy signal. Its 50 DMA line ($35) defines initial support above its 200 DMA line ($33.89).
>>> FEATURED STOCK ARTICLE : Volume Driven Gains Approaching Prior High - 7/26/2022 |
View all notes |
Set NEW NOTE alert |
Company Profile |
SEC
News |
Chart |
Request a new note
C
A
S
I |
GPK
-
NYSE
Graphic Packaging Hldg
CONSUMER NON-DURABLES - Packaging and Containers
|
$22.35
|
-0.25
-1.11% |
$22.99
|
5,005,217
176.18% of 50 DAV
50 DAV is 2,841,000
|
$22.99
-2.78%
|
7/26/2022
|
$22.63
|
PP = $23.09
|
|
MB = $24.24
|
Most Recent Note - 7/27/2022 4:54:35 PM
Y - There was a "negative reversal" today after matching its 52-week high, closing in the lower third of its intraday range with volume +76% above average. Highlighted in yellow in the 7/26/22 mid-day report with pivot point cited based on its 6/06/22 high plus 10 cents. Subsequent gains above the pivot point backed by at least +40% above average volume are needed to trigger a proper technical buy signal. See the latest FSU analysis for more details and an annotated graph.
>>> FEATURED STOCK ARTICLE : Negative Reversal After Matching 52-Week High - 7/27/2022 |
View all notes |
Set NEW NOTE alert |
Company Profile |
SEC
News |
Chart |
Request a new note
C
A
S
I |
|
|
|
THESE ARE NOT BUY RECOMMENDATIONS!
Comments contained in the body of this report are technical
opinions only. The material herein has been obtained
from sources believed to be reliable and accurate, however,
its accuracy and completeness cannot be guaranteed.
This site is not an investment advisor, hence it does
not endorse or recommend any securities or other investments.
Any recommendation contained in this report may not
be suitable for all investors and it is not to be deemed
an offer or solicitation on our part with respect to
the purchase or sale of any securities. All trademarks,
service marks and trade names appearing in this report
are the property of their respective owners, and are
likewise used for identification purposes only.
This report is a service available
only to active Paid Premium Members.
You may opt-out of receiving report notifications
at any time. Questions or comments may be submitted
by writing to Premium Membership Services 665 S.E. 10 Street, Suite 201 Deerfield Beach, FL 33441-5634 or by calling 1-800-965-8307
or 954-785-1121.
|
|
|