You are not logged in.
This means you
CAN ONLY VIEW reports that were published prior to Monday, March 24, 2025.
You
MUST UPGRADE YOUR MEMBERSHIP if you want to see any current reports.
AFTER MARKET UPDATE - WEDNESDAY, JULY 24TH, 2024
Previous After Market Report Next After Market Report >>>
|
|
|
|
DOW |
-504.22 |
39,853.87 |
-1.25% |
|
Volume |
976,923,551 |
+17% |
|
Volume |
6,775,858,600 |
+35% |
|
NASDAQ |
-654.94 |
17,342.41 |
-3.64% |
|
Advancers |
474 |
17% |
|
Advancers |
1,061 |
25% |
|
S&P 500 |
-128.61 |
5,427.13 |
-2.31% |
|
Decliners |
2,280 |
83% |
|
Decliners |
3,153 |
75% |
|
Russell 2000 |
-47.89 |
2,195.37 |
-2.13% |
|
52 Wk Highs |
104 |
|
|
52 Wk Highs |
168 |
|
|
S&P 600 |
-26.31 |
1,384.75 |
-1.86% |
|
52 Wk Lows |
28 |
|
|
52 Wk Lows |
120 |
|
|
 |
Breadth Negative as Indices Fell With Higher Volume Totals
Kenneth J. Gruneisen - Passed the CAN SLIM® Master's Exam
There were unanimous losses on Wednesday for the Dow Jones Industrial Average (-1.3%), Russell 2000 (-2.1%), S&P 500 (-2.3%), and Nasdaq Composite (-3.6%) Volume reported was higher than the prior session totals on the NYSE and on the Nasdaq exchange, action indicative of distributional pressure. Breadth was negative as decliners led advancers by almost a 5-1 margin on the NYSE and by 3-1 on the Nasdaq exchange. There were 52 high-ranked companies from the Leaders List that hit new 52-week highs and were listed on the BreakOuts Page, versus the total of 93 on the prior session. New 52-week highs totals contracted yet still outnumbered new 52-week lows on the NYSE and on the Nasdaq exchange. The major indices are in an uptrend that has been encountering pressure (M criteria). Remember that any uptrend requires healthy leadership and it remains important for a countining flow of stocks hitting new highs.
X PICTURED: The Nasdaq Composite Index violated its 50-day moving average (DMA) line with a big loss while retreating from new all-time highs.
Die stock market exhibited mixed action at the index level today, but the vibe under the surface was positive through the entire session. Advancers led decliners by a 2-to-1 margin at the NYSE and by a 3-to-2 margin at the Nasdaq.
The S&P 500 (-0.5%) and Nasdaq Composite (-0.9%) traded above and below their prior closing levels, following the fickle price action mega cap shares. Meanwhile, the Dow Jones Industrial Average (+0.2%) and Russell 2000 (+1.3%) were either mostly or entirely positive today.
The fickle nature of mega cap stocks was evident in the performance of the Vanguard Mega Cap Growth ETF (MGK), which traded up as much as 0.9% at its high and as low as 2.1% at its low. The equal-weighted S&P 500, however, settled with a 0.1% gain amid rebound action elsewhere.
The upside bias stemmed from buy-the-dip interest after yesterday's solid sell off.
Outsized moves in either direction were reserved for names with specific catalysts. Honeywell (HON 204.85, -8.80, -4.1%) and Ford Motor (F 11.39, -2.28, -16.6%) were losing standouts after reporting earnings news. Meanwhile, IBM (IBM 195.27, +11.29, +6.1%) and ServiceNow (NOW 847.71, +116.84, +16.0%) are winning standouts after reporting earnings.
The 10-yr note yield declined three basis points to 4.26% and the 2-yr note yield rose two basis points to 4.44%. Treasuries were reacting to the this morning's economic releases, which were in-line with the market's soft landing expectation and also acted as support for equities. Also, today's $44 billion 7-yr note auction met strong demand. |
 Kenneth J. Gruneisen started out as a licensed stockbroker in August 1987, a couple of months prior to the historic stock market crash that took the Dow Jones Industrial Average down -22.6% in a single day. He has published daily fact-based fundamental and technical analysis on high-ranked stocks online for two decades. Through FACTBASEDINVESTING.COM, Kenneth provides educational articles, news, market commentary, and other information regarding proven investment systems that work in good times and bad.
Comments contained in the body of this report are technical opinions only and are not necessarily those of Gruneisen Growth Corp. The material herein has been obtained from sources believed to be reliable and accurate, however, its accuracy and completeness cannot be guaranteed. Our firm, employees, and customers may effect transactions, including transactions contrary to any recommendation herein, or have positions in the securities mentioned herein or options with respect thereto. Any recommendation contained in this report may not be suitable for all investors and it is not to be deemed an offer or solicitation on our part with respect to the purchase or sale of any securities. |
|
 |
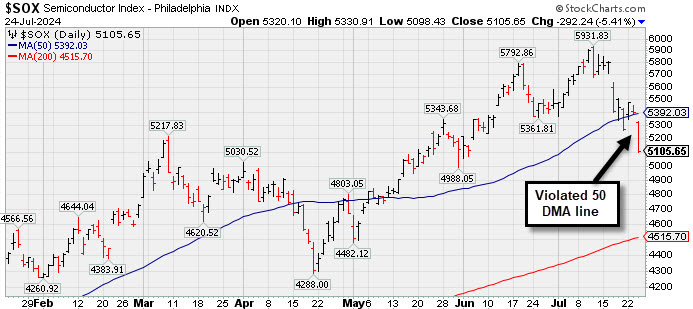
Semiconductor, Networking, Retail, and Oil Services Indexes Led Decliners
Kenneth J. Gruneisen - Passed the CAN SLIM® Master's Exam
The Retail Index ($RLX -2.64%) outpaced the Broker/Dealer Index ($XBD -1.44%) and the Bank Index ($BKX -0.78%) on Wednesday's widely negative session. The tech sector was led lower by the Semiconductor Index ($SOX -5.41%) while the Networking Index ($NWX -2.86%) also suffered a large loss and the Biotech Index ($BTK +0.32%) edged higher. The Gold & Silver Index ($XAU -0.89%) and the Oil Services Index ($OSX -2.43%) both ended lower, meanwhile, the Integrated Oil Index ($XOI +0.57%) eked out a modest gain.
PICTURED: The Semiconductor Index ($SOX -5.41%) violated its 50-day moving average (DMA) line with a big loss.
| Oil Services |
$OSX |
87.35 |
-2.17 |
-2.43% |
+4.14% |
| Integrated Oil |
$XOI |
2,008.58 |
+11.31 |
+0.57% |
+7.84% |
| Semiconductor |
$SOX |
5,105.65 |
-292.24 |
-5.41% |
+22.28% |
| Networking |
$NWX |
867.57 |
-25.57 |
-2.86% |
+4.17% |
| Broker/Dealer |
$XBD |
653.10 |
-9.53 |
-1.44% |
+17.19% |
| Retail |
$RLX |
4,407.58 |
-119.64 |
-2.64% |
+13.34% |
| Gold & Silver |
$XAU |
149.37 |
-1.35 |
-0.89% |
+18.84% |
| Bank |
$BKX |
112.86 |
-0.89 |
-0.78% |
+17.54% |
| Biotech |
$BTK |
5,587.47 |
+18.02 |
+0.32% |
+3.11% |
|
|
|
 |
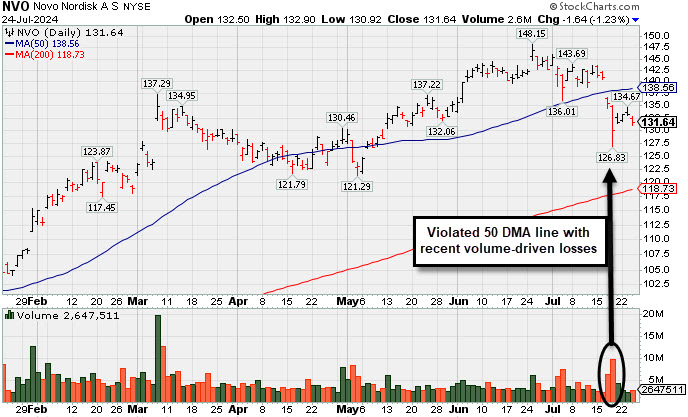
Violation of 50-Day Moving Average Line Raised Concerns
Kenneth J. Gruneisen - Passed the CAN SLIM® Master's Exam
Novo Nordisk (NVO -$1.68 or -1.26% to $131.60) abruptly slumped below its 50-day moving average (DMA) line ($138.56) with heavier volume behind damaging losses last week raising concerns and triggering a technical sell signal. Only a prompt rebound above the 50 DMA line would help its outlook improve. Fundamentals remain strong.
NVO reported Mar '24 quarterly earnings +28% on +22% sales revenues versus the year-ago period, its 5th strong quarter well above the +25% minimum earnings guideline (C criteria). Annual earnings growth has been strong and steady. It has a 97 Earnings Per Share Rating, well above the 80+ minimum for buy candidates.
The number of top-rated funds owning its shares rose from 372 in Dec '22 to 583 in Jun '24, a reassuring sign concerning the I criteria. Its current Up/Down Volume Ratio of 1.4 is an unbiased indication its shares have been under accumulation over the past 50 days. It has a Timeliness Rating of C and an Accumulation/Distribution Rating of E. |
|
|
Color Codes Explained :
Y - Better candidates highlighted by our
staff of experts.
G - Previously featured
in past reports as yellow but may no longer be buyable under the
guidelines.
***Last / Change / Volume data in this table is the closing quote data***
Symbol/Exchange
Company Name
Industry Group |
PRICE |
CHANGE
(%Change) |
Day High |
Volume
(% DAV)
(% 50 day avg vol) |
52 Wk Hi
% From Hi |
Featured
Date |
Price
Featured |
Pivot Featured |
|
Max Buy |
 TDG
-
NYSE
TDG
-
NYSE
TransDigm Group
Aerospace/Defense
|
$1,245.48
|
-41.65
-3.24% |
$1,274.93
|
170,494
69.59% of 50 DAV
50 DAV is 245,000
|
$1,369.58
-9.06%
|
4/12/2024
|
$1,224.21
|
PP = $1,246.32
|
|
MB = $1,308.64
|
 Most Recent Note - 7/24/2024 3:30:36 PM
G - Gapped down today after rebounding but meeting resistance at its 50 DMA line ($1,297.53) which is now downward sloping. It is -8.3% off its all-time high. A rebound above the 50 DMA line is needed to improve its outlook. Fundamentals remain strong.
>>> FEATURED STOCK ARTICLE : Lingering Below 50-Day Moving Average But Only -7% Off High - 7/10/2024 |
View all notes |
Set NEW NOTE alert |
Company Profile |
SEC
News |
Chart |
Request a new note
C
A
S
I |
USLM
-
NASDAQ
U.S. Lime & Minerals
Bldg-Cement/Concrt/Ag
|
$81.46
|
-3.29
-3.88% |
$84.50
|
38,032
35.21% of 50 DAV
50 DAV is 108,000
|
$85.10
-4.28%
|
6/18/2024
|
$71.26
|
PP = $75.77
|
|
MB = $79.56
|
Most Recent Note - 7/22/2024 5:39:15 PM
G - Posted a gain today with below-average volume, ending at a best-ever close near its all-time high. Color code is changed to green after rising above its "max buy" level. Found support while consolidating above its 50 DMA line ($72). Do not be confused as shares split 5:1 (Featured Price and Pivot Point were adjusted).
>>> FEATURED STOCK ARTICLE : Recent Breakout Triggered New (or Add-On) Technical Buy Signal - 7/22/2024 |
View all notes |
Set NEW NOTE alert |
Company Profile |
SEC
News |
Chart |
Request a new note
C
A
S
I |
CLS
-
NYSE
Celestica
Elec-Contract Mfg
|
$53.39
|
-4.49
-7.76% |
$56.68
|
3,930,601
183.33% of 50 DAV
50 DAV is 2,144,000
|
$63.49
-15.91%
|
7/6/2024
|
$57.62
|
PP = $61.16
|
|
MB = $64.22
|
Most Recent Note - 7/24/2024 1:16:10 PM
G - Color code is changed to green with today's big volume-driven loss violating its 50 DMA line ($56) triggering a technical sell signal. Stalled after quietly touching a new all-time high. Repeatedly noted - "A gain backed by at least +40% above average volume and a close above the new pivot point cited based on its 5/28/24 high plus 10 cents may trigger a proper technical buy signal. Important support is at its 50 DMA line ($54.60)."
>>> FEATURED STOCK ARTICLE : Testing 50-Day Moving Average Line After Wedging to New High - 7/19/2024 |
View all notes |
Set NEW NOTE alert |
Company Profile |
SEC
News |
Chart |
Request a new note
C
A
S
I |
NVO
-
NYSE
Novo Nordisk ADR
Medical-Ethical Drugs
|
$131.60
|
-1.68
-1.26% |
$132.90
|
2,647,082
70.01% of 50 DAV
50 DAV is 3,781,000
|
$148.15
-11.17%
|
6/7/2024
|
$143.06
|
PP = $138.38
|
|
MB = $145.30
|
Most Recent Note - 7/24/2024 3:32:58 PM
G - Abruptly slumped below its 50 DMA line ($138.56) with heavier volume behind damaging losses last week raising concerns and triggering a technical sell signal. Only a prompt rebound above the 50 DMA line would help its outlook improve. Fundamentals remain strong.
>>> FEATURED STOCK ARTICLE : Violation of 50-Day Moving Average Line Raised Concerns - 7/24/2024 |
View all notes |
Set NEW NOTE alert |
Company Profile |
SEC
News |
Chart |
Request a new note
C
A
S
I |
GVA
-
NYSE
Granite Construction
Bldg-Heavy Construction
|
$65.84
|
-1.80
-2.66% |
$68.71
|
2,228,172
359.38% of 50 DAV
50 DAV is 620,000
|
$68.06
-3.26%
|
6/11/2024
|
$59.76
|
PP = $64.33
|
|
MB = $67.55
|
Most Recent Note - 7/24/2024 12:34:38 PM
G - Color code is changed tro green with today 3rd consecutive gain backed by above-average volume rallying above its "max buy" level to a new all-time high. Prior highs in the $64 area define initial support to watch above its 50 DMA line ($62.31).
>>> FEATURED STOCK ARTICLE : Granite Testing Support at 50-Day Moving Average - 7/2/2024 |
View all notes |
Set NEW NOTE alert |
Company Profile |
SEC
News |
Chart |
Request a new note
C
A
S
I |
Symbol/Exchange
Company Name
Industry Group |
PRICE |
CHANGE
(%Change) |
Day High |
Volume
(% DAV)
(% 50 day avg vol) |
52 Wk Hi
% From Hi |
Featured
Date |
Price
Featured |
Pivot Featured |
|
Max Buy |
DDOG
-
NASDAQ
Datadog Inc
Computer Sftwr-Enterprse
|
$117.32
|
-5.89
-4.78% |
$123.01
|
3,501,636
95.48% of 50 DAV
50 DAV is 3,667,400
|
$138.61
-15.36%
|
7/9/2024
|
$126.92
|
PP = $138.71
|
|
MB = $145.65
|
Most Recent Note - 7/24/2024 3:28:51 PM
G - Color code is changed to green today while sinking below its 50 DMA line ($120.95) testing important support is at its 200 DMA line ($117.86). More damaging losses would raise serious concerns and trigger a worrisome technical sell signal. A rebound above the 50 DMA line is needed for its outlook to improve.
>>> FEATURED STOCK ARTICLE : Consolidating Within Close Range of 52-Week High - 7/9/2024 |
View all notes |
Set NEW NOTE alert |
Company Profile |
SEC
News |
Chart |
Request a new note
C
A
S
I |
MMYT
-
NASDAQ
MakeMyTrip
Leisure-Travel Booking
|
$90.87
|
-6.04
-6.23% |
$96.50
|
921,303
116.62% of 50 DAV
50 DAV is 790,000
|
$100.22
-9.33%
|
7/23/2024
|
$96.92
|
PP = $93.39
|
|
MB = $98.06
|
Most Recent Note - 7/24/2024 1:17:50 PM
Y - Pulling back today following 4 consecutive volume-driven gains. Finished strong after highlighted in yellow in the 7/23/24 mid-day report with pivot point cited based on its 7/10/24 high plus 10 cents. Triggered a technical buy signal as it powered to a new all-time high. See the latest FSU analysis for more details and an annotated graph.
>>> FEATURED STOCK ARTICLE : Volume Driven Trip to New Highs - 7/23/2024 |
View all notes |
Set NEW NOTE alert |
Company Profile |
SEC
News |
Chart |
Request a new note
C
A
S
I |
|
|
|
THESE ARE NOT BUY RECOMMENDATIONS!
Comments contained in the body of this report are technical
opinions only. The material herein has been obtained
from sources believed to be reliable and accurate, however,
its accuracy and completeness cannot be guaranteed.
This site is not an investment advisor, hence it does
not endorse or recommend any securities or other investments.
Any recommendation contained in this report may not
be suitable for all investors and it is not to be deemed
an offer or solicitation on our part with respect to
the purchase or sale of any securities. All trademarks,
service marks and trade names appearing in this report
are the property of their respective owners, and are
likewise used for identification purposes only.
This report is a service available
only to active Paid Premium Members.
You may opt-out of receiving report notifications
at any time. Questions or comments may be submitted
by writing to Premium Membership Services 665 S.E. 10 Street, Suite 201 Deerfield Beach, FL 33441-5634 or by calling 1-800-965-8307
or 954-785-1121.
|
|
|