You are not logged in.
This means you
CAN ONLY VIEW reports that were published prior to Saturday, February 15, 2025.
You
MUST UPGRADE YOUR MEMBERSHIP if you want to see any current reports.
AFTER MARKET UPDATE - TUESDAY, JULY 23RD, 2024
Previous After Market Report Next After Market Report >>>
|
|
|
|
DOW |
-57.35 |
40,358.09 |
-0.14% |
|
Volume |
837,866,849 |
-3% |
|
Volume |
5,025,458,900 |
-3% |
|
NASDAQ |
-10.22 |
17,997.35 |
-0.06% |
|
Advancers |
1,437 |
52% |
|
Advancers |
2,328 |
55% |
|
S&P 500 |
-8.67 |
5,555.74 |
-0.16% |
|
Decliners |
1,314 |
48% |
|
Decliners |
1,886 |
45% |
|
Russell 2000 |
+22.62 |
2,243.27 |
+1.02% |
|
52 Wk Highs |
205 |
|
|
52 Wk Highs |
235 |
|
|
S&P 600 |
+10.08 |
1,411.06 |
+0.72% |
|
52 Wk Lows |
15 |
|
|
52 Wk Lows |
91 |
|
|
 |
Small Cap Indexes Rose While the 3 Major Indices Fell
Kenneth J. Gruneisen - Passed the CAN SLIM® Master's Exam
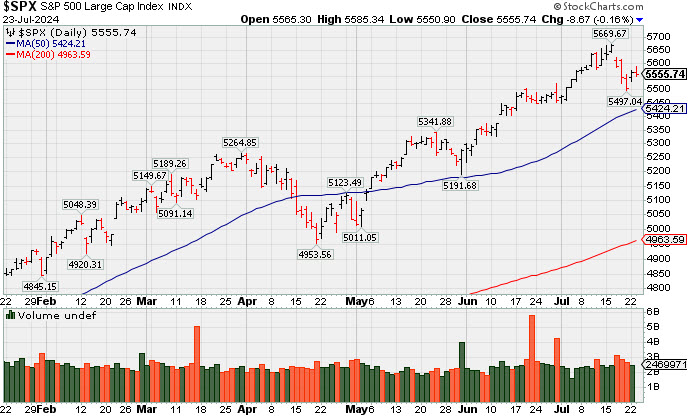
The Russell 2000 outperformed with a +1.1% gain while the S&P 500 (-0.2%), Nasdaq Composite (-0.1%), and Dow Jones Industrial Average (-0.1%) each closed with small losses. Volume reported was lower than the prior session totals on the NYSE and on the Nasdaq exchange. Breadth was slightly positive as advancers narrowly led decliners on the NYSE and by 11-9 on the Nasdaq exchange. Leadership improved as there were 93 high-ranked companies from the Leaders List that hit new 52-week highs and were listed on the BreakOuts Page, more than doubling the total of 45 on the prior session. New 52-week highs totals expanded and solidly outnumbered new 52-week lows on the NYSE and on the Nasdaq exchange. The major indices are in an uptrend that has been encountering pressure (M criteria). Remember that any uptrend requires healthy leadership and it remains important for a countining flow of stocks hitting new highs.
PICTURED: The S&P 500 Index is consolidating after recently reaching new all-time highs.
UPS (UPS -12.06%) was among the losing standouts after missing earnings estimates. NXP Semiconductors (NXPI -7.58%) also was a notable loser following their quarterly results. Spotify (SPOT +11.98%), Lockheed Martin (LMT +5.63%), and Sherwin-Williams (SWH +6.87%) were winning standouts following their reports.
Only three of the S&P 500 sectors rose, materials (+0.4%), financials (+0.1%), and consumer discretionary (+0.02%). The energy (-1.6%), utilities (-0.7%), and consumer staples (-0.3%) sectors registered the largest declines. The 10-yr note yield declined two basis points to 4.24% and the 2-yr note yield settled four basis points lower at 4.48%.
|
 Kenneth J. Gruneisen started out as a licensed stockbroker in August 1987, a couple of months prior to the historic stock market crash that took the Dow Jones Industrial Average down -22.6% in a single day. He has published daily fact-based fundamental and technical analysis on high-ranked stocks online for two decades. Through FACTBASEDINVESTING.COM, Kenneth provides educational articles, news, market commentary, and other information regarding proven investment systems that work in good times and bad.
Comments contained in the body of this report are technical opinions only and are not necessarily those of Gruneisen Growth Corp. The material herein has been obtained from sources believed to be reliable and accurate, however, its accuracy and completeness cannot be guaranteed. Our firm, employees, and customers may effect transactions, including transactions contrary to any recommendation herein, or have positions in the securities mentioned herein or options with respect thereto. Any recommendation contained in this report may not be suitable for all investors and it is not to be deemed an offer or solicitation on our part with respect to the purchase or sale of any securities. |
|
 |
Retail, Bank and Networking Indexes Led Group Gainers
Kenneth J. Gruneisen - Passed the CAN SLIM® Master's Exam
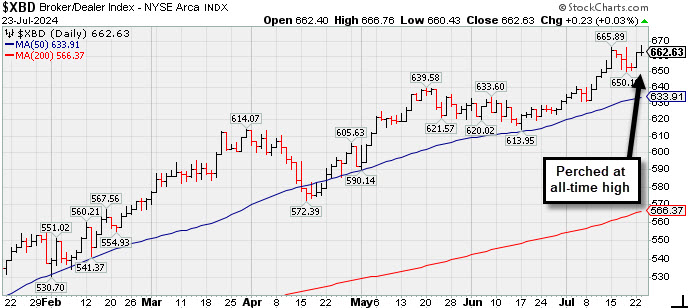
The Retail Index ($RLX +1.09%) and Bank Index ($BKX +0.73%) posted influential gain while the Broker/Dealer Index ($XBD +0.03%) finished flat on Tuesday's session. The tech sector was mixed as the Semiconductor Index ($SOX -1.46%) fell while the Biotech Index ($BTK +0.09%) finished flat and the Networking Index ($NWX +1.63%) posted a solid gain. The Gold & Silver Index ($XAU +0.27%) and the Oil Services Index ($OSX +0.34%) both edged higher, meanwhile, the Integrated Oil Index ($XOI -1.86%) was a laggard as it finished the session solidly lower.
PICTURED: The Broker/Dealer Index ($XBD +0.03%) is consolidating after rallying to new all-time highs.
| Oil Services |
$OSX |
89.52 |
+0.30 |
+0.34% |
+6.73% |
| Integrated Oil |
$XOI |
1,997.27 |
-37.79 |
-1.86% |
+7.24% |
| Semiconductor |
$SOX |
5,397.90 |
-79.93 |
-1.46% |
+29.28% |
| Networking |
$NWX |
893.14 |
+14.34 |
+1.63% |
+7.24% |
| Broker/Dealer |
$XBD |
662.63 |
+0.23 |
+0.03% |
+18.90% |
| Retail |
$RLX |
4,527.22 |
+48.90 |
+1.09% |
+16.42% |
| Gold & Silver |
$XAU |
150.71 |
+0.40 |
+0.27% |
+19.91% |
| Bank |
$BKX |
113.75 |
+0.82 |
+0.73% |
+18.46% |
| Biotech |
$BTK |
5,569.44 |
+5.09 |
+0.09% |
+2.78% |
|
|
|
 |
Volume Driven Trip to New Highs
Kenneth J. Gruneisen - Passed the CAN SLIM® Master's Exam
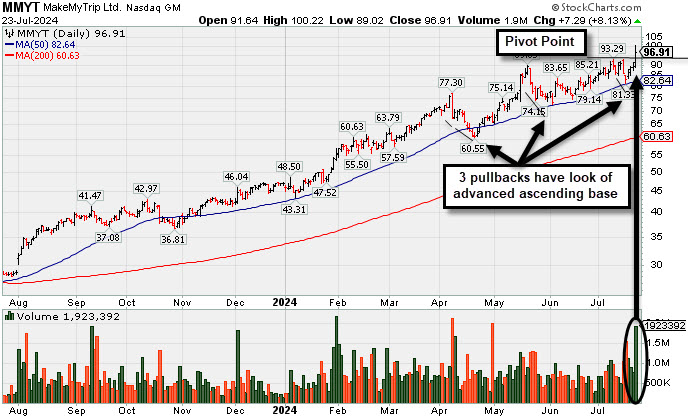
MakeMyTrip (MMYT +$7.29 or +8.13 to $96.91) finished strong after highlighted in yellow with pivot point cited based on its 7/10/24 high plus 10 cents in the earlier mid-day report (read here). It powered to a new all-time high with today's 4th consecutive volume-driven gain triggering a technical buy signal . It tested its 50-day moving average (DMA) line ($82.59) and has ralllied from an advanced "ascending base".
Through Mar '24 its quarterly earnings growth has been strong and well above the +25% minimum guideline (C criteria). After years of steadily shrinking losses it has shown great earnings growth in FY '22 and '23. The company has a 98 Earnings Per Share Rating.
The number of top-rated funds owning its shares rose from 287 in Sep '23 to 437 in Jun '24, a reassuring sign concerning the I criteria. Its small supply of only 72.4 million shares in the public float can contribute to greater price volatility in the event of any institutiuonal buying or selling. It has an A Timeliness Rating and a B Accumulation/Distribution Rating.
Chart courtesy of www.stockcharts.com
 Symbol/Exchange
Company Name
Industry Group | PRICE | CHANGE
(%Change) | Day High | Volume
(% DAV)
(% 50 day avg vol) | 52 Wk Hi
% From Hi | Featured
Date | Price
Featured | Pivot Featured | | Max Buy |  TDG - NYSE TDG - NYSE
TransDigm Group
Aerospace/Defense | $1,287.13 | +31.28
2.49% | $1,296.38 | 204,000
83.27% of 50 DAV
50 DAV is 245,000 | $1,369.58
-6.02%
| 4/12/2024 | $1,224.21 | PP = $1,246.32 | | MB = $1,308.64 | Most Recent Note - 7/22/2024 5:41:59 PM
G - Posted a small gain today with below-average volume. Recently lingering below its 50 DMA line ($1,299) which is now downward sloping. It is -8.3% off its all-time high. A rebound above the 50 DMA line is needed to improve its outlook. Fundamentals remain strong.
>>> FEATURED STOCK ARTICLE : Lingering Below 50-Day Moving Average But Only -7% Off High - 7/10/2024 | View all notes | Set NEW NOTE alert | Company Profile | SEC News | Chart | Request a new note C A S I | USLM - NASDAQ
U.S. Lime & Minerals
Bldg-Cement/Concrt/Ag | $84.75 | +2.33
2.83% | $85.10 | 81,550
74.14% of 50 DAV
50 DAV is 110,000 | $84.19
0.67%
| 6/18/2024 | $71.26 | PP = $75.77 | | MB = $79.56 | Most Recent Note - 7/22/2024 5:39:15 PM
G - Posted a gain today with below-average volume, ending at a best-ever close near its all-time high. Color code is changed to green after rising above its "max buy" level. Found support while consolidating above its 50 DMA line ($72). Do not be confused as shares split 5:1 (Featured Price and Pivot Point were adjusted).
>>> FEATURED STOCK ARTICLE : Recent Breakout Triggered New (or Add-On) Technical Buy Signal - 7/22/2024 | View all notes | Set NEW NOTE alert | Company Profile | SEC News | Chart | Request a new note C A S I | CLS - NYSE
Celestica
Elec-Contract Mfg | $57.88 | +0.98
1.72% | $58.70 | 1,463,220
68.37% of 50 DAV
50 DAV is 2,140,000 | $63.49
-8.84%
| 7/6/2024 | $57.62 | PP = $61.16 | | MB = $64.22 | Most Recent Note - 7/19/2024 4:52:21 PM
Y - Halted its slide today following 2 consecutive volume-driven losses testing its 50 DMA line after quietly touching a new all-time high. Repeatedly noted - "A gain backed by at least +40% above average volume and a close above the new pivot point cited based on its 5/28/24 high plus 10 cents may trigger a proper technical buy signal. Important support is at its 50 DMA line ($54.60)." See the latest FSU analysis for more details and a new annotated graph.
>>> FEATURED STOCK ARTICLE : Testing 50-Day Moving Average Line After Wedging to New High - 7/19/2024 | View all notes | Set NEW NOTE alert | Company Profile | SEC News | Chart | Request a new note C A S I | NVO - NYSE
Novo Nordisk ADR
Medical-Ethical Drugs | $133.28 | +0.10
0.08% | $134.67 | 2,130,814
56.37% of 50 DAV
50 DAV is 3,780,000 | $148.15
-10.04%
| 6/7/2024 | $143.06 | PP = $138.38 | | MB = $145.30 | Most Recent Note - 7/18/2024 12:01:52 PM
G - Abruptly slumping with heavier volume behind today's damaging loss. Color code was changed to green after violating its 50 DMA line ($138.08) raising concerns and triggering a technical sell signal. Only a prompt rebound above the 50 DMA line would help its outlook improve. Fundamentals remain strong.
>>> FEATURED STOCK ARTICLE : Perched Near All-Time High Following Recent Gap Up With Volume - 7/1/2024 | View all notes | Set NEW NOTE alert | Company Profile | SEC News | Chart | Request a new note C A S I | GVA - NYSE
Granite Construction
Bldg-Heavy Construction | $67.64 | +2.07
3.16% | $68.06 | 1,004,904
164.20% of 50 DAV
50 DAV is 612,000 | $66.72
1.38%
| 6/11/2024 | $59.76 | PP = $64.33 | | MB = $67.55 | Most Recent Note - 7/22/2024 5:40:36 PM
Y - Posted a small gain today with lighter volume while hovering near its all-time high. Prior highs in the $64 area define initial support to watch above its 50 DMA line ($62).
>>> FEATURED STOCK ARTICLE : Granite Testing Support at 50-Day Moving Average - 7/2/2024 | View all notes | Set NEW NOTE alert | Company Profile | SEC News | Chart | Request a new note C A S I | Symbol/Exchange
Company Name
Industry Group | PRICE | CHANGE
(%Change) | Day High | Volume
(% DAV)
(% 50 day avg vol) | 52 Wk Hi
% From Hi | Featured
Date | Price
Featured | Pivot Featured | | Max Buy | DDOG - NASDAQ
Datadog Inc
Computer Sftwr-Enterprse | $123.21 | +1.99
1.64% | $125.35 | 2,309,234
62.59% of 50 DAV
50 DAV is 3,689,300 | $138.61
-11.11%
| 7/9/2024 | $126.92 | PP = $138.71 | | MB = $145.65 | Most Recent Note - 7/22/2024 5:48:13 PM
Y - Color code is changed to yellow after rebounding and closing above its 50 DMA line ($120.80) as today''s gain backed by higher (but still -16% below-average) volume helped its outlook improve. The next important support is at its 200 DMA line ($117.54).
>>> FEATURED STOCK ARTICLE : Consolidating Within Close Range of 52-Week High - 7/9/2024 | View all notes | Set NEW NOTE alert | Company Profile | SEC News | Chart | Request a new note C A S I | MMYT - NASDAQ
MakeMyTrip
Leisure-Travel Booking | $96.91 | +7.29
8.13% | $100.22 | 1,923,197
249.77% of 50 DAV
50 DAV is 770,000 | $93.29
3.88%
| 7/23/2024 | $96.92 | PP = $93.39 | | MB = $98.06 |  Most Recent Note - 7/23/2024 5:23:45 PM Most Recent Note - 7/23/2024 5:23:45 PM
Y - Finished strong after highlighted in yellow with pivot point cited based on its 7/10/24 high plus 10 cents. Triggered a technical buy signal as it powered to a new all-time high with today's 4th consecutive volume-driven gain after testing its 50 DMA line ($82.59). Rose from an advanced "ascending base". Through Mar '24 its quarterly earnings growth has been strong and well above the +25% minimum guideline (C criteria). After years of steadily shrinking losses it has shown great earnings growth in FY '22 and '23. See the latest FSU analysis for more details and a new annotated graph.
>>> FEATURED STOCK ARTICLE : Volume Driven Trip to New Highs - 7/23/2024 | View all notes | Set NEW NOTE alert | Company Profile | SEC News | Chart | Request a new note C A S I |
|
|
|
Color Codes Explained :
Y - Better candidates highlighted by our
staff of experts.
G - Previously featured
in past reports as yellow but may no longer be buyable under the
guidelines.
***Last / Change / Volume data in this table is the closing quote data***
|
|
|
THESE ARE NOT BUY RECOMMENDATIONS!
Comments contained in the body of this report are technical
opinions only. The material herein has been obtained
from sources believed to be reliable and accurate, however,
its accuracy and completeness cannot be guaranteed.
This site is not an investment advisor, hence it does
not endorse or recommend any securities or other investments.
Any recommendation contained in this report may not
be suitable for all investors and it is not to be deemed
an offer or solicitation on our part with respect to
the purchase or sale of any securities. All trademarks,
service marks and trade names appearing in this report
are the property of their respective owners, and are
likewise used for identification purposes only.
This report is a service available
only to active Paid Premium Members.
You may opt-out of receiving report notifications
at any time. Questions or comments may be submitted
by writing to Premium Membership Services 665 S.E. 10 Street, Suite 201 Deerfield Beach, FL 33441-5634 or by calling 1-800-965-8307
or 954-785-1121.
|
|
|