You are not logged in.
This means you
CAN ONLY VIEW reports that were published prior to Sunday, March 23, 2025.
You
MUST UPGRADE YOUR MEMBERSHIP if you want to see any current reports.
AFTER MARKET UPDATE - FRIDAY, JULY 19TH, 2024
Previous After Market Report Next After Market Report >>>
|
|
|
|
DOW |
-377.49 |
40,287.53 |
-0.93% |
|
Volume |
1,193,768,375 |
+150% |
|
Volume |
5,038,838,600 |
-4% |
|
NASDAQ |
-144.28 |
17,726.94 |
-0.81% |
|
Advancers |
983 |
36% |
|
Advancers |
1,424 |
34% |
|
S&P 500 |
-39.59 |
5,505.00 |
-0.71% |
|
Decliners |
1,727 |
64% |
|
Decliners |
2,726 |
66% |
|
Russell 2000 |
-13.89 |
2,184.40 |
-0.63% |
|
52 Wk Highs |
51 |
|
|
52 Wk Highs |
57 |
|
|
S&P 600 |
-9.53 |
1,380.44 |
-0.69% |
|
52 Wk Lows |
18 |
|
|
52 Wk Lows |
108 |
|
|
 |
Major Indices Ended Lower as Leadership Waned
Kenneth J. Gruneisen - Passed the CAN SLIM® Master's Exam
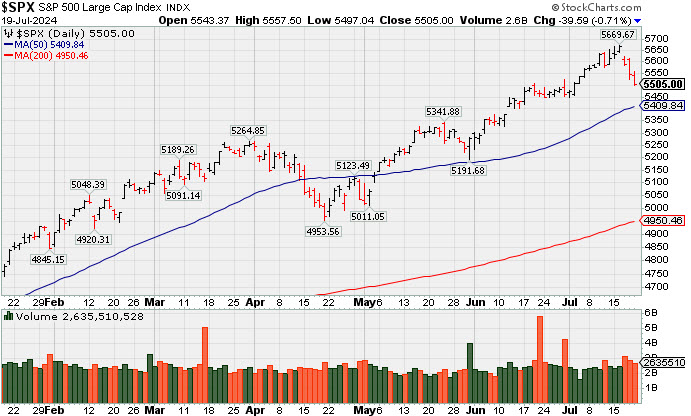
The S&P 500 Index declined -0.7% and the Russell 2000 fell -0.6%.Volume was lower than the prior session totals on the NYSE and on the Nasdaq exchange. Breadth was negative as decliners led advancers by almost a 2-1 margin on the NYSE and on the Nasdaq exchange. Leadership waned as there were only 18 high-ranked companies from the Leaders List that hit new 52-week highs and were listed on the BreakOuts Page, versus the total of 96 on the prior session. New 52-week highs totals contracted yet still outnumbered new 52-week lows on the NYSE but new lows outnumbered new highs on the Nasdaq exchange. The major indices are in an uptrend that has been encountering pressure (M criteria). Remember that any uptrend requires healthy leadership and it remains important for a countining flow of stocks hitting new highs.
PICTURED: The S&P 500 Index suffered a 3rd consecutive loss, retreating from its all-time high.
Nine of the 11 S&P 500 sectors finished lower with losses ranging from -0.1% for real estate to -1.3% for information technology and energy. The health care sector (+0.5%) was a winning standout and the utilities sector (+0.1%) also qualified as a relative strength leader. The Philadelphia Semiconductor Index declined 3.1% Friday, finishing at its lows, and it was down -8.8% for the week.
The 2-yr note yield increased five basis points to 4.51% and the 10-yr note yield increased five basis points to 4.24%. There was no U.S. economic data of note today. CrowdStrike (CRWD -11.10%) fell after a technical update had a flaw that wreaked havoc around the globe. A negative response to the earnings weighed on Netflix (NFLX -1.51%), and also Dow components American Express (AXP -2.74%) and Travelers (TRV -7.76%).
|
 Kenneth J. Gruneisen started out as a licensed stockbroker in August 1987, a couple of months prior to the historic stock market crash that took the Dow Jones Industrial Average down -22.6% in a single day. He has published daily fact-based fundamental and technical analysis on high-ranked stocks online for two decades. Through FACTBASEDINVESTING.COM, Kenneth provides educational articles, news, market commentary, and other information regarding proven investment systems that work in good times and bad.
Comments contained in the body of this report are technical opinions only and are not necessarily those of Gruneisen Growth Corp. The material herein has been obtained from sources believed to be reliable and accurate, however, its accuracy and completeness cannot be guaranteed. Our firm, employees, and customers may effect transactions, including transactions contrary to any recommendation herein, or have positions in the securities mentioned herein or options with respect thereto. Any recommendation contained in this report may not be suitable for all investors and it is not to be deemed an offer or solicitation on our part with respect to the purchase or sale of any securities. |
|
 |
Semiconductor, Retail, and Commodity-Linked Groups Fell
Kenneth J. Gruneisen - Passed the CAN SLIM® Master's Exam
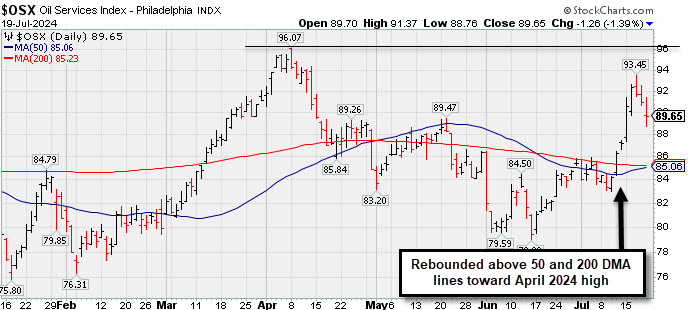
The Retail Index ($RLX -0.42%) edged lower while the Bank Index ($BKX -0.15%) and the Broker/Dealer Index ($XBD -0.02%) both were little changed on Friday's session. The Semiconductor Index ($SOX -3.11%) led the tech sector lower while the Networking Index ($NWX -1.19%) suffered a smaller loss and the Biotech Index ($BTK +0.27%) eked out a small gain. Commodity-linked groups had a negative bias as the Gold & Silver Index ($XAU -1.17%), Oil Services Index ($OSX -1.39%), and the Integrated Oil Index ($XOI -1.22%) each finished the session lower.
PICTURED: The Oil Services Index ($OSX -1.39%) is consolidating after rebounding above its 50-day and 200-day moving average (DMA) lines toward its April 2024 high.
| Oil Services |
$OSX |
89.65 |
-1.26 |
-1.39% |
+6.88% |
| Integrated Oil |
$XOI |
2,047.34 |
-25.29 |
-1.22% |
+9.93% |
| Semiconductor |
$SOX |
5,267.16 |
-169.26 |
-3.11% |
+26.15% |
| Networking |
$NWX |
869.22 |
-10.51 |
-1.19% |
+4.37% |
| Broker/Dealer |
$XBD |
652.68 |
-0.13 |
-0.02% |
+17.12% |
| Retail |
$RLX |
4,479.31 |
-18.81 |
-0.42% |
+15.19% |
| Gold & Silver |
$XAU |
149.89 |
-1.78 |
-1.17% |
+19.26% |
| Bank |
$BKX |
112.36 |
-0.17 |
-0.15% |
+17.02% |
| Biotech |
$BTK |
5,509.59 |
+15.09 |
+0.27% |
+1.68% |
|
|
|
 |
Testing 50-Day Moving Average Line After Wedging to New High
Kenneth J. Gruneisen - Passed the CAN SLIM® Master's Exam
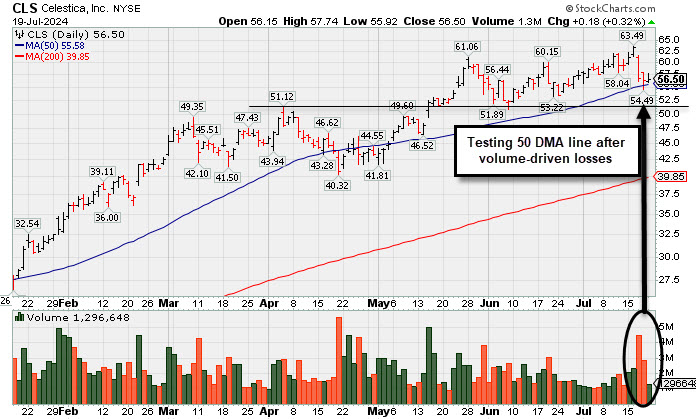
Celestica (CLS +$0.18 or +0.32% to $56.50) halted its slide today following 2 consecutive volume-driven losses testing its 50-day moving average (DMA) line after quietly touching a new all-time high. It has been repeatedly noted - "A gain backed by at least +40% above average volume and a close above the new pivot point cited based on its 5/28/24 high plus 10 cents may trigger a proper technical buy signal. Important support is at its 50 DMA line ($54.60)."
CLS was highlighted in yellow in the 5/15/24 mid-day report (read here) with pivot point cited based on its 4/04/24 high plus 10 cents after a 6-week flat base. It was last shown in detail in this FSU section on 6/27/24 with an annotated graph under the headline, "Consolidating Above Prior Highs in an Orderly Fashion".
CLS hails from the high ranked Elec-Contract Mfg group which is now ranked 25th on the 197 Industry Groups List (L criteria). CLS recently reported earnings +83% on +20% sales revenues for the Mar '24 quarter versus the year ago period, and 7 of the last 8 quarterly comparisons were at or above the +25% minimum earnings guideline (C criteria). Annual earnings (A criteria) history has been strong since bottoming in FY '19. It has a highest possible 99 Earnings Per Share Rating.
There are only 119 million shares outstanding (S criteria) which can contribute to greater price volatility in the event of institutional buying or selling. The number of top-rated funds owning its shares rose from 322 in Jun '23 to 566 in Jun '24, a reassuring sign concerning the I criteria. Its current Up/Down Volume Ratio of 1.4 is an unbiased indication its shares have been under accumulation over the past 50 days.
|
|
|
Color Codes Explained :
Y - Better candidates highlighted by our
staff of experts.
G - Previously featured
in past reports as yellow but may no longer be buyable under the
guidelines.
***Last / Change / Volume data in this table is the closing quote data***
Symbol/Exchange
Company Name
Industry Group |
PRICE |
CHANGE
(%Change) |
Day High |
Volume
(% DAV)
(% 50 day avg vol) |
52 Wk Hi
% From Hi |
Featured
Date |
Price
Featured |
Pivot Featured |
|
Max Buy |
 TDG
-
NYSE
TDG
-
NYSE
TransDigm Group
Aerospace/Defense
|
$1,238.07
|
-7.85
-0.63% |
$1,259.27
|
166,580
66.10% of 50 DAV
50 DAV is 252,000
|
$1,369.58
-9.60%
|
4/12/2024
|
$1,224.21
|
PP = $1,246.32
|
|
MB = $1,308.64
|
Most Recent Note - 7/17/2024 5:31:13 PM
G - Pulled back today with lighter volume. Recently lingering below its 50 DMA line ($1,303) which is now downward sloping. It is -9.4% off its all-time high. A rebound above the 50 DMA line is needed to help its outlook improve. Fundamentals remain strong.
>>> FEATURED STOCK ARTICLE : Lingering Below 50-Day Moving Average But Only -7% Off High - 7/10/2024 |
View all notes |
Set NEW NOTE alert |
Company Profile |
SEC
News |
Chart |
Request a new note
C
A
S
I |
USLM
-
NASDAQ
U.S. Lime & Minerals
Bldg-Cement/Concrt/Ag
|
$79.55
|
+1.55
1.99% |
$79.81
|
68,891
59.91% of 50 DAV
50 DAV is 115,000
|
$84.19
-5.51%
|
6/18/2024
|
$71.26
|
PP = $75.77
|
|
MB = $79.56
|
 Most Recent Note - 7/19/2024 4:55:02 PM
Y - Perched near its all-time high with volume totals cooling following noted volume-driven gains. Found support while consolidating above its 50 DMA line ($71.72). Do not be confused as shares split 5:1 (Featured Price and Pivot Point were adjusted). Color code was changed to yellow with new pivot point cited based on its 5/15/24 high plus 10 cents as it was noted - " Subsequent gains above the pivot point backed by at least +40% above average volume may trigger a new (or add-on) technical buy signal."
>>> FEATURED STOCK ARTICLE : in Striking Distance of All-Time High After Volume-Driven Gains - 6/28/2024 |
View all notes |
Set NEW NOTE alert |
Company Profile |
SEC
News |
Chart |
Request a new note
C
A
S
I |
CLS
-
NYSE
Celestica
Elec-Contract Mfg
|
$56.50
|
+0.18
0.32% |
$57.75
|
1,300,713
60.44% of 50 DAV
50 DAV is 2,152,000
|
$63.49
-11.01%
|
7/6/2024
|
$57.62
|
PP = $61.16
|
|
MB = $64.22
|
Most Recent Note - 7/19/2024 4:52:21 PM
Y - Halted its slide today following 2 consecutive volume-driven losses testing its 50 DMA line after quietly touching a new all-time high. Repeatedly noted - "A gain backed by at least +40% above average volume and a close above the new pivot point cited based on its 5/28/24 high plus 10 cents may trigger a proper technical buy signal. Important support is at its 50 DMA line ($54.60)." See the latest FSU analysis for more details and a new annotated graph.
>>> FEATURED STOCK ARTICLE : Testing 50-Day Moving Average Line After Wedging to New High - 7/19/2024 |
View all notes |
Set NEW NOTE alert |
Company Profile |
SEC
News |
Chart |
Request a new note
C
A
S
I |
ELF
-
NYSE
e.l.f. Beauty
Cosmetics/Personal Care
|
$177.52
|
+6.58
3.85% |
$177.98
|
1,596,665
99.54% of 50 DAV
50 DAV is 1,604,000
|
$221.83
-19.97%
|
6/18/2024
|
$212.40
|
PP = $221.93
|
|
MB = $233.03
|
Most Recent Note - 7/19/2024 4:53:31 PM
G - Halted its slide after 3 consecutive losses this week with above-average volume violated its 50 DMA line ($188) triggering a technical sell signal. A rebound above the 50 DMA line is needed for this outlook to improve.
>>> FEATURED STOCK ARTICLE : Challenging Prior Resistance Area - 7/12/2024 |
View all notes |
Set NEW NOTE alert |
Company Profile |
SEC
News |
Chart |
Request a new note
C
A
S
I |
CRWD
-
NASDAQ
CrowdStrike Holdings
Computer Sftwr-Security
|
$304.96
|
-38.09
-11.10% |
$316.75
|
41,767,901
807.73% of 50 DAV
50 DAV is 5,171,000
|
$398.33
-23.44%
|
5/28/2024
|
$351.47
|
PP = $365.10
|
|
MB = $383.36
|
Most Recent Note - 7/19/2024 1:32:33 PM
Gapped down today for a big 4th consecutive loss with heavy volume testing its 200 DMA line. It will be dropped from the Featured Stocks list tonight. Violated prior highs in the $358-365 area and undercut its 50 DMA line ($358) triggering technical sell signals. A rebound above the 50 DMA line is needed for its outlook to improve.
>>> FEATURED STOCK ARTICLE : Consolidating Near Prior Highs Which Define Support - 7/15/2024 |
View all notes |
Set NEW NOTE alert |
Company Profile |
SEC
News |
Chart |
Request a new note
C
A
S
I |
Symbol/Exchange
Company Name
Industry Group |
PRICE |
CHANGE
(%Change) |
Day High |
Volume
(% DAV)
(% 50 day avg vol) |
52 Wk Hi
% From Hi |
Featured
Date |
Price
Featured |
Pivot Featured |
|
Max Buy |
NVO
-
NYSE
Novo Nordisk ADR
Medical-Ethical Drugs
|
$131.54
|
+1.55
1.19% |
$133.50
|
3,778,608
99.86% of 50 DAV
50 DAV is 3,784,000
|
$148.15
-11.21%
|
6/7/2024
|
$143.06
|
PP = $138.38
|
|
MB = $145.30
|
Most Recent Note - 7/18/2024 12:01:52 PM
G - Abruptly slumping with heavier volume behind today's damaging loss. Color code was changed to green after violating its 50 DMA line ($138.08) raising concerns and triggering a technical sell signal. Only a prompt rebound above the 50 DMA line would help its outlook improve. Fundamentals remain strong.
>>> FEATURED STOCK ARTICLE : Perched Near All-Time High Following Recent Gap Up With Volume - 7/1/2024 |
View all notes |
Set NEW NOTE alert |
Company Profile |
SEC
News |
Chart |
Request a new note
C
A
S
I |
GVA
-
NYSE
Granite Construction
Bldg-Heavy Construction
|
$64.55
|
-0.27
-0.42% |
$65.49
|
389,584
63.14% of 50 DAV
50 DAV is 617,000
|
$66.72
-3.25%
|
6/11/2024
|
$59.76
|
PP = $64.33
|
|
MB = $67.55
|
Most Recent Note - 7/17/2024 5:29:45 PM
Y - Pulled back today with lighter volume while retreating from its all-time high, breaking a streak of 5 consecutive gains. Prior highs in the $64 area define initial support to watch above its 50 DMA line ($61.79).
>>> FEATURED STOCK ARTICLE : Granite Testing Support at 50-Day Moving Average - 7/2/2024 |
View all notes |
Set NEW NOTE alert |
Company Profile |
SEC
News |
Chart |
Request a new note
C
A
S
I |
DDOG
-
NASDAQ
Datadog Inc
Computer Sftwr-Enterprse
|
$119.03
|
+0.21
0.18% |
$120.52
|
2,493,231
59.71% of 50 DAV
50 DAV is 4,175,900
|
$138.61
-14.13%
|
7/9/2024
|
$126.92
|
PP = $138.71
|
|
MB = $145.65
|
Most Recent Note - 7/18/2024 3:53:57 PM
G - Violated its 50 DMA line ($120.59) with today's loss raising concerns and its color code is changed to green. Only a prompt rebound above the 50 DMA line would help its outlook improve. The next important support is at its 200 DMA line ($117).
>>> FEATURED STOCK ARTICLE : Consolidating Within Close Range of 52-Week High - 7/9/2024 |
View all notes |
Set NEW NOTE alert |
Company Profile |
SEC
News |
Chart |
Request a new note
C
A
S
I |
|
|
|
THESE ARE NOT BUY RECOMMENDATIONS!
Comments contained in the body of this report are technical
opinions only. The material herein has been obtained
from sources believed to be reliable and accurate, however,
its accuracy and completeness cannot be guaranteed.
This site is not an investment advisor, hence it does
not endorse or recommend any securities or other investments.
Any recommendation contained in this report may not
be suitable for all investors and it is not to be deemed
an offer or solicitation on our part with respect to
the purchase or sale of any securities. All trademarks,
service marks and trade names appearing in this report
are the property of their respective owners, and are
likewise used for identification purposes only.
This report is a service available
only to active Paid Premium Members.
You may opt-out of receiving report notifications
at any time. Questions or comments may be submitted
by writing to Premium Membership Services 665 S.E. 10 Street, Suite 201 Deerfield Beach, FL 33441-5634 or by calling 1-800-965-8307
or 954-785-1121.
|
|
|