You are not logged in.
This means you
CAN ONLY VIEW reports that were published prior to Friday, April 18, 2025.
You
MUST UPGRADE YOUR MEMBERSHIP if you want to see any current reports.
AFTER MARKET UPDATE - WEDNESDAY, JULY 17TH, 2024
Previous After Market Report Next After Market Report >>>
|
|
|
|
DOW |
+243.60 |
41,198.08 |
+0.59% |
|
Volume |
996,135,000 |
+4% |
|
Volume |
6,038,528,500 |
+3% |
|
NASDAQ |
-512.42 |
17,996.92 |
-2.77% |
|
Advancers |
1,140 |
42% |
|
Advancers |
1,592 |
38% |
|
S&P 500 |
-78.93 |
5,588.27 |
-1.39% |
|
Decliners |
1,583 |
58% |
|
Decliners |
2,617 |
62% |
|
Russell 2000 |
-24.00 |
2,239.67 |
-1.06% |
|
52 Wk Highs |
297 |
|
|
52 Wk Highs |
363 |
|
|
S&P 600 |
-7.34 |
1,410.96 |
-0.52% |
|
52 Wk Lows |
5 |
|
|
52 Wk Lows |
37 |
|
|
 |
Major Indices Ended Mixed as Tech Weakness Pressured Nasdaq Composite
Kenneth J. Gruneisen - Passed the CAN SLIM® Master's Exam
The S&P 500 (-1.4%), Russell 2000 (-1.1%), and Nasdaq Composite (-2.8%) fell on Wednesday while the Dow Jones Industrial Average posted a standout gain of +0.59%. Volume was higher than the prior session totals on the NYSE and on the Nasdaq exchange. Breadth was negative as decliners led advancers by a 4-3 margin on the NYSE and by a 5-3 margin on the Nasdaq exchange. There were 127 high-ranked companies from the Leaders List that hit new 52-week highs and were listed on the BreakOuts Page, versus the total of 176 on the prior session. New 52-week highs totals contracted yet still solidly outnumbered new 52-week lows on both the NYSE and Nasdaq exchange. The major indices are in a confirmed uptrend (M criteria). Remember that any uptrend requires healthy leadership.
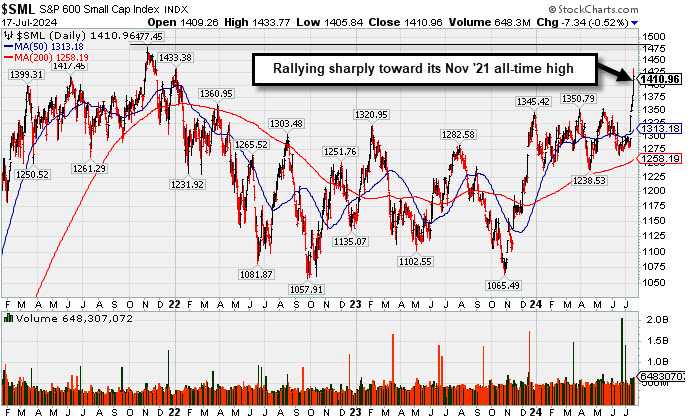 PICTURED: The S&P 600 Small Cap Index paused after a sharp spurt of 5 gains while quickly rallying toward its November 2021 all-time high.
NVIDIA (NVDA -6.62%), Meta Platforms (META -5.68%), and Broadcom (AVGO -7.91%) were standout decliners. Semiconductor stocks were also reacting to a Bloomberg report that the Biden Administration is discussing tightening export restrictions to China even further. Weakness in mega caps and chipmakers led the information technology (-3.7%) and communication services (-2.1%) sectors sharply lower.
Dow component Johnson & Johnson (JNJ +3.69%) rose after its Q2 earnings report, and UnitedHealth (UNH +4.45%) rose after an analyst upgrade. Bank stocks also outperformed the rest of the market. The SPDR S&P Regional Bank ETF (KRE) jumped +1.2% and the SPDR S&P Bank ETF (KBE) closed +0.9% higher. The S&P 500 financial sector was among the top performers today, logging a 0.9% gain.
The Fed's July Beige Book showed economic activity maintaining a slight to modest pace of growth in a majority of Districts this reporting cycle. The 2-yr note yield declined one basis point to 4.43% and the 10-yr note yield declined two basis points to 4.15%. There was solid demand for the latest $13 billion 20-yr bond sale.
|
 Kenneth J. Gruneisen started out as a licensed stockbroker in August 1987, a couple of months prior to the historic stock market crash that took the Dow Jones Industrial Average down -22.6% in a single day. He has published daily fact-based fundamental and technical analysis on high-ranked stocks online for two decades. Through FACTBASEDINVESTING.COM, Kenneth provides educational articles, news, market commentary, and other information regarding proven investment systems that work in good times and bad.
Comments contained in the body of this report are technical opinions only and are not necessarily those of Gruneisen Growth Corp. The material herein has been obtained from sources believed to be reliable and accurate, however, its accuracy and completeness cannot be guaranteed. Our firm, employees, and customers may effect transactions, including transactions contrary to any recommendation herein, or have positions in the securities mentioned herein or options with respect thereto. Any recommendation contained in this report may not be suitable for all investors and it is not to be deemed an offer or solicitation on our part with respect to the purchase or sale of any securities. |
|
 |
Semiconductor Index Led Decliners; Gold & Silver, Retail Indexes Fell
Kenneth J. Gruneisen - Passed the CAN SLIM® Master's Exam
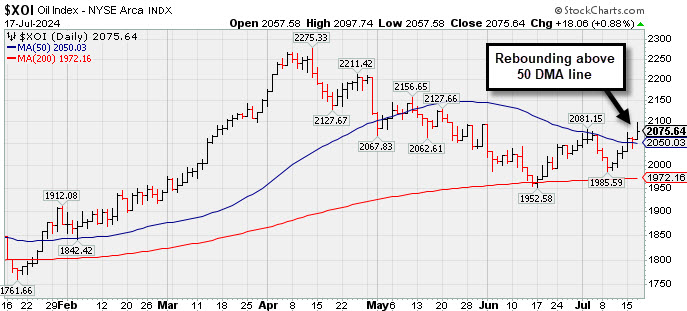
The Bank Index ($BKX +0.61%) rose but the Broker/Dealer Index ($XBD -0.55%) edged lower and the Retail Index ($RLX -1.64%) also created a drag on the major indices. The tech sector had a negative bias, led lower by the Semiconductor Index ($SOX -6.81%) while the Biotech Index ($BTK -0.88%) and the Networking Index ($NWX -0.56%) each posted smaller losses. The Gold & Silver Index ($XAU -1.92%) outpaced the Oil Services Index ($OSX -0.71%) to the downside.
PICTURED: The Integrated Oil Index ($XOI +0.88%) ended higher, rebounding above its 50-day moving average (DMA) line.
|
|
|
 |
Featured Stocks
Kenneth J. Gruneisen - Passed the CAN SLIM® Master's Exam
|
|
|
Color Codes Explained :
Y - Better candidates highlighted by our
staff of experts.
G - Previously featured
in past reports as yellow but may no longer be buyable under the
guidelines.
***Last / Change / Volume data in this table is the closing quote data***
Symbol/Exchange
Company Name
Industry Group |
PRICE |
CHANGE
(%Change) |
Day High |
Volume
(% DAV)
(% 50 day avg vol) |
52 Wk Hi
% From Hi |
Featured
Date |
Price
Featured |
Pivot Featured |
|
Max Buy |
 TDG
-
NYSE
TDG
-
NYSE
TransDigm Group
Aerospace/Defense
|
$1,241.47
|
-39.03
-3.05% |
$1,268.53
|
200,711
79.02% of 50 DAV
50 DAV is 254,000
|
$1,369.58
-9.35%
|
4/12/2024
|
$1,224.21
|
PP = $1,246.32
|
|
MB = $1,308.64
|
 Most Recent Note - 7/17/2024 5:31:13 PM
G - Pulled back today with lighter volume. Recently lingering below its 50 DMA line ($1,303) which is now downward sloping. It is -9.4% off its all-time high. A rebound above the 50 DMA line is needed to help its outlook improve. Fundamentals remain strong.
>>> FEATURED STOCK ARTICLE : Lingering Below 50-Day Moving Average But Only -7% Off High - 7/10/2024 |
View all notes |
Set NEW NOTE alert |
Company Profile |
SEC
News |
Chart |
Request a new note
C
A
S
I |
USLM
-
NASDAQ
U.S. Lime & Minerals
Bldg-Cement/Concrt/Ag
|
$78.12
|
-3.25
-3.99% |
$81.39
|
60,897
51.17% of 50 DAV
50 DAV is 119,000
|
$84.19
-7.21%
|
6/18/2024
|
$71.26
|
PP = $75.77
|
|
MB = $79.56
|
Most Recent Note - 7/17/2024 5:25:36 PM
Y - Pulled back today with below-average volume after hitting a new all-time high on the prior session. Found support while consolidating above its 50 DMA line ($71.50). Do not be confused as shares split 5:1 (Featured Price and Pivot Point were adjusted). Color code was changed to yellow with new pivot point cited based on its 5/15/24 high plus 10 cents as it was noted - " Subsequent gains above the pivot point backed by at least +40% above average volume may trigger a new (or add-on) technical buy signal."
>>> FEATURED STOCK ARTICLE : in Striking Distance of All-Time High After Volume-Driven Gains - 6/28/2024 |
View all notes |
Set NEW NOTE alert |
Company Profile |
SEC
News |
Chart |
Request a new note
C
A
S
I |
CLS
-
NYSE
Celestica
Elec-Contract Mfg
|
$56.84
|
-6.43
-10.16% |
$61.50
|
4,479,831
212.52% of 50 DAV
50 DAV is 2,108,000
|
$63.49
-10.47%
|
7/6/2024
|
$57.62
|
PP = $61.16
|
|
MB = $64.22
|
Most Recent Note - 7/17/2024 11:58:45 AM
Y - Pulling back today after quietly touching a new all-time high on the prior session. Repeatedly noted - "A gain backed by at least +40% above average volume and a close above the new pivot point cited based on its 5/28/24 high plus 10 cents may trigger a proper technical buy signal. Important support is at its 50 DMA line ($54.60)."
>>> FEATURED STOCK ARTICLE : Consolidating Above Prior Highs in an Orderly Fashion - 6/27/2024 |
View all notes |
Set NEW NOTE alert |
Company Profile |
SEC
News |
Chart |
Request a new note
C
A
S
I |
ELF
-
NYSE
e.l.f. Beauty
Cosmetics/Personal Care
|
$170.70
|
-18.32
-9.69% |
$185.52
|
1,974,539
126.33% of 50 DAV
50 DAV is 1,563,000
|
$221.83
-23.05%
|
6/18/2024
|
$212.40
|
PP = $221.93
|
|
MB = $233.03
|
Most Recent Note - 7/17/2024 5:20:05 PM
G - Color code is changed to green after a 3rd consecutive loss with above-average volume today violated its 50 DMA line ($187) triggering a technical sell signal. A rebound above the 50 DMA line is needed for this outlook to improve.
>>> FEATURED STOCK ARTICLE : Challenging Prior Resistance Area - 7/12/2024 |
View all notes |
Set NEW NOTE alert |
Company Profile |
SEC
News |
Chart |
Request a new note
C
A
S
I |
PDD
-
NASDAQ
PDD Holdings ADR
Retail-Internet
|
$131.82
|
-4.02
-2.96% |
$134.72
|
9,054,421
101.68% of 50 DAV
50 DAV is 8,905,000
|
$164.69
-19.96%
|
5/24/2024
|
$161.85
|
PP = $153.09
|
|
MB = $160.74
|
Most Recent Note - 7/17/2024 5:23:31 PM
Today's 3rd consecutive loss is testing near its prior low and 200 DMA line ($129.50) which coincide defining important near-term support. It may find support but a rebound above the 50 DMA line is needed for its outlook to improve. It will be dropped from the Featured Stocks list tonight.
>>> FEATURED STOCK ARTICLE : Sputtering Below 50-Day Moving Average Line - 7/11/2024 |
View all notes |
Set NEW NOTE alert |
Company Profile |
SEC
News |
Chart |
Request a new note
C
A
S
I |
Symbol/Exchange
Company Name
Industry Group |
PRICE |
CHANGE
(%Change) |
Day High |
Volume
(% DAV)
(% 50 day avg vol) |
52 Wk Hi
% From Hi |
Featured
Date |
Price
Featured |
Pivot Featured |
|
Max Buy |
CRWD
-
NASDAQ
CrowdStrike Holdings
Computer Sftwr-Security
|
$354.94
|
-14.11
-3.82% |
$363.60
|
3,436,980
66.75% of 50 DAV
50 DAV is 5,149,000
|
$398.33
-10.89%
|
5/28/2024
|
$351.47
|
PP = $365.10
|
|
MB = $383.36
|
Most Recent Note - 7/17/2024 5:27:56 PM
G - Color code is changed to green after today's gap down and loss on light volume violated prior highs in the $358-365 area and undercut its 50 DMA line ($357) triggering technical sell signals. A reboud above the 50 DMA line is needed for its outlook to improve.
>>> FEATURED STOCK ARTICLE : Consolidating Near Prior Highs Which Define Support - 7/15/2024 |
View all notes |
Set NEW NOTE alert |
Company Profile |
SEC
News |
Chart |
Request a new note
C
A
S
I |
NVO
-
NYSE
Novo Nordisk ADR
Medical-Ethical Drugs
|
$135.42
|
-5.45
-3.87% |
$136.62
|
6,040,465
165.67% of 50 DAV
50 DAV is 3,646,000
|
$148.15
-8.59%
|
6/7/2024
|
$143.06
|
PP = $138.38
|
|
MB = $145.30
|
Most Recent Note - 7/17/2024 12:24:57 PM
G - Color code is changed to green after gapping down today undercutting prior highs in the $138 area and violating its 50 DMA line ($138.08) raising concerns and triggering a technical sell signal. Only a prompt rebound above the 50 DMA line would help its outlook improve. Fundamentals remain strong.
>>> FEATURED STOCK ARTICLE : Perched Near All-Time High Following Recent Gap Up With Volume - 7/1/2024 |
View all notes |
Set NEW NOTE alert |
Company Profile |
SEC
News |
Chart |
Request a new note
C
A
S
I |
GVA
-
NYSE
Granite Construction
Bldg-Heavy Construction
|
$64.60
|
-1.73
-2.61% |
$66.58
|
427,417
68.50% of 50 DAV
50 DAV is 624,000
|
$66.72
-3.18%
|
6/11/2024
|
$59.76
|
PP = $64.33
|
|
MB = $67.55
|
Most Recent Note - 7/17/2024 5:29:45 PM
Y - Pulled back today with lighter volume while retreating from its all-time high, breaking a streak of 5 consecutive gains. Prior highs in the $64 area define initial support to watch above its 50 DMA line ($61.79).
>>> FEATURED STOCK ARTICLE : Granite Testing Support at 50-Day Moving Average - 7/2/2024 |
View all notes |
Set NEW NOTE alert |
Company Profile |
SEC
News |
Chart |
Request a new note
C
A
S
I |
DDOG
-
NASDAQ
Datadog Inc
Computer Sftwr-Enterprse
|
$121.16
|
-9.61
-7.35% |
$125.07
|
6,757,254
162.56% of 50 DAV
50 DAV is 4,156,800
|
$138.61
-12.59%
|
7/9/2024
|
$126.92
|
PP = $138.71
|
|
MB = $145.65
|
Most Recent Note - 7/17/2024 12:00:08 PM
Y - Gapped down today testing its 50 DMA line ($120.75) after 4 consecutive gains backed by below-average volume. More damaging losses would raise concerns. Subsequent gains above the pivot point backed by at least +40% above average volume may trigger a technical buy signal.
>>> FEATURED STOCK ARTICLE : Consolidating Within Close Range of 52-Week High - 7/9/2024 |
View all notes |
Set NEW NOTE alert |
Company Profile |
SEC
News |
Chart |
Request a new note
C
A
S
I |
|
|
|
THESE ARE NOT BUY RECOMMENDATIONS!
Comments contained in the body of this report are technical
opinions only. The material herein has been obtained
from sources believed to be reliable and accurate, however,
its accuracy and completeness cannot be guaranteed.
This site is not an investment advisor, hence it does
not endorse or recommend any securities or other investments.
Any recommendation contained in this report may not
be suitable for all investors and it is not to be deemed
an offer or solicitation on our part with respect to
the purchase or sale of any securities. All trademarks,
service marks and trade names appearing in this report
are the property of their respective owners, and are
likewise used for identification purposes only.
This report is a service available
only to active Paid Premium Members.
You may opt-out of receiving report notifications
at any time. Questions or comments may be submitted
by writing to Premium Membership Services 665 S.E. 10 Street, Suite 201 Deerfield Beach, FL 33441-5634 or by calling 1-800-965-8307
or 954-785-1121.
|
|
|