You are not logged in.
This means you
CAN ONLY VIEW reports that were published prior to Monday, April 7, 2025.
You
MUST UPGRADE YOUR MEMBERSHIP if you want to see any current reports.
AFTER MARKET UPDATE - FRIDAY, JULY 1ST, 2022
Previous After Market Report Next After Market Report >>>
|
|
|
|
DOW |
+321.83 |
31,097.26 |
+1.05% |
|
Volume |
929,425,991 |
-26% |
|
Volume |
4,803,618,900 |
-14% |
|
NASDAQ |
+99.11 |
11,127.85 |
+0.90% |
|
Advancers |
2,334 |
76% |
|
Advancers |
2,537 |
61% |
|
S&P 500 |
+39.99 |
3,825.37 |
+1.06% |
|
Decliners |
740 |
24% |
|
Decliners |
1,615 |
39% |
|
Russell 2000 |
+19.77 |
1,727.76 |
+1.16% |
|
52 Wk Highs |
12 |
|
|
52 Wk Highs |
15 |
|
|
S&P 600 |
+10.54 |
1,138.51 |
+0.93% |
|
52 Wk Lows |
205 |
|
|
52 Wk Lows |
318 |
|
|
The nascent market uptrend has come under pressure (M criteria). Few if any leaders have been action-worthy as we have reminded members repeatedly that new buying efforts are justified only in stocks meeting all key criteria of the fact-based investment system.
|
 |
Major Indices Posted Gains With Lighter Volume Totals
Kenneth J. Gruneisen - Passed the CAN SLIM® Master's Exam
The benchmark S&P 500 Index reversed early session losses to climb 1.1%, though still posted a 2.2% weekly decline. The Dow jumped 321 points, trimming its five-day drawdown to 1.3%. The Nasdaq Composite added 0.9%, but still notched a weekly loss of 4.1%. Volume totals reported were lighter than the prior session on the NYSE and on the Nasdaq exchange, cooling ahead of the long weekend with markets closed on Independence Day. Advancers led decliners by a 3-1 margin on the NYSE and by 5-3 on the Nasdaq exchange. There were 6 high-ranked companies from the Leaders List that hit new 52-week highs and were listed on the BreakOuts Page, versus the total of 3 on the prior session. New 52-week lows totals still solidly outnumbered new 52-week highs on the NYSE and on the Nasdaq exchange. Solid gains from all major averages last Friday with much higher volume, coupled with an increase in the number of stocks hitting new highs, marked a powerful follow-through day confirming a new market uptrend (M criteria). However, any sustainable rally requires a healthy crop of leading stocks hitting new highs and leadership has been very thin.
Chart courtesy of www.stockcharts.com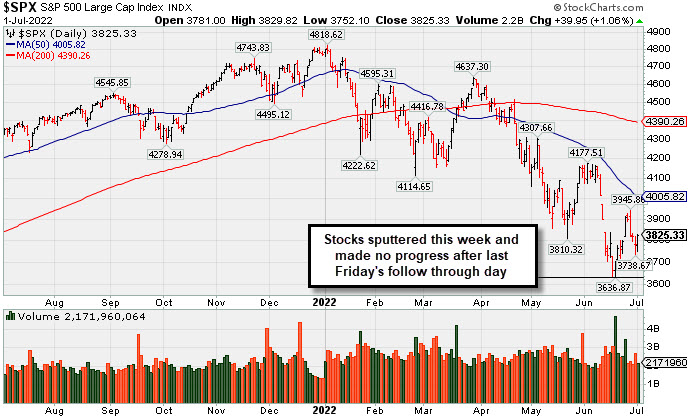 PICTURED: The S&P 500 Index posted a gain on Friday after slumping all week. It remains well below its 50-day and 200-day moving average (DMA) lines.
U.S. stocks staged an afternoon relief rally on Friday as Wall Street attempted to recover from the worst first half performance for the S&P 500 since 1970. Some attributed the day’s volatility to lighter than usual trading volume ahead of the holiday weekend.
Market participants seemed to overlook a disappointing update from the Institute for Supply Management (ISM). Their gauge of manufacturing activity fell to a two-year low of 53.0 in June from May’s 56.1 print. The new orders component contracted to 49.2 versus the prior month’s 55.1, marking the lowest reading since May 2020. Still, the release renewed worries of a looming recession, inspiring Treasuries to extend their recent rally. The yield on the 10-year note slumped 14 basis points (0.14%) to 2.88%, settling 25 basis points (0.25%) below where it ended last Friday (June 24). Meanwhile, the U.S. dollar rose 0.4% against a basket of its peers. In commodities, West Texas Intermediate crude climbed 2.3% to $108.16/barrel as disruptions in Libyan oil exports overshadowed prospects of dimming near-term demand prospects. Meanwhile, the industrial metal copper sank to a 17-month low.
All 11 S&P 500 sectors finished in positive territory, with the Utilities group pacing the gains with a 2.5% advance. Information Technology stocks underperformed on a relative basis, as a downbeat outlook from Micron Technology Inc. (MU -2.95%) weighed on chipmakers.
|
 Kenneth J. Gruneisen started out as a licensed stockbroker in August 1987, a couple of months prior to the historic stock market crash that took the Dow Jones Industrial Average down -22.6% in a single day. He has published daily fact-based fundamental and technical analysis on high-ranked stocks online for two decades. Through FACTBASEDINVESTING.COM, Kenneth provides educational articles, news, market commentary, and other information regarding proven investment systems that work in good times and bad.
Comments contained in the body of this report are technical opinions only and are not necessarily those of Gruneisen Growth Corp. The material herein has been obtained from sources believed to be reliable and accurate, however, its accuracy and completeness cannot be guaranteed. Our firm, employees, and customers may effect transactions, including transactions contrary to any recommendation herein, or have positions in the securities mentioned herein or options with respect thereto. Any recommendation contained in this report may not be suitable for all investors and it is not to be deemed an offer or solicitation on our part with respect to the purchase or sale of any securities. |
|
 |
Retail, Financial, Biotech, and Gold & Silver Indexes Rose
Kenneth J. Gruneisen - Passed the CAN SLIM® Master's Exam
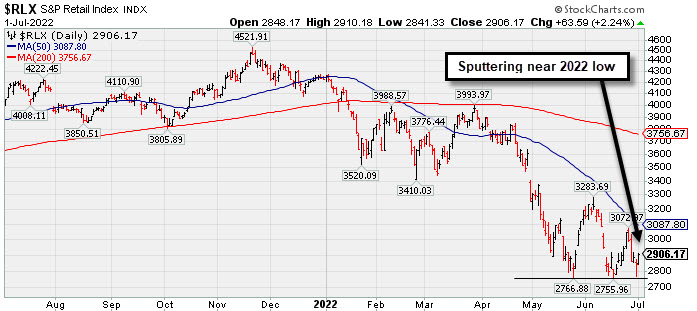
The Retail Index ($RLX +2.24%) and Bank Index ($BKX +1.53%) both posted solid gains and the Broker/Dealer Index ($XBD +0.62%) edged higher. The Gold & Silver Index ($XAU +2.68%) and Integrated Oil Index ($XOI +1.11%) posted gains while the Oil Services Index ($OSX -0.32%) edged lower. The tech sector was mixed as Semiconductor Index ($SOX -3.83%) slumped and the Networking Index ($NWX -0.54%) edged lower while the Biotech Index ($BTK +2.53%) posted a solid gain.
PICTURED: The Retail Index ($RLX +2.24%) posted a gain on Friday while still sputtering near its 2022 low, well below its 50-day and 200-day moving average (DMA) lines.
| Oil Services |
$OSX |
66.07 |
-0.21 |
-0.32% |
+25.33% |
| Integrated Oil |
$XOI |
1,509.22 |
+16.62 |
+1.11% |
+28.10% |
| Semiconductor |
$SOX |
2,458.46 |
-97.80 |
-3.83% |
-37.70% |
| Networking |
$NWX |
677.64 |
-3.70 |
-0.54% |
-30.22% |
| Broker/Dealer |
$XBD |
383.65 |
+2.36 |
+0.62% |
-21.20% |
| Retail |
$RLX |
2,906.17 |
+63.59 |
+2.24% |
-31.24% |
| Gold & Silver |
$XAU |
114.10 |
+2.98 |
+2.68% |
-13.85% |
| Bank |
$BKX |
102.56 |
+1.55 |
+1.53% |
-22.43% |
| Biotech |
$BTK |
4,743.94 |
+117.13 |
+2.53% |
-14.03% |
|
|
|
 |
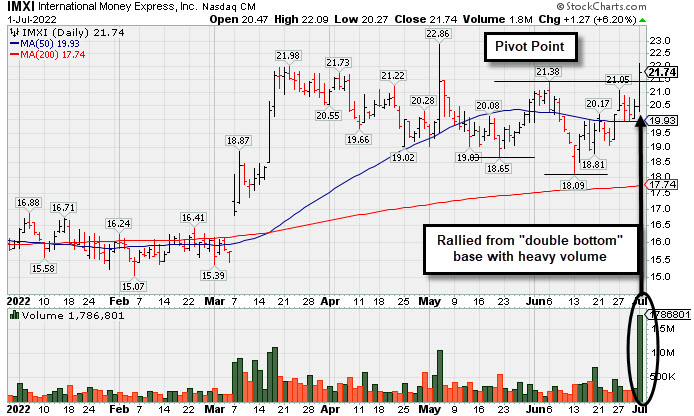
Volume Heavy While Rallying from Double Bottom Base
Kenneth J. Gruneisen - Passed the CAN SLIM® Master's Exam
International Money Express (IMXI +$1.30 or +6.35% to $21.77) finished strong today after highlighted in yellow in the earlier mid-day report (read here) with new pivot point cited based on its 6/06/22 high. The big gain above the pivot point was backed by +438% above average volume triggering a technical buy signal. Very little resistance remains due to overhead supply. The recent rebound above its 50-day moving average (DMA) line ($19.92) helped its outlook improve. It found support above its 200 DMA line since dropped from the Featured Stocks list on 5/20/22. It was last shown with detailed analysis on 5/12/22 with an annotated graph under the headline, "Fell Below 50-Day Moving Average Line Testing Prior Highs".
IMXI has a 96 Earnings Per Share rating. It reported Mar '22 quarterly earnings +26% on +21% sales revenues versus the year ago period. The Financial Services-Specialty firm's quarterly and annual earnings (C and A criteria) history has been strong and backed by solid sales revenues growth. The past 7 quarterly comparisons showed earnings increases above the year ago period by more than +25% (C criteria).
There is a small supply of only 38.4 million shares outstanding (S criteria) which can contribute to greater price volatility in the event of institutional buying or selling. The number of top-rated funds owning its shares rose from 210 in Mar '21 to 276 in Mar '221, a reassuring sign concerning the I criteria. Its current Up/Down Volume Ratio of 1.2 is an unbiased indication its shares have been under accumulation over the past 50 days. |
|
|
Color Codes Explained :
Y - Better candidates highlighted by our
staff of experts.
G - Previously featured
in past reports as yellow but may no longer be buyable under the
guidelines.
***Last / Change / Volume data in this table is the closing quote data***
|
|
|
THESE ARE NOT BUY RECOMMENDATIONS!
Comments contained in the body of this report are technical
opinions only. The material herein has been obtained
from sources believed to be reliable and accurate, however,
its accuracy and completeness cannot be guaranteed.
This site is not an investment advisor, hence it does
not endorse or recommend any securities or other investments.
Any recommendation contained in this report may not
be suitable for all investors and it is not to be deemed
an offer or solicitation on our part with respect to
the purchase or sale of any securities. All trademarks,
service marks and trade names appearing in this report
are the property of their respective owners, and are
likewise used for identification purposes only.
This report is a service available
only to active Paid Premium Members.
You may opt-out of receiving report notifications
at any time. Questions or comments may be submitted
by writing to Premium Membership Services 665 S.E. 10 Street, Suite 201 Deerfield Beach, FL 33441-5634 or by calling 1-800-965-8307
or 954-785-1121.
|
|
|