You are not logged in.
This means you
CAN ONLY VIEW reports that were published prior to Sunday, April 6, 2025.
You
MUST UPGRADE YOUR MEMBERSHIP if you want to see any current reports.
AFTER MARKET UPDATE - TUESDAY, JULY 5TH, 2022
Previous After Market Report Next After Market Report >>>
|
|
|
|
DOW |
-129.44 |
30,967.82 |
-0.42% |
|
Volume |
1,209,256,482 |
+30% |
|
Volume |
5,020,212,500 |
+5% |
|
NASDAQ |
+194.39 |
11,322.24 |
+1.75% |
|
Advancers |
1,426 |
46% |
|
Advancers |
2,421 |
56% |
|
S&P 500 |
+6.06 |
3,831.39 |
+0.16% |
|
Decliners |
1,695 |
54% |
|
Decliners |
1,885 |
44% |
|
Russell 2000 |
+13.57 |
1,741.33 |
+0.79% |
|
52 Wk Highs |
4 |
|
|
52 Wk Highs |
20 |
|
|
S&P 600 |
+1.56 |
1,140.07 |
+0.14% |
|
52 Wk Lows |
313 |
|
|
52 Wk Lows |
483 |
|
|
 |
Major Averages Were Mixed With Leadership Remaining Thin
Kenneth J. Gruneisen - Passed the CAN SLIM® Master's Exam
The S&P 500 erased an earlier loss of more than 2% to end modestly higher (+0.2%), though still in bear market territory (defined as a 20% drawdown from a recent peak). The Dow shed 129 points, while the Nasdaq Composite jumped 1.8% as tech shares outperformed amid a drop in Treasury yields. Volume totals reported were higher than the prior session on the NYSE and on the Nasdaq exchange. Advancers led decliners by a 4-3 margin on the Nasdaq exchange while decliners led advancers by an 8-7 margin on the NYSE. There were 4 high-ranked companies from the Leaders List that hit new 52-week highs and were listed on the BreakOuts Page, versus the total of 6 on the prior session. New 52-week lows totals expanded and solidly outnumbered new 52-week highs on the NYSE and on the Nasdaq exchange. The brief new market uptrend is already under pressure (M criteria). Any sustainable rally requires a healthy crop of leading stocks hitting new highs, but leadership has been very thin.
Chart courtesy of www.stockcharts.com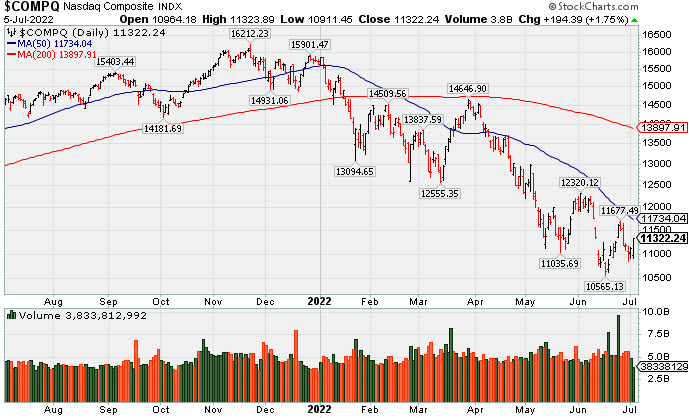 PICTURED: The Nasdaq Composite Index posted a gain. It remains well below its 50-day and 200-day moving average (DMA) lines.
U.S. stocks finished mixed on Tuesday as worries over a possible looming recession continue to grip financial markets. Investors are contending with a litany of headwinds, including persistent inflation, swift monetary policy tightening, weakening economic data, and the downside risk to earnings estimates. The yield on the 10-year note fell six basis points (0.06%) to 2.82%, while the yield on the shorter-dated two-year note briefly surpassed the longer benchmark rate. This closely watched inversion of the yield curve has historically been a harbinger of a recession--widely defined as two consecutive quarters of negative economic growth. Meanwhile, West Texas Intermediate crude slumped 8.1% to $99.68/barrel, slipping below the $100/barrel mark for the first time in nearly two months. A stronger U.S. dollar also pressured commodities, with a gauge of the greenback surging 1.3%.
Eight of 11 S&P 500 sectors closed in negative territory, with Energy leading the decline. More cyclical-oriented groups also trailed, while growth-related shares bucked the downtrend. Market participants also weighed U.S.-China trade talks that could result in the dialing back of levies on Chinese imports. However, Wall Street pundits seemed to agree that any tariff relief would likely have a limited effect on easing inflationary pressures.
|
 Kenneth J. Gruneisen started out as a licensed stockbroker in August 1987, a couple of months prior to the historic stock market crash that took the Dow Jones Industrial Average down -22.6% in a single day. He has published daily fact-based fundamental and technical analysis on high-ranked stocks online for two decades. Through FACTBASEDINVESTING.COM, Kenneth provides educational articles, news, market commentary, and other information regarding proven investment systems that work in good times and bad.
Comments contained in the body of this report are technical opinions only and are not necessarily those of Gruneisen Growth Corp. The material herein has been obtained from sources believed to be reliable and accurate, however, its accuracy and completeness cannot be guaranteed. Our firm, employees, and customers may effect transactions, including transactions contrary to any recommendation herein, or have positions in the securities mentioned herein or options with respect thereto. Any recommendation contained in this report may not be suitable for all investors and it is not to be deemed an offer or solicitation on our part with respect to the purchase or sale of any securities. |
|
 |
Commodity-Linked Groups Fell; Retail, Broker/Dealer and Biotech Rose
Kenneth J. Gruneisen - Passed the CAN SLIM® Master's Exam
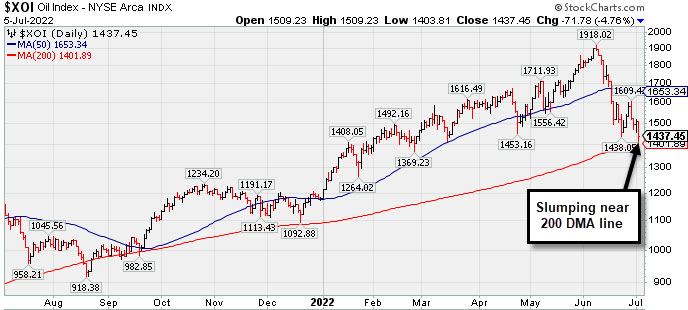
The Retail Index ($RLX +2.81%) and Broker/Dealer Index ($XBD +2.98%) both posted influential gains while the Bank Index ($BKX -0.15%) sputtered. The Biotech Index ($BTK +1.63%) led the tech sector higher while the Semiconductor Index ($SOX +0.78%) and Networking Index ($NWX +0.43%) both posted smaller gains. Commodity-linked groups slumped as the Gold & Silver Index ($XAU -5.22%), Oil Services Index ($OSX -6.44%), and Integrated Oil Index ($XOI -4.76%) each suffered a big loss.
PICTURED: The Integrated Oil Index ($XOI -4.76%) slumped near its 200-day moving average (DMA) line.
| Oil Services |
$OSX |
61.82 |
-4.26 |
-6.44% |
+17.26% |
| Integrated Oil |
$XOI |
1,437.45 |
-71.78 |
-4.76% |
+22.00% |
| Semiconductor |
$SOX |
2,477.64 |
+19.19 |
+0.78% |
-37.21% |
| Networking |
$NWX |
680.57 |
+2.93 |
+0.43% |
-29.92% |
| Broker/Dealer |
$XBD |
395.10 |
+11.44 |
+2.98% |
-18.85% |
| Retail |
$RLX |
2,987.69 |
+81.52 |
+2.81% |
-29.31% |
| Gold & Silver |
$XAU |
108.15 |
-5.95 |
-5.22% |
-18.35% |
| Bank |
$BKX |
102.40 |
-0.16 |
-0.15% |
-22.55% |
| Biotech |
$BTK |
4,821.08 |
+77.13 |
+1.63% |
-12.64% |
|
|
|
 |
Featured Stocks
Kenneth J. Gruneisen - Passed the CAN SLIM® Master's Exam
|
|
|
Color Codes Explained :
Y - Better candidates highlighted by our
staff of experts.
G - Previously featured
in past reports as yellow but may no longer be buyable under the
guidelines.
***Last / Change / Volume data in this table is the closing quote data***
|
|
|
THESE ARE NOT BUY RECOMMENDATIONS!
Comments contained in the body of this report are technical
opinions only. The material herein has been obtained
from sources believed to be reliable and accurate, however,
its accuracy and completeness cannot be guaranteed.
This site is not an investment advisor, hence it does
not endorse or recommend any securities or other investments.
Any recommendation contained in this report may not
be suitable for all investors and it is not to be deemed
an offer or solicitation on our part with respect to
the purchase or sale of any securities. All trademarks,
service marks and trade names appearing in this report
are the property of their respective owners, and are
likewise used for identification purposes only.
This report is a service available
only to active Paid Premium Members.
You may opt-out of receiving report notifications
at any time. Questions or comments may be submitted
by writing to Premium Membership Services 665 S.E. 10 Street, Suite 201 Deerfield Beach, FL 33441-5634 or by calling 1-800-965-8307
or 954-785-1121.
|
|
|