You are not logged in.
This means you
CAN ONLY VIEW reports that were published prior to Friday, April 18, 2025.
You
MUST UPGRADE YOUR MEMBERSHIP if you want to see any current reports.
AFTER MARKET UPDATE - THURSDAY, JUNE 30TH, 2022
Previous After Market Report Next After Market Report >>>
|
|
|
|
DOW |
-253.88 |
30,775.43 |
-0.82% |
|
Volume |
1,256,596,584 |
+36% |
|
Volume |
5,568,382,500 |
+1% |
|
NASDAQ |
-149.16 |
11,028.74 |
-1.33% |
|
Advancers |
1,214 |
39% |
|
Advancers |
1,890 |
43% |
|
S&P 500 |
-33.45 |
3,785.38 |
-0.88% |
|
Decliners |
1,893 |
61% |
|
Decliners |
2,527 |
57% |
|
Russell 2000 |
-11.38 |
1,707.99 |
-0.66% |
|
52 Wk Highs |
12 |
|
|
52 Wk Highs |
18 |
|
|
S&P 600 |
-4.37 |
1,127.97 |
-0.39% |
|
52 Wk Lows |
342 |
|
|
52 Wk Lows |
532 |
|
|
The nascent market uptrend has come under pressure (M criteria). Few if any leaders have been action-worthy as we have reminded members repeatedly that new buying efforts are justified only in stocks meeting all key criteria of the fact-based investment system.
|
 |
Major Indices Slump With Higher Volume Again
Kenneth J. Gruneisen - Passed the CAN SLIM® Master's Exam
The S&P 500 lost 0.9% and capped its worst start to a year since 1970 with an 8.4% monthly decline. The Dow shed 253 points, extending its June drawdown to 6.7%. Both benchmarks notched their largest quarterly losses since the pandemic-induced slump during the start of 2020, falling 16.5% and 11.3%, respectively. Meanwhile, the Nasdaq Composite lost 1.3% for the day and 8.7% for the month, pushing the index to its worst three-month period since 2008 (-22.4%). Volume totals reported were higher than the prior session on the NYSE and on the Nasdaq exchange, indicative of greater institutional selling pressure termed "distribution". Decliners led advancers by a 3-2 margin on the NYSE and by 5-4 on the Nasdaq exchange. There were 3 high-ranked companies from the Leaders List that hit new 52-week highs and were listed on the BreakOuts Page, versus the total of 1 on the prior session. New 52-week lows totals expanded and solidly outnumbered new 52-week highs on the NYSE and on the Nasdaq exchange. Solid gains from all major averages last Friday with much higher volume, coupled with an increase in the number of stocks hitting new highs, marked a powerful follow-through day confirming a new market uptrend (M criteria). However, any sustainable rally requires a healthy crop of leading stocks hitting new highs and leadership has been very thin.
Chart courtesy of www.stockcharts.com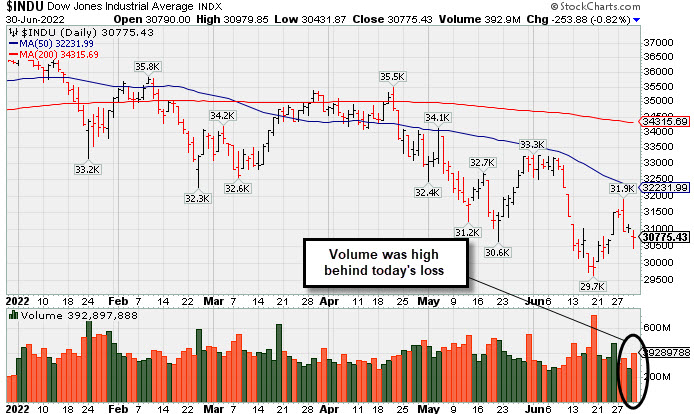 PICTURED: The Dow Jones Industrial Average suffered a loss with higher volume. It remains well below its 50-day and 200-day moving average (DMA) lines.
U.S. stocks finished firmly lower on Thursday, as a disappointing update on consumer spending renewed recessionary concerns. On the data front, personal spending rose just 0.2% in May, while real personal spending (adjusted for inflation) declined 0.4%. Separately, the MNI Chicago Purchasing Managers’ Index (PMI) print dipped more than forecasted. Another release revealed weekly initial jobless claims came in at 231,000, near the highest level since January. Offering a bright spot, the core PCE Deflator (the Federal Reserve’s preferred proxy for inflation) climbed 4.7% year-over-year last month, the smallest gain since November. Treasuries strengthened, with the yield on the two-year note settling below 3% for the first time since early June. The benchmark 10-year note yield shed 0.07% to 3.02%.
Eight of 11 S&P 500 sectors finished in negative territory, with Utilities, Industrials and Real Estate bucking the downtrend. Energy lagged with West Texas Intermediate crude falling 3.7% to $105.73/barrel, posting its first monthly decline since November. Adding to downbeat sentiment, luxury furniture retailer RH (RH -10.56%) fell after slashing its 2022 outlook for the second time in less than a month.
|
 Kenneth J. Gruneisen started out as a licensed stockbroker in August 1987, a couple of months prior to the historic stock market crash that took the Dow Jones Industrial Average down -22.6% in a single day. He has published daily fact-based fundamental and technical analysis on high-ranked stocks online for two decades. Through FACTBASEDINVESTING.COM, Kenneth provides educational articles, news, market commentary, and other information regarding proven investment systems that work in good times and bad.
Comments contained in the body of this report are technical opinions only and are not necessarily those of Gruneisen Growth Corp. The material herein has been obtained from sources believed to be reliable and accurate, however, its accuracy and completeness cannot be guaranteed. Our firm, employees, and customers may effect transactions, including transactions contrary to any recommendation herein, or have positions in the securities mentioned herein or options with respect thereto. Any recommendation contained in this report may not be suitable for all investors and it is not to be deemed an offer or solicitation on our part with respect to the purchase or sale of any securities. |
|
 |
Financial, Retail, Tech, and Commodity-Linked Groups Fell
Kenneth J. Gruneisen - Passed the CAN SLIM® Master's Exam
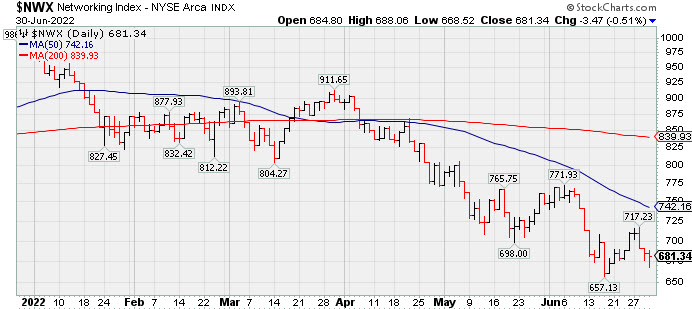
The Broker/Dealer Index ($XBD -1.34%), Bank Index ($BKX -1.64%), and Retail Index ($RLX -1.59%) each lost ground. The Semiconductor Index ($SOX -1.07%) led the tech sector lower while the Networking Index ($NWX -0.51%) and Biotech Index ($BTK -0.50%) both suffered smaller losses. Commodity-linked groups had a negative bias as the Gold & Silver Index ($XAU -4.04%) outpaced the Oil Services Index ($OSX -2.24%) and Integrated Oil Index ($XOI -1.85%) to the downside.
PICTURED: The Networking Index ($NWX -0.51%) is sputtering near its 2022 low, well below its 50-day and 200-day moving average (DMA) lines.
| Oil Services |
$OSX |
66.29 |
-1.52 |
-2.24% |
+25.74% |
| Integrated Oil |
$XOI |
1,492.60 |
-28.07 |
-1.85% |
+26.68% |
| Semiconductor |
$SOX |
2,556.25 |
-27.73 |
-1.07% |
-35.22% |
| Networking |
$NWX |
681.34 |
-3.47 |
-0.51% |
-29.84% |
| Broker/Dealer |
$XBD |
381.29 |
-5.18 |
-1.34% |
-21.68% |
| Retail |
$RLX |
2,842.58 |
-45.96 |
-1.59% |
-32.74% |
| Gold & Silver |
$XAU |
111.12 |
-4.67 |
-4.04% |
-16.11% |
| Bank |
$BKX |
101.01 |
-1.68 |
-1.64% |
-23.60% |
| Biotech |
$BTK |
4,626.81 |
-23.44 |
-0.50% |
-16.16% |
|
|
|
 |
Featured Stocks
Kenneth J. Gruneisen - Passed the CAN SLIM® Master's Exam
|
|
|
Color Codes Explained :
Y - Better candidates highlighted by our
staff of experts.
G - Previously featured
in past reports as yellow but may no longer be buyable under the
guidelines.
***Last / Change / Volume data in this table is the closing quote data***
|
|
|
THESE ARE NOT BUY RECOMMENDATIONS!
Comments contained in the body of this report are technical
opinions only. The material herein has been obtained
from sources believed to be reliable and accurate, however,
its accuracy and completeness cannot be guaranteed.
This site is not an investment advisor, hence it does
not endorse or recommend any securities or other investments.
Any recommendation contained in this report may not
be suitable for all investors and it is not to be deemed
an offer or solicitation on our part with respect to
the purchase or sale of any securities. All trademarks,
service marks and trade names appearing in this report
are the property of their respective owners, and are
likewise used for identification purposes only.
This report is a service available
only to active Paid Premium Members.
You may opt-out of receiving report notifications
at any time. Questions or comments may be submitted
by writing to Premium Membership Services 665 S.E. 10 Street, Suite 201 Deerfield Beach, FL 33441-5634 or by calling 1-800-965-8307
or 954-785-1121.
|
|
|