You are not logged in.
This means you
CAN ONLY VIEW reports that were published prior to Wednesday, April 9, 2025.
You
MUST UPGRADE YOUR MEMBERSHIP if you want to see any current reports.
AFTER MARKET UPDATE - MONDAY, JUNE 3RD, 2024
Previous After Market Report Next After Market Report >>>
|
|
|
|
DOW |
-115.29 |
38,571.03 |
-0.30% |
|
Volume |
934,678,108 |
-53% |
|
Volume |
5,565,518,200 |
-18% |
|
NASDAQ |
+93.65 |
16,828.67 |
+0.56% |
|
Advancers |
1,286 |
47% |
|
Advancers |
2,180 |
50% |
|
S&P 500 |
+5.89 |
5,283.40 |
+0.11% |
|
Decliners |
1,460 |
53% |
|
Decliners |
2,148 |
50% |
|
Russell 2000 |
-10.44 |
2,059.68 |
-0.50% |
|
52 Wk Highs |
124 |
|
|
52 Wk Highs |
102 |
|
|
S&P 600 |
-5.70 |
1,323.95 |
-0.43% |
|
52 Wk Lows |
48 |
|
|
52 Wk Lows |
110 |
|
|
 |
Major Indices Were Mixed as Nasdaq Composite Showed Leadership
Kenneth J. Gruneisen - Passed the CAN SLIM® Master's Exam
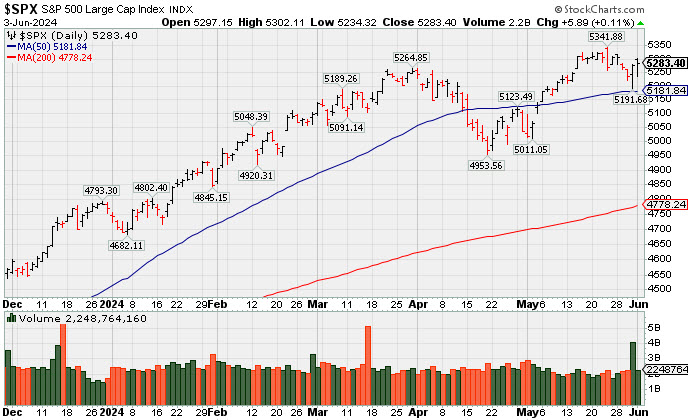
The first session of June left the S&P 500 (-0.1%) and Dow Jones Industrial Average (-0.5%) both lower while the Nasdaq Composite rose +0.3%. Volume was lighter than the prior session on the NYSE and on the Nasdaq exchange. Decliners led advancers by a narrow margin on the NYSE while advancers slightly outnumbered decliners on the Nasdaq exchange. Leadership improved as there were 57 high-ranked companies from the Leaders List that hit new 52-week highs and were listed on the BreakOuts Page versus the total of 43 on the prior session. New 52-week highs outnumbered new 52-week lows on the NYSE but new lows outnumbered new highs for a fourth consecutive session on the Nasdaq exchange. The major indices are in a confirmed uptrend (M criteria) that recently endured some pressure. It was encouraging to see the market show some broad-based resiience.
PICTURED: The S&P 500 Index posted a small gain on Monday adding to Friday's solid gain. It has been consolidating above its 50-day moving average (DMA) line which is always an important support level to watch.
NVIDIA (NVDA +4.90%) rose after it introduced new products. However, concerns about economic growth made the broader appear market indecisive. The ISM Manufacturing Index for May reflected a faster pace of contraction than the market expected (actual 48.7%; expected 49.6%). A reading below 50% indicates a contraction in activity. WTI crude oil futures ($74.29/bbl, -2.79, -3.6%) were lower amid slowdown concerns.
The S&P 500 energy sector was the worst performing sector as it fell -2.6%. The utilities (-1.2%) and industrial (-1.3%) sectors were the next worst performers. The information technology sector (+1.0%) led, followed by the health care sector (+0.7%). Yields moved lower as the 10-yr note fell 11 basis points to 4.40% and the 2-yr note fell seven basis points to 4.82%.
Speculative activity was evident in the meme stock space after "Roaring Kitty" posted a screenshot showing a big position in GameStop (GME +21.0%). |
 Kenneth J. Gruneisen started out as a licensed stockbroker in August 1987, a couple of months prior to the historic stock market crash that took the Dow Jones Industrial Average down -22.6% in a single day. He has published daily fact-based fundamental and technical analysis on high-ranked stocks online for two decades. Through FACTBASEDINVESTING.COM, Kenneth provides educational articles, news, market commentary, and other information regarding proven investment systems that work in good times and bad.
Comments contained in the body of this report are technical opinions only and are not necessarily those of Gruneisen Growth Corp. The material herein has been obtained from sources believed to be reliable and accurate, however, its accuracy and completeness cannot be guaranteed. Our firm, employees, and customers may effect transactions, including transactions contrary to any recommendation herein, or have positions in the securities mentioned herein or options with respect thereto. Any recommendation contained in this report may not be suitable for all investors and it is not to be deemed an offer or solicitation on our part with respect to the purchase or sale of any securities. |
|
 |
Tech Sector Rose While Energy-Linked Groups Fell
Kenneth J. Gruneisen - Passed the CAN SLIM® Master's Exam
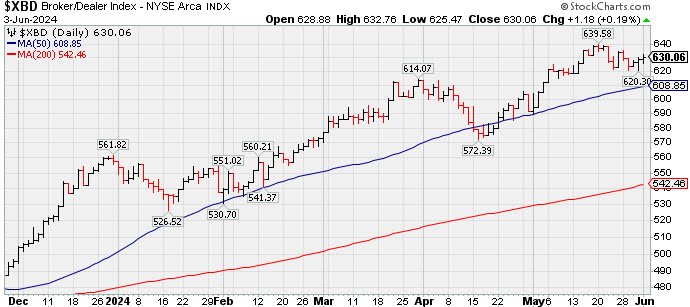
The Bank Index ($BKX -1.02%) lost ground while the Broker/Dealer Index ($XBD +0.19%) and the Retail Index ($RLX +0.35%) both edged higher. The tech sector had a positive bias as the Semiconductor Index ($SOX +0.57%), Biotech Index ($BTK +1.32%), and the Networking Index ($NWX +0.68%) posted unanimous gains. Energy-linked groups clearly had a negative bias as the Oil Services ($OSX -5.11%) and the Integrated Oil Index ($XOI -2.93%) both posted standout losses. The Gold & Silver Index ($XAU -0.06%) finished flat.
![]() PICTURED: The Broker/Dealer Index ($XBD +0.19%) posted a third consecutive gain on Monday, consolidating above its 50-day moving average (DMA) line and above prior highs.
| Oil Services |
$OSX |
81.95 |
-4.41 |
-5.11% |
-2.30% |
| Integrated Oil |
$XOI |
2,030.74 |
-61.39 |
-2.93% |
+9.03% |
| Semiconductor |
$SOX |
5,152.51 |
+29.16 |
+0.57% |
+23.40% |
| Networking |
$NWX |
807.90 |
+5.49 |
+0.68% |
-2.99% |
| Broker/Dealer |
$XBD |
630.06 |
+1.18 |
+0.19% |
+13.06% |
| Retail |
$RLX |
4,301.33 |
+14.98 |
+0.35% |
+10.61% |
| Gold & Silver |
$XAU |
145.07 |
-0.09 |
-0.06% |
+15.42% |
| Bank |
$BKX |
103.87 |
-1.07 |
-1.02% |
+8.17% |
| Biotech |
$BTK |
5,198.83 |
+67.62 |
+1.32% |
-4.06% |
|
|
|
 |
Slump Below 50-Day Moving Average Again Hurts Outlook
Kenneth J. Gruneisen - Passed the CAN SLIM® Master's Exam
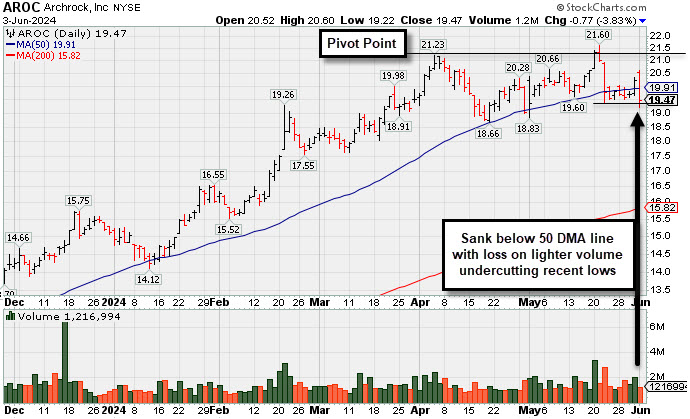
Archrock (AROC -$0.77 or -3.80% to $19.47) suffered a loss today with below-average volume as it slumped back below its 50-day moving average (DMA) line ($20). It also undercut the recent lows hurting its outlook and its color code was changed to green. A rebound above its 50-day moving average (DMA) line is again needed for its outlook to improve.
AROC has faltered and encountered distributional pressure since highlighted in yellow with pivot point cited based on its 4/04/24 high plus 10 cents in the 5/20/24 mid-day report (read here). It was shown in detail that evening with an annotated graph under the headline, "Strong Finish for Archrock After Highlighted in Mid-Day Report".
It has a highest possible Earnings Per Share Rating of 99. Earnings increases have been above the +25% mninimum guideline in quarterly comparisons through Mar '24 versus the year-ago periods. Annual earnings (A criteria) growth has been strong after a loss in FY '20. It hails from the Oil and Gas-Machinery/Equip group which is currently ranked 52nd on the 197 Industryu Groups List (L criteria).
There are 156.3 million shares (S criteria) outstanding. The number of top-rated funds owning its shares rose frm 380 in Jun '23 to 451 in Mar '24, a reassuring sign concerning the I criteria. Its current Up/Down Volume Ratio of 1.4 is an unbiased indication its shares have been under accumulation over the past 50 days.
Symbol/Exchange
Company Name
Industry Group | PRICE | CHANGE
(%Change) | Day High | Volume
(% DAV)
(% 50 day avg vol) | 52 Wk Hi
% From Hi | Featured
Date | Price
Featured | Pivot Featured | | Max Buy |  TDG - NYSE TDG - NYSE
TransDigm Group
Aerospace/Defense | $1,339.19 | -4.04
-0.30% | $1,356.98 | 183,325
91.66% of 50 DAV
50 DAV is 200,000 | $1,363.66
-1.79%
| 4/12/2024 | $1,224.21 | PP = $1,246.32 | | MB = $1,308.64 |  Most Recent Note - 6/3/2024 8:40:41 PM Most Recent Note - 6/3/2024 8:40:41 PM
G - Still hovering near its all-time high after a "negative reversal" on 5/28/24. It is extended from any sound base and its 50 DMA line ($1,264) defines near-term support to watch on pullbacks. Fundamentals remain strong.
>>> FEATURED STOCK ARTICLE : Aerospace/Defense Firm Hitting Another All-Time High - 5/21/2024 | View all notes | Set NEW NOTE alert | Company Profile | SEC News | Chart | Request a new note C A S I | USLM - NASDAQ
U.S. Lime & Minerals
Bldg-Cement/Concrt/Ag | $341.16 | -1.58
-0.46% | $345.75 | 19,673
78.69% of 50 DAV
50 DAV is 25,000 | $378.78
-9.93%
| 2/9/2024 | $254.68 | PP = $265.09 | | MB = $278.34 | Most Recent Note - 5/30/2024 6:13:44 PM
G - Posted a small gain today with below average volume, breaking a streak of 10 consecutive small losses. Its 50 DMA line ($323.25) defines important near-term support to watch. Fundamentals remain strong.
>>> FEATURED STOCK ARTICLE : Stubbornly Held Ground and Posted Quiet Gain for Best-Ever Close - 5/14/2024 | View all notes | Set NEW NOTE alert | Company Profile | SEC News | Chart | Request a new note C A S I | CLS - NYSE
Celestica
Elec-Contract Mfg | $55.57 | -0.35
-0.63% | $57.12 | 1,543,336
67.01% of 50 DAV
50 DAV is 2,303,000 | $61.06
-8.99%
| 5/15/2024 | $51.52 | PP = $51.22 | | MB = $53.78 | Most Recent Note - 5/31/2024 1:00:16 PM
G - Pulling back today with ever-increasing volume behind its 3rd consecutive loss, retreating from its all-time high. Noted recently - "Extended from the previously noted base. Prior highs in the $51 area define initial support to watch above its 50 DMA line ($47.83)."
>>> FEATURED STOCK ARTICLE : Strong Breakout After 6-Week Flat Base - 5/15/2024 | View all notes | Set NEW NOTE alert | Company Profile | SEC News | Chart | Request a new note C A S I | AROC - NYSE
Archrock
OilandGas-Machinery/Equip | $19.47 | -0.77
-3.80% | $20.60 | 1,288,270
85.83% of 50 DAV
50 DAV is 1,501,000 | $21.61
-9.90%
| 5/20/2024 | $21.23 | PP = $21.50 | | MB = $22.58 | Most Recent Note - 6/3/2024 9:22:21 PM
G - Color code is changed to green after today''s loss violated its 50 DMA line ($20) and undercut recent lows in the $19 area raising concerns. A rebound above the 50 DMA line is again needed to help its outlook improve. See the latest FSU analysis for more details and a new annotated graph.
>>> FEATURED STOCK ARTICLE : Slump Below 50-Day Moving Average Again Hurts Outlook - 6/3/2024 | View all notes | Set NEW NOTE alert | Company Profile | SEC News | Chart | Request a new note C A S I | DECK - NYSE
Deckers Outdoor
Apparel-Shoes and Rel Mfg | $1,086.57 | -7.35
-0.67% | $1,106.89 | 264,515
70.16% of 50 DAV
50 DAV is 377,000 | $1,095.48
-0.81%
| 5/24/2024 | $1,010.60 | PP = $956.27 | | MB = $1,004.08 | Most Recent Note - 5/30/2024 6:12:18 PM
G - Hit another new all-time high with today''s gain. Rallied well above its "max buy" level, quickly getting extended from prior highs in the $956 area that define initial support to watch on pullbacks.
>>> FEATURED STOCK ARTICLE : Big "Breakaway Gap" for Deckers Outdoor - 5/24/2024 | View all notes | Set NEW NOTE alert | Company Profile | SEC News | Chart | Request a new note C A S I | Symbol/Exchange
Company Name
Industry Group | PRICE | CHANGE
(%Change) | Day High | Volume
(% DAV)
(% 50 day avg vol) | 52 Wk Hi
% From Hi | Featured
Date | Price
Featured | Pivot Featured | | Max Buy | ELF - NYSE
e.l.f. Beauty
Cosmetics/Personal Care | $196.45 | +9.54
5.10% | $202.58 | 1,837,679
108.93% of 50 DAV
50 DAV is 1,687,000 | $221.83
-11.44%
| 5/24/2024 | $193.79 | PP = $182.73 | | MB = $191.87 | Most Recent Note - 6/3/2024 8:52:32 PM
G - Gapped up for a solid gain today with near average volume and its color code is changed to green after rising above it "max buy" level. Rallying after breaking out a "double-bottom" base.
>>> FEATURED STOCK ARTICLE : Down on Lighter Volume After Breakout From "Double Bottom" Base - 5/29/2024 | View all notes | Set NEW NOTE alert | Company Profile | SEC News | Chart | Request a new note C A S I | PDD - NASDAQ
PDD Holdings ADR
Retail-Internet | $146.92 | -2.86
-1.91% | $149.88 | 8,573,675
88.12% of 50 DAV
50 DAV is 9,730,000 | $164.69
-10.79%
| 5/24/2024 | $161.85 | PP = $153.09 | | MB = $160.74 | Most Recent Note - 6/3/2024 8:37:37 PM
Y - Slumping below prior highs with losses on below average volume raising concerns after it rallied to new 52-week highs with 3 consecutive volume-driven gains clearing a 20-week base. Disciplined investors avoid big losses by selling any stock that falls more than 7-8% below their purchase price.
>>> FEATURED STOCK ARTICLE : Pulled Back Below Prior Highs Raising Concerns - 5/28/2024 | View all notes | Set NEW NOTE alert | Company Profile | SEC News | Chart | Request a new note C A S I | CRWD - NASDAQ
CrowdStrike Holdings
Computer Sftwr-Security | $308.69 | -4.98
-1.59% | $319.48 | 4,357,032
174.42% of 50 DAV
50 DAV is 2,498,000 | $365.00
-15.43%
| 5/28/2024 | $351.47 | PP = $365.10 | | MB = $383.36 | Most Recent Note - 6/3/2024 8:42:42 PM
G - Suffered a 3rd consecutive loss today after violating its 50 DMA line ($317) triggering a technical sell signal. Due to report Apr '24 quarterly results on 6/04/24.
>>> FEATURED STOCK ARTICLE : Volume-Driven Loss Triggered Technical Sell Signal - 5/30/2024 | View all notes | Set NEW NOTE alert | Company Profile | SEC News | Chart | Request a new note C A S I |
|
|
|
Color Codes Explained :
Y - Better candidates highlighted by our
staff of experts.
G - Previously featured
in past reports as yellow but may no longer be buyable under the
guidelines.
***Last / Change / Volume data in this table is the closing quote data***
Symbol/Exchange
Company Name
Industry Group |
PRICE |
CHANGE
(%Change) |
Day High |
Volume
(% DAV)
(% 50 day avg vol) |
52 Wk Hi
% From Hi |
Featured
Date |
Price
Featured |
Pivot Featured |
|
Max Buy |
 TDG
-
NYSE
TDG
-
NYSE
TransDigm Group
Aerospace/Defense
|
$1,339.19
|
-4.04
-0.30% |
$1,356.98
|
183,325
91.66% of 50 DAV
50 DAV is 200,000
|
$1,363.66
-1.79%
|
4/12/2024
|
$1,224.21
|
PP = $1,246.32
|
|
MB = $1,308.64
|
Most Recent Note - 5/29/2024 2:25:22 PM
G - There was a "negative reversal" on the prior session after hitting yet another new all-time high. It is extended from any sound base and its 50 DMA line ($1,257) defines near-term support to watch on pullbacks. Fundamentals remain strong.
>>> FEATURED STOCK ARTICLE : Aerospace/Defense Firm Hitting Another All-Time High - 5/21/2024 |
View all notes |
Set NEW NOTE alert |
Company Profile |
SEC
News |
Chart |
Request a new note
C
A
S
I |
USLM
-
NASDAQ
U.S. Lime & Minerals
Bldg-Cement/Concrt/Ag
|
$341.16
|
-1.58
-0.46% |
$345.75
|
19,673
78.69% of 50 DAV
50 DAV is 25,000
|
$378.78
-9.93%
|
2/9/2024
|
$254.68
|
PP = $265.09
|
|
MB = $278.34
|
Most Recent Note - 5/30/2024 6:13:44 PM
G - Posted a small gain today with below average volume, breaking a streak of 10 consecutive small losses. Its 50 DMA line ($323.25) defines important near-term support to watch. Fundamentals remain strong.
>>> FEATURED STOCK ARTICLE : Stubbornly Held Ground and Posted Quiet Gain for Best-Ever Close - 5/14/2024 |
View all notes |
Set NEW NOTE alert |
Company Profile |
SEC
News |
Chart |
Request a new note
C
A
S
I |
CLS
-
NYSE
Celestica
Elec-Contract Mfg
|
$55.57
|
-0.35
-0.63% |
$57.12
|
1,543,336
67.01% of 50 DAV
50 DAV is 2,303,000
|
$61.06
-8.99%
|
5/15/2024
|
$51.52
|
PP = $51.22
|
|
MB = $53.78
|
Most Recent Note - 5/31/2024 1:00:16 PM
G - Pulling back today with ever-increasing volume behind its 3rd consecutive loss, retreating from its all-time high. Noted recently - "Extended from the previously noted base. Prior highs in the $51 area define initial support to watch above its 50 DMA line ($47.83)."
>>> FEATURED STOCK ARTICLE : Strong Breakout After 6-Week Flat Base - 5/15/2024 |
View all notes |
Set NEW NOTE alert |
Company Profile |
SEC
News |
Chart |
Request a new note
C
A
S
I |
AROC
-
NYSE
Archrock
OilandGas-Machinery/Equip
|
$19.47
|
-0.77
-3.80% |
$20.60
|
1,288,270
85.83% of 50 DAV
50 DAV is 1,501,000
|
$21.61
-9.90%
|
5/20/2024
|
$21.23
|
PP = $21.50
|
|
MB = $22.58
|
Most Recent Note - 5/31/2024 5:29:28 PM
Y - Posted a volume-driven gain today rebounding above its 50 DMA line ($20) helping its outlook improve and its color code was changed to yellow. The recent lows in the $19 area define important near-term support to watch on pullbacks.
>>> FEATURED STOCK ARTICLE : Strong Finish for Archrock After Highlighted in Mid-Day Report - 5/20/2024 |
View all notes |
Set NEW NOTE alert |
Company Profile |
SEC
News |
Chart |
Request a new note
C
A
S
I |
DECK
-
NYSE
Deckers Outdoor
Apparel-Shoes and Rel Mfg
|
$1,086.57
|
-7.35
-0.67% |
$1,106.89
|
264,515
70.16% of 50 DAV
50 DAV is 377,000
|
$1,095.48
-0.81%
|
5/24/2024
|
$1,010.60
|
PP = $956.27
|
|
MB = $1,004.08
|
Most Recent Note - 5/30/2024 6:12:18 PM
G - Hit another new all-time high with today's gain. Rallied well above its "max buy" level, quickly getting extended from prior highs in the $956 area that define initial support to watch on pullbacks.
>>> FEATURED STOCK ARTICLE : Big "Breakaway Gap" for Deckers Outdoor - 5/24/2024 |
View all notes |
Set NEW NOTE alert |
Company Profile |
SEC
News |
Chart |
Request a new note
C
A
S
I |
Symbol/Exchange
Company Name
Industry Group |
PRICE |
CHANGE
(%Change) |
Day High |
Volume
(% DAV)
(% 50 day avg vol) |
52 Wk Hi
% From Hi |
Featured
Date |
Price
Featured |
Pivot Featured |
|
Max Buy |
ELF
-
NYSE
e.l.f. Beauty
Cosmetics/Personal Care
|
$196.45
|
+9.54
5.10% |
$202.58
|
1,837,679
108.93% of 50 DAV
50 DAV is 1,687,000
|
$221.83
-11.44%
|
5/24/2024
|
$193.79
|
PP = $182.73
|
|
MB = $191.87
|
Most Recent Note - 5/31/2024 5:32:15 PM
Y - Managed a "positive reversal" for a gain with light volume today. Color code was changed to yellow in the 5/24/24 mid-day report with pivot point cited based on its 4/29/24 high after breaking out a "double-bottom" base. Rallied further after gapping up and rebounding above its 50 DMA line ($172.67) helping its technical stance and outlook improve. See the latest FSU analysis for more details and an annotated graph.
>>> FEATURED STOCK ARTICLE : Down on Lighter Volume After Breakout From "Double Bottom" Base - 5/29/2024 |
View all notes |
Set NEW NOTE alert |
Company Profile |
SEC
News |
Chart |
Request a new note
C
A
S
I |
PDD
-
NASDAQ
PDD Holdings ADR
Retail-Internet
|
$146.92
|
-2.86
-1.91% |
$149.88
|
8,573,675
88.12% of 50 DAV
50 DAV is 9,730,000
|
$164.69
-10.79%
|
5/24/2024
|
$161.85
|
PP = $153.09
|
|
MB = $160.74
|
Most Recent Note - 5/29/2024 12:29:50 PM
Y - Consolidating near prior highs, showing resilience today with a "positive reversal" after undercutting the prior high raising concerns. Color code was changed to yellow in the 5/24/24 mid-day report with pivot point cited based on its 1/11/24 high plus 10 cents. Rallied to new 52-week highs with 3 consecutive volume-driven gains clearing a 20-week base during which it found prompt support at its 200 DMA line. Quarterly comparisons through Mar '24 showed encouraging sales revenues and greatly improved earnings versus the year-ago periods with growth rate acceleration. After years of losses, it had a profitable FY '21-23 helping it better match the fundamental annual earnings (A criteria) guidelines of the fact-based investment system. See the latest FSU analysis for more details and an annotated graph.
>>> FEATURED STOCK ARTICLE : Pulled Back Below Prior Highs Raising Concerns - 5/28/2024 |
View all notes |
Set NEW NOTE alert |
Company Profile |
SEC
News |
Chart |
Request a new note
C
A
S
I |
CRWD
-
NASDAQ
CrowdStrike Holdings
Computer Sftwr-Security
|
$308.69
|
-4.98
-1.59% |
$319.48
|
4,357,032
174.42% of 50 DAV
50 DAV is 2,498,000
|
$365.00
-15.43%
|
5/28/2024
|
$351.47
|
PP = $365.10
|
|
MB = $383.36
|
Most Recent Note - 5/30/2024 6:07:01 PM
G - Color code is changed to green after violating its 50 DMA line ($318) with a volume-driven loss today triggering a technical sell signal. Due to report Apr '24 quarterly results on 6/04/24. See the latest FSU analysis for more details and a new annotated graph.
>>> FEATURED STOCK ARTICLE : Volume-Driven Loss Triggered Technical Sell Signal - 5/30/2024 |
View all notes |
Set NEW NOTE alert |
Company Profile |
SEC
News |
Chart |
Request a new note
C
A
S
I |
|
|
|
THESE ARE NOT BUY RECOMMENDATIONS!
Comments contained in the body of this report are technical
opinions only. The material herein has been obtained
from sources believed to be reliable and accurate, however,
its accuracy and completeness cannot be guaranteed.
This site is not an investment advisor, hence it does
not endorse or recommend any securities or other investments.
Any recommendation contained in this report may not
be suitable for all investors and it is not to be deemed
an offer or solicitation on our part with respect to
the purchase or sale of any securities. All trademarks,
service marks and trade names appearing in this report
are the property of their respective owners, and are
likewise used for identification purposes only.
This report is a service available
only to active Paid Premium Members.
You may opt-out of receiving report notifications
at any time. Questions or comments may be submitted
by writing to Premium Membership Services 665 S.E. 10 Street, Suite 201 Deerfield Beach, FL 33441-5634 or by calling 1-800-965-8307
or 954-785-1121.
|
|
|