You are not logged in.
This means you
CAN ONLY VIEW reports that were published prior to Tuesday, April 8, 2025.
You
MUST UPGRADE YOUR MEMBERSHIP if you want to see any current reports.
AFTER MARKET UPDATE - TUESDAY, JUNE 4TH, 2024
Previous After Market Report Next After Market Report >>>
|
|
|
|
DOW |
+140.26 |
38,711.29 |
+0.36% |
|
Volume |
915,359,153 |
-2% |
|
Volume |
5,083,329,500 |
-9% |
|
NASDAQ |
+28.38 |
16,857.05 |
+0.17% |
|
Advancers |
1,079 |
39% |
|
Advancers |
1,518 |
36% |
|
S&P 500 |
+7.94 |
5,291.34 |
+0.15% |
|
Decliners |
1,702 |
61% |
|
Decliners |
2,750 |
64% |
|
Russell 2000 |
-25.74 |
2,033.94 |
-1.25% |
|
52 Wk Highs |
63 |
|
|
52 Wk Highs |
54 |
|
|
S&P 600 |
-18.55 |
1,305.40 |
-1.40% |
|
52 Wk Lows |
54 |
|
|
52 Wk Lows |
155 |
|
|
 |
Breadth Negative and Leadership Thin as Indices Post Small Gains
Kenneth J. Gruneisen - Passed the CAN SLIM® Master's Exam
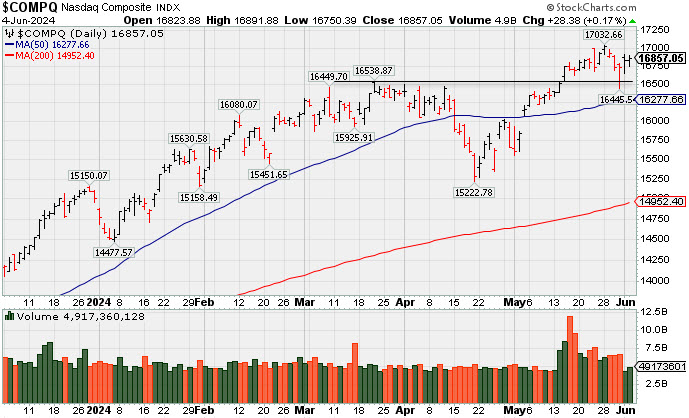
The S&P 500 was down -0.5% at its low of the day, however, the 3 major indices recovered from early lows to post modest gains. The S&P 500 and Nasdaq Composite each closed +0.2% higher and the Dow Jones Industrial Average rose +0.4%. Volume totals reported were lighter than the prior session on the NYSE and on the Nasdaq exchange, revealing lackluster buying demand from the institutional crowd. Beneath the surface, breadth was negative as decliners led advancers by about a 3-2 margin on the NYSE and by nearly 2-1 on the Nasdaq exchange. Leadership also thinned as there were 18 high-ranked companies from the Leaders List that hit new 52-week highs and were listed on the BreakOuts Page down from the total of 57 on the prior session. New 52-week highs totals contracted yet still outnumbered new 52-week lows on the NYSE, meanwhile, new 52-week lows outnumbered new 52-week highs more convincingly for a fifth consecutive session on the Nasdaq exchange. The major indices are in a confirmed uptrend (M criteria) that recently endured some pressure. Disciplined investors will watch for encouraging new highs totals to see the market showing some broad-based strength and resiience. Any uptrend requires healthy leadership.
PICTURED: The Nasdaq Composite Index is consolidating above its March 2024 high after recently hitting new all-time highs. The prior low and its 50-day moving average (DMA) line define important near-term support to watch on pullbacks.
A decrease in April job openings to 8.059 million from a revised 8.355 million (from 8.488 million) in March led to slowdown worries. Weakness in energy, materials, and bank stocks led Small Cap stocks to underperform their larger peers through the entire session. The Russell 2000 declined -1.3% and S&P 600 Index fell -1.4%.
The S&P 500 materials (-1.2%), energy (-1.0%), and financial (-0.4%) sectors had the steepest declines among the 11 sectors. Meanwhile, the real estate (+1.0%), consumer staples (+0.9%), and information technology (+0.4%) sectors rose. Treasury yields were lower as the 10-yr note yield was 7basis points lower at 4.34% and the 2-yr note yield fell five basis points to 4.77%.
NVIDIA (NVDA +1.25%) rose after Elon Musk indicated that NVDA purchases by Tesla (TSLA -0.88%) are expected to be $3-4 billion this year.
|
 Kenneth J. Gruneisen started out as a licensed stockbroker in August 1987, a couple of months prior to the historic stock market crash that took the Dow Jones Industrial Average down -22.6% in a single day. He has published daily fact-based fundamental and technical analysis on high-ranked stocks online for two decades. Through FACTBASEDINVESTING.COM, Kenneth provides educational articles, news, market commentary, and other information regarding proven investment systems that work in good times and bad.
Comments contained in the body of this report are technical opinions only and are not necessarily those of Gruneisen Growth Corp. The material herein has been obtained from sources believed to be reliable and accurate, however, its accuracy and completeness cannot be guaranteed. Our firm, employees, and customers may effect transactions, including transactions contrary to any recommendation herein, or have positions in the securities mentioned herein or options with respect thereto. Any recommendation contained in this report may not be suitable for all investors and it is not to be deemed an offer or solicitation on our part with respect to the purchase or sale of any securities. |
|
 |
Tech, Financial, and Commodity-Linked Groups Fell
Kenneth J. Gruneisen - Passed the CAN SLIM® Master's Exam
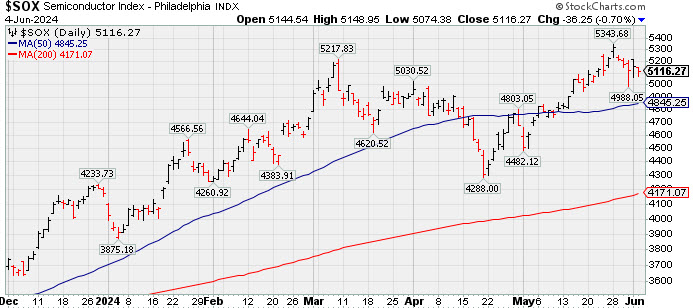
The Bank Index ($BKX -1.14%) and the Broker/Dealer Index ($XBD -1.30%) both lost ground while the Retail Index ($RLX +0.37%) edged higher. The tech sector had a negative bias as the Semiconductor Index ($SOX -0.70%), Networking Index ($NWX -1.02%), and the Biotech Index ($BTK -0.23%) posted unanimous losses. The Gold & Silver Index ($XAU -4.42%) suffered a big loss and energy-linked groups continued lower, even after Monday's big losses, as the Oil Services ($OSX -2.50%) and the Integrated Oil Index ($XOI -0.91%) both slumped.
![]() PICTURED: The Semiconductor Index ($SOX -0.70%) pulled back on Tuesday, consolidating back below its March 2024 high after recently hitting new all-time highs.
| Oil Services |
$OSX |
79.91 |
-2.05 |
-2.50% |
-4.74% |
| Integrated Oil |
$XOI |
2,012.30 |
-18.44 |
-0.91% |
+8.04% |
| Semiconductor |
$SOX |
5,116.26 |
-36.25 |
-0.70% |
+22.53% |
| Networking |
$NWX |
799.69 |
-8.21 |
-1.02% |
-3.98% |
| Broker/Dealer |
$XBD |
621.88 |
-8.18 |
-1.30% |
+11.59% |
| Retail |
$RLX |
4,317.27 |
+15.97 |
+0.37% |
+11.02% |
| Gold & Silver |
$XAU |
138.65 |
-6.41 |
-4.42% |
+10.31% |
| Bank |
$BKX |
102.68 |
-1.19 |
-1.14% |
+6.93% |
| Biotech |
$BTK |
5,187.08 |
-11.75 |
-0.23% |
-4.28% |
|
|
|
 |
Steady Pullback to Below "Max Buy" Level Following Rally
Kenneth J. Gruneisen - Passed the CAN SLIM® Master's Exam
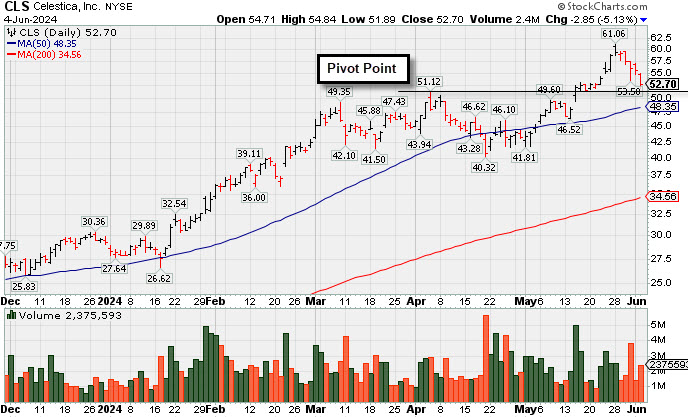
Celestica (CLS -$2.86 or -5.15% to $52.71) suffered a 5th consecutive loss today, abruptly retreating from its all-time high and undercutting its 20-day moving average ($52.92). Its color code is changed to yellow affer retreating below its "max buy" level. CLS was noted recently - "Extended from the previously noted base. Prior highs in the $51 area define initial support to watch above its 50 DMA line."
CLS finished strong after highlighted in yellow in the 5/15/24 mid-day report (read here) with pivot point cited based on its 4/04/24 high plus 10 cents after a 6-week flat base. It was shown in detail that evening with an annotated graph under the headline, "Strong Breakout After 6-Week Flat Base".
CLS hails from the high ranked Elec-Contract Mfg group which is now ranked 24th on the 197 Industry Groups List (L criteria). CLS recently reported earnings +83% on +20% sales revenues for the Mar '24 quarter versus the year ago period, and 7 of the last 8 quarterly comparisons were at or above the +25% minimum earnings guideline (C criteria). Annual earnings (A criteria) history has been strong since bottoming in FY '19. It has a highest possible 99 Earnings Per Share Rating.
There are only 119 million shares outstanding (S criteria) which can contribute to greater price volatility in the event of institutional buying or selling. The number of top-rated funds owning its shares rose from 322 in Jun '23 to 508 in Mar '24, a reassuring sign concerning the I criteria. Its current Up/Down Volume Ratio of 1.5 is an unbiased indication its shares have been under accumulation over the past 50 days.
 Symbol/Exchange
Company Name
Industry Group | PRICE | CHANGE
(%Change) | Day High | Volume
(% DAV)
(% 50 day avg vol) | 52 Wk Hi
% From Hi | Featured
Date | Price
Featured | Pivot Featured | | Max Buy |  TDG - NYSE TDG - NYSE
TransDigm Group
Aerospace/Defense | $1,340.83 | +1.64
0.12% | $1,342.32 | 153,181
76.59% of 50 DAV
50 DAV is 200,000 | $1,363.66
-1.67%
| 4/12/2024 | $1,224.21 | PP = $1,246.32 | | MB = $1,308.64 | Most Recent Note - 6/3/2024 8:40:41 PM
G - Still hovering near its all-time high after a "negative reversal" on 5/28/24. It is extended from any sound base and its 50 DMA line ($1,264) defines near-term support to watch on pullbacks. Fundamentals remain strong.
>>> FEATURED STOCK ARTICLE : Aerospace/Defense Firm Hitting Another All-Time High - 5/21/2024 | View all notes | Set NEW NOTE alert | Company Profile | SEC News | Chart | Request a new note C A S I | USLM - NASDAQ
U.S. Lime & Minerals
Bldg-Cement/Concrt/Ag | $338.60 | -2.56
-0.75% | $339.85 | 19,272
80.30% of 50 DAV
50 DAV is 24,000 | $378.78
-10.61%
| 2/9/2024 | $254.68 | PP = $265.09 | | MB = $278.34 |  Most Recent Note - 6/4/2024 7:28:01 PM Most Recent Note - 6/4/2024 7:28:01 PM
G - Fell slightly today for a 13th loss in the span of 14 sessions with volume below average. Its 50 DMA line ($325) defines important near-term support to watch. Fundamentals remain strong.
>>> FEATURED STOCK ARTICLE : Stubbornly Held Ground and Posted Quiet Gain for Best-Ever Close - 5/14/2024 | View all notes | Set NEW NOTE alert | Company Profile | SEC News | Chart | Request a new note C A S I | CLS - NYSE
Celestica
Elec-Contract Mfg | $52.71 | -2.86
-5.15% | $54.84 | 2,530,224
110.93% of 50 DAV
50 DAV is 2,281,000 | $61.06
-13.68%
| 5/15/2024 | $51.52 | PP = $51.22 | | MB = $53.78 | Most Recent Note - 6/4/2024 7:25:56 PM
Y - Suffered a 5th consecutive loss today, abruptly retreating from its all-time high and undercutting its 20-day moving average ($52.92). Color code is changed to yellow after retreating below "max buy" level. Prior highs in the $51 area define initial support to watch above its 50 DMA line. See the latest FSU analysis for more details and a new annotated graph.
>>> FEATURED STOCK ARTICLE : Steady Pullback to Below "Max Buy" Level Following Rally - 6/4/2024 | View all notes | Set NEW NOTE alert | Company Profile | SEC News | Chart | Request a new note C A S I | AROC - NYSE
Archrock
OilandGas-Machinery/Equip | $18.74 | -0.73
-3.75% | $19.32 | 1,665,656
111.34% of 50 DAV
50 DAV is 1,496,000 | $21.61
-13.28%
| 5/20/2024 | $21.23 | PP = $21.50 | | MB = $22.58 | Most Recent Note - 6/4/2024 6:35:11 PM
G - Fell further today with higher (average) volume while testing its 4/19/24 low. Color code was changed to green when violating its 50 DMA line ($20) and undercutting recent lows in the $19 area raising concerns and triggering technical sell signals. A rebound above the 50 DMA line is again needed to help its outlook improve. See the latest FSU analysis for more details and an annotated graph.
>>> FEATURED STOCK ARTICLE : Slump Below 50-Day Moving Average Again Hurts Outlook - 6/3/2024 | View all notes | Set NEW NOTE alert | Company Profile | SEC News | Chart | Request a new note C A S I | DECK - NYSE
Deckers Outdoor
Apparel-Shoes and Rel Mfg | $1,066.83 | -19.74
-1.82% | $1,092.20 | 225,236
60.22% of 50 DAV
50 DAV is 374,000 | $1,106.89
-3.62%
| 5/24/2024 | $1,010.60 | PP = $956.27 | | MB = $1,004.08 | Most Recent Note - 6/4/2024 6:37:27 PM
G - Pulled back for a 2nd small loss with lighter volume. Perched at its all-time high following noted volume-driven gains. Extended from prior highs in the $956 area that define initial support to watch on pullbacks.
>>> FEATURED STOCK ARTICLE : Big "Breakaway Gap" for Deckers Outdoor - 5/24/2024 | View all notes | Set NEW NOTE alert | Company Profile | SEC News | Chart | Request a new note C A S I | Symbol/Exchange
Company Name
Industry Group | PRICE | CHANGE
(%Change) | Day High | Volume
(% DAV)
(% 50 day avg vol) | 52 Wk Hi
% From Hi | Featured
Date | Price
Featured | Pivot Featured | | Max Buy | ELF - NYSE
e.l.f. Beauty
Cosmetics/Personal Care | $189.74 | -6.71
-3.42% | $198.49 | 1,053,708
62.09% of 50 DAV
50 DAV is 1,697,000 | $221.83
-14.47%
| 5/24/2024 | $193.79 | PP = $182.73 | | MB = $191.87 | Most Recent Note - 6/4/2024 6:40:16 PM
Y - Pulled back today with lighter volume and its color code is changed to yellow while consolidating back below its "max buy" level after breaking out a "double-bottom" base. Prior low ($177.99 pn 5/31/24) and 50 DMA line ($172) define important near-term support to watch.
>>> FEATURED STOCK ARTICLE : Down on Lighter Volume After Breakout From "Double Bottom" Base - 5/29/2024 | View all notes | Set NEW NOTE alert | Company Profile | SEC News | Chart | Request a new note C A S I | PDD - NASDAQ
PDD Holdings ADR
Retail-Internet | $145.88 | -1.04
-0.71% | $148.68 | 5,860,916
61.60% of 50 DAV
50 DAV is 9,515,000 | $164.69
-11.42%
| 5/24/2024 | $161.85 | PP = $153.09 | | MB = $160.74 | Most Recent Note - 6/3/2024 8:37:37 PM
Y - Slumping below prior highs with losses on below average volume raising concerns after it rallied to new 52-week highs with 3 consecutive volume-driven gains clearing a 20-week base. Disciplined investors avoid big losses by selling any stock that falls more than 7-8% below their purchase price.
>>> FEATURED STOCK ARTICLE : Pulled Back Below Prior Highs Raising Concerns - 5/28/2024 | View all notes | Set NEW NOTE alert | Company Profile | SEC News | Chart | Request a new note C A S I | CRWD - NASDAQ
CrowdStrike Holdings
Computer Sftwr-Security | $305.58 | -3.11
-1.01% | $312.38 | 8,305,087
329.57% of 50 DAV
50 DAV is 2,520,000 | $365.00
-16.28%
| 5/28/2024 | $351.47 | PP = $365.10 | | MB = $383.36 | Most Recent Note - 6/3/2024 8:42:42 PM
G - Suffered a 3rd consecutive loss today after violating its 50 DMA line ($317) triggering a technical sell signal. Due to report Apr '24 quarterly results on 6/04/24.
>>> FEATURED STOCK ARTICLE : Volume-Driven Loss Triggered Technical Sell Signal - 5/30/2024 | View all notes | Set NEW NOTE alert | Company Profile | SEC News | Chart | Request a new note C A S I |
|
|
|
Color Codes Explained :
Y - Better candidates highlighted by our
staff of experts.
G - Previously featured
in past reports as yellow but may no longer be buyable under the
guidelines.
***Last / Change / Volume data in this table is the closing quote data***
|
|
|
THESE ARE NOT BUY RECOMMENDATIONS!
Comments contained in the body of this report are technical
opinions only. The material herein has been obtained
from sources believed to be reliable and accurate, however,
its accuracy and completeness cannot be guaranteed.
This site is not an investment advisor, hence it does
not endorse or recommend any securities or other investments.
Any recommendation contained in this report may not
be suitable for all investors and it is not to be deemed
an offer or solicitation on our part with respect to
the purchase or sale of any securities. All trademarks,
service marks and trade names appearing in this report
are the property of their respective owners, and are
likewise used for identification purposes only.
This report is a service available
only to active Paid Premium Members.
You may opt-out of receiving report notifications
at any time. Questions or comments may be submitted
by writing to Premium Membership Services 665 S.E. 10 Street, Suite 201 Deerfield Beach, FL 33441-5634 or by calling 1-800-965-8307
or 954-785-1121.
|
|
|