You are not logged in.
This means you
CAN ONLY VIEW reports that were published prior to Tuesday, April 8, 2025.
You
MUST UPGRADE YOUR MEMBERSHIP if you want to see any current reports.
AFTER MARKET UPDATE - WEDNESDAY, MARCH 9TH, 2022
Previous After Market Report Next After Market Report >>>
|
|
|
|
DOW |
+653.61 |
33,286.25 |
+2.00% |
|
Volume |
1,195,112,444 |
-22% |
|
Volume |
5,323,216,400 |
-19% |
|
NASDAQ |
+459.99 |
13,255.55 |
+3.59% |
|
Advancers |
2,354 |
74% |
|
Advancers |
3,256 |
76% |
|
S&P 500 |
+107.18 |
4,277.88 |
+2.57% |
|
Decliners |
813 |
26% |
|
Decliners |
1,044 |
24% |
|
Russell 2000 |
+53.28 |
2,016.29 |
+2.71% |
|
52 Wk Highs |
18 |
|
|
52 Wk Highs |
39 |
|
|
S&P 600 |
+26.93 |
1,301.23 |
+2.11% |
|
52 Wk Lows |
97 |
|
|
52 Wk Lows |
167 |
|
|
The major averages signaled a continuing market correction (M criteria) with losses on Tuesday sending each index to close at new lows for the year. Followers of the fact-based investment system know to patiently watch for a solid follow-through day to confirm a new uptrend before any new buying efforts may be justified.
|
 |
Major Indices Rose With Lighter Volume and Thinner Leadership
Kenneth J. Gruneisen - Passed the CAN SLIM® Master's Exam
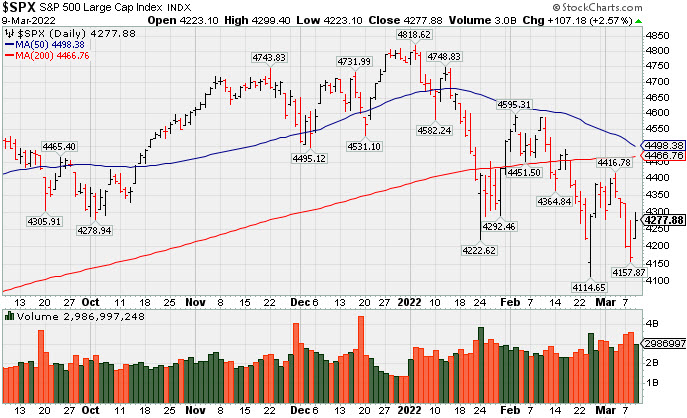
The S&P 500 jumped 2.6%, posting its best day since June 2020, while the Dow rallied 653 points. The Nasdaq Composite surged 3.6%, clawing out of bear market territory (defined as a more than 20% drawdown from a recent record). Volume totals reported were lighter than the prior session on the NYSE and on the Nasdaq exchange, indicative of lackluster institutional buying demand. Breadth was positive as advancers led decliners by nearly 3-1 on the NYSE and more than 3-1 on the Nasdaq exchange. Leadership remained thin as there were 6 high-ranked companies from the Leaders List that hit new 52-week highs and were listed on the BreakOuts Page, versus 14 on the prior session. New 52-week lows totals contracted yet still solidly outnumbered shrinking new 52-week highs totals on the NYSE and on the Nasdaq exchange. The market averages (M criteria) are in a "correction" and disciplined investors are reminded to reduce exposure and raise cash.
 PICTURED: The S&P 500 Index posted a gain with lighter volume as it sputtered near its 2022 low following 4 consecutive losses with higher volume totals.
U.S. stocks snapped a four-session losing streak as commodity prices stabilized, offering a slight reprieve from recent inflationary concerns. Also buoying sentiment was renewed hope that the conflict in Ukraine could be resolved diplomatically during a meeting tomorrow between top officials. Additionally, Ukraine President Zelensky has reportedly said he is no longer interested in joining NATO, one of Russia’s stated reasons for its invasion.
In commodities, West Texas Intermediate crude tumbled 11.2% to $109.87/barrel after the United Arab Emirates said it would encourage other OPEC (Organization of the Petroleum Exporting Countries) members to increase output. Still, oil prices remain up 47% year-to-date. Treasuries weakened ahead of tomorrow’s key inflation reading, with the yield on the 10-year note up nine basis points (0.09%) to 1.94%. Meanwhile, a gauge of the U.S. dollar fell for the first time in five days (-1.1%). On the data front, the Job Openings and Labor Turnover Survey (JOLTS) showed the number of job openings eased to 11.3 million in January, still holding near December’s record level.
Nine of 11 S&P 500 sectors finished in positive territory, with Technology and Financials outperforming. In corporate news, Match Group Inc. (MTCH +12.81%) and Bumble Inc. (BMBL +41.90%) both rallied after an analyst upgraded the two companies. Meanwhile, XPO Logistics Inc. (XPO +13.10%) rose after unveiling plans to spin off its brokerage transportation services unit.
|
 Kenneth J. Gruneisen started out as a licensed stockbroker in August 1987, a couple of months prior to the historic stock market crash that took the Dow Jones Industrial Average down -22.6% in a single day. He has published daily fact-based fundamental and technical analysis on high-ranked stocks online for two decades. Through FACTBASEDINVESTING.COM, Kenneth provides educational articles, news, market commentary, and other information regarding proven investment systems that work in good times and bad.
Comments contained in the body of this report are technical opinions only and are not necessarily those of Gruneisen Growth Corp. The material herein has been obtained from sources believed to be reliable and accurate, however, its accuracy and completeness cannot be guaranteed. Our firm, employees, and customers may effect transactions, including transactions contrary to any recommendation herein, or have positions in the securities mentioned herein or options with respect thereto. Any recommendation contained in this report may not be suitable for all investors and it is not to be deemed an offer or solicitation on our part with respect to the purchase or sale of any securities. |
|
 |
Financial, Retail, and Tech Indexes Bounced
Kenneth J. Gruneisen - Passed the CAN SLIM® Master's Exam
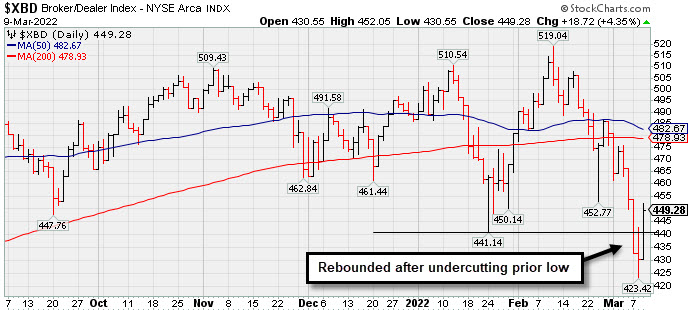
Financials had a positive influence on the major averages as the Broker/Dealer Index ($XBD +4.35%) and Bank Index ($BKX +4.15%) both rose more than +4%. The Retail Index ($RLX +2.04%) also notched a solid gain. The tech sector bounced as the Semiconductor Index ($SOX +3.97%), Networking Index ($NWX +3.01%), and Biotech Index ($BTK +3.22%) each posted a solid gain of more than +3%. Meanwhile, commodity-linked groups pulled back as the Oil Services Index ($OSX -4.12%) and Integrated Oil Index ($XOI -2.71%) both outpaced the Gold & Silver Index ($XAU -0.97%) to the downside. PICTURED: The Broker/Dealer Index ($XBD +4.35%) rebounded after slipping to a new lows for 2022.
| Oil Services |
$OSX |
78.79 |
-3.38 |
-4.12% |
+49.44% |
| Integrated Oil |
$XOI |
1,494.70 |
-41.70 |
-2.71% |
+26.86% |
| Semiconductor |
$SOX |
3,282.18 |
+125.31 |
+3.97% |
-16.83% |
| Networking |
$NWX |
852.90 |
+24.89 |
+3.01% |
-12.17% |
| Broker/Dealer |
$XBD |
449.28 |
+18.72 |
+4.35% |
-7.72% |
| Retail |
$RLX |
3,525.45 |
+70.51 |
+2.04% |
-16.59% |
| Gold & Silver |
$XAU |
157.54 |
-1.55 |
-0.97% |
+18.94% |
| Bank |
$BKX |
125.46 |
+5.00 |
+4.15% |
-5.11% |
| Biotech |
$BTK |
4,971.39 |
+154.96 |
+3.22% |
-9.91% |
|
|
|
 |
Featured Stocks
Kenneth J. Gruneisen - Passed the CAN SLIM® Master's Exam
|
|
|
Color Codes Explained :
Y - Better candidates highlighted by our
staff of experts.
G - Previously featured
in past reports as yellow but may no longer be buyable under the
guidelines.
***Last / Change / Volume data in this table is the closing quote data***
|
|
|
THESE ARE NOT BUY RECOMMENDATIONS!
Comments contained in the body of this report are technical
opinions only. The material herein has been obtained
from sources believed to be reliable and accurate, however,
its accuracy and completeness cannot be guaranteed.
This site is not an investment advisor, hence it does
not endorse or recommend any securities or other investments.
Any recommendation contained in this report may not
be suitable for all investors and it is not to be deemed
an offer or solicitation on our part with respect to
the purchase or sale of any securities. All trademarks,
service marks and trade names appearing in this report
are the property of their respective owners, and are
likewise used for identification purposes only.
This report is a service available
only to active Paid Premium Members.
You may opt-out of receiving report notifications
at any time. Questions or comments may be submitted
by writing to Premium Membership Services 665 S.E. 10 Street, Suite 201 Deerfield Beach, FL 33441-5634 or by calling 1-800-965-8307
or 954-785-1121.
|
|
|