You are not logged in.
This means you
CAN ONLY VIEW reports that were published prior to Tuesday, April 8, 2025.
You
MUST UPGRADE YOUR MEMBERSHIP if you want to see any current reports.
AFTER MARKET UPDATE - TUESDAY, MARCH 8TH, 2022
Previous After Market Report Next After Market Report >>>
|
|
|
|
DOW |
-184.74 |
32,632.64 |
-0.56% |
|
Volume |
1,523,564,780 |
+9% |
|
Volume |
6,603,994,300 |
+8% |
|
NASDAQ |
-35.41 |
12,795.55 |
-0.28% |
|
Advancers |
1,576 |
51% |
|
Advancers |
2,104 |
50% |
|
S&P 500 |
-30.39 |
4,170.70 |
-0.72% |
|
Decliners |
1,529 |
49% |
|
Decliners |
2,145 |
50% |
|
Russell 2000 |
+11.68 |
1,963.01 |
+0.60% |
|
52 Wk Highs |
108 |
|
|
52 Wk Highs |
52 |
|
|
S&P 600 |
+4.81 |
1,274.30 |
+0.38% |
|
52 Wk Lows |
500 |
|
|
52 Wk Lows |
793 |
|
|
The major averages signaled a continuing market correction (M criteria) with losses on Tuesday sending each index to close at new lows for the year. Followers of the fact-based investment system know to patiently watch for a solid follow-through day to confirm a new uptrend before any new buying efforts may be justified.
|
 |
Major Averages Fell Again With Higher Volume Totals
Kenneth J. Gruneisen - Passed the CAN SLIM® Master's Exam
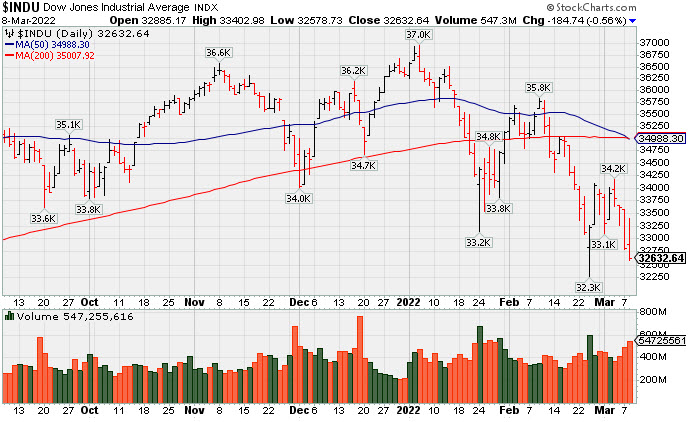
The S&P 500 ended down 0.7% on the heels of its worst one-day performance since October 2020 (-3%). The broad benchmark was whipsawed during the session, bouncing between a gain of as much as 1.8% and loss of nearly 1%. The Dow shed 184 points after yesterday dipping into correction territory (defined as a 10% decline from a recent record) for the first time in two years. The Nasdaq Composite fell 0.3% after sliding into bear market territory (defined as a 20% drop from a recent peak) on Monday. Volume totals reported were higher than the prior session on the NYSE and on the Nasdaq exchange, indicative of an increase in institutional selling termed "distribution". Advancers and decliners were evenly mixed on the NYSE and on the Nasdaq exchange. Leadership waned as there were 14 high-ranked companies from the Leaders List that hit new 52-week highs and were listed on the BreakOuts Page, versus 40 on the prior session. New 52-week lows totals outnumbered shrinking new 52-week highs totals on the NYSE and on the Nasdaq exchange. The market averages (M criteria) are in a "correction" and disciplined investors are reminded to reduce exposure and raise cash.
 PICTURED: The Dow Jones Industrial Average fell for a 4th consecutive loss with increasing volume totals and closed at a new 2022 low.
U.S. stocks finished lower in volatile trading Tuesday as Wall Street weighed the implications of Western sanctions on Russian energy imports. This morning, the Biden administration announced a ban on Russian fossil fuels, while the U.K. declared its own oil embargo.
In corporate news, Caterpillar Inc. (CAT +6.76%) notched its best five-day advance since June 2020 as some analysts forecast higher production capacity in light of tight supply in commodity markets. In the M&A space, Mandiant Inc. (MNDT -2%) fell after Alphabet Inc.’s (GOOGL +0.57%) Google said it would acquire the cybersecurity company for $5.4 billion.
In commodities, West Texas Intermediate crude jumped 4% to $124.16/barrel, near a 14-year high. COMEX gold advanced 3.1% to $2,057.90/ounce, while trading in nickel was suspended on the London Metal Exchange following a two-session spike of roughly 250%. Elsewhere, wheat futures dropped from a record in turbulent trading.
Treasuries weakened, with the yield on the 10-year note up seven basis points (0.07%) to 1.85%. On the data front, a measure of small business optimism unexpectedly declined to a 13-month low in February.
|
 Kenneth J. Gruneisen started out as a licensed stockbroker in August 1987, a couple of months prior to the historic stock market crash that took the Dow Jones Industrial Average down -22.6% in a single day. He has published daily fact-based fundamental and technical analysis on high-ranked stocks online for two decades. Through FACTBASEDINVESTING.COM, Kenneth provides educational articles, news, market commentary, and other information regarding proven investment systems that work in good times and bad.
Comments contained in the body of this report are technical opinions only and are not necessarily those of Gruneisen Growth Corp. The material herein has been obtained from sources believed to be reliable and accurate, however, its accuracy and completeness cannot be guaranteed. Our firm, employees, and customers may effect transactions, including transactions contrary to any recommendation herein, or have positions in the securities mentioned herein or options with respect thereto. Any recommendation contained in this report may not be suitable for all investors and it is not to be deemed an offer or solicitation on our part with respect to the purchase or sale of any securities. |
|
 |
Semiconductor, Bank, and Commodity-Linked Indexes Rose
Kenneth J. Gruneisen - Passed the CAN SLIM® Master's Exam
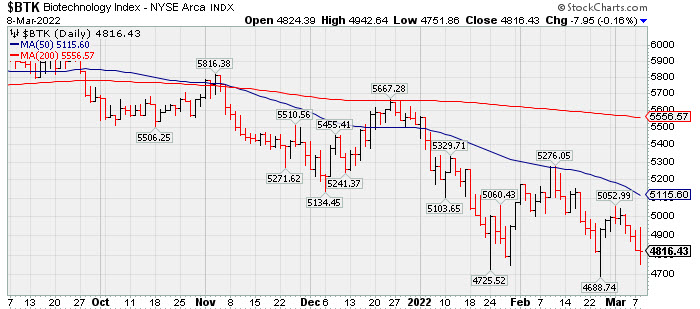
The Bank Index ($BKX +0.63%) posted a gain while the Broker/Dealer Index ($XBD -0.52%) and the Retail Index ($RLX -0.88%) created a drag on the major averages. The Semiconductor Index ($SOX +1.87%) rose while the Networking Index ($NWX -0.88%) fell and the Biotech Index ($BTK -0.16%) also inched lower. The Oil Services Index ($OSX +3.31%) and Integrated Oil Index ($XOI +1.11%) posted gains along with a smaller gain from the Gold & Silver Index ($XAU +0.91%). PICTURED: The Biotech Index ($BTK -0.16%) is sputtering near its low for 2022.
| Oil Services |
$OSX |
82.17 |
+2.63 |
+3.31% |
+55.86% |
| Integrated Oil |
$XOI |
1,536.40 |
+16.91 |
+1.11% |
+30.40% |
| Semiconductor |
$SOX |
3,156.87 |
+57.94 |
+1.87% |
-20.00% |
| Networking |
$NWX |
828.01 |
-7.38 |
-0.88% |
-14.73% |
| Broker/Dealer |
$XBD |
430.55 |
-2.24 |
-0.52% |
-11.57% |
| Retail |
$RLX |
3,454.94 |
-30.73 |
-0.88% |
-18.25% |
| Gold & Silver |
$XAU |
159.08 |
+1.43 |
+0.91% |
+20.11% |
| Bank |
$BKX |
120.46 |
+0.76 |
+0.63% |
-8.89% |
| Biotech |
$BTK |
4,816.43 |
-7.95 |
-0.16% |
-12.72% |
|
|
|
 |
Volume-Driven Gains Challenged All-Time High
Kenneth J. Gruneisen - Passed the CAN SLIM® Master's Exam
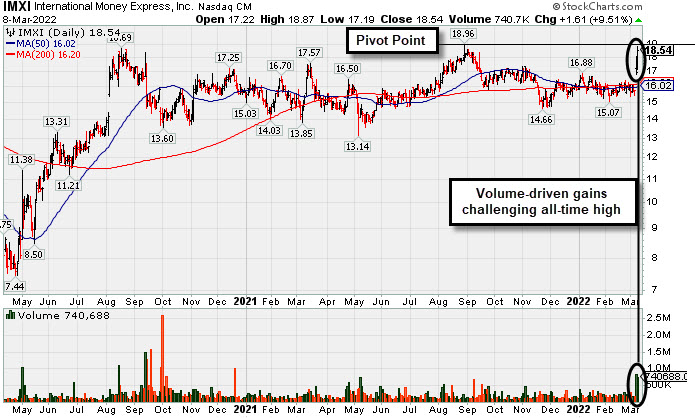
International Money Express (IMXI +$1.47 or +8.68% to $18.40) was highlighted in yellow in the earlier mid-day report (read here) with pivot point cited based on its 8/30/21 high plus 10 cents. It challenged its all-time high with today's 2nd consecutive big volume-driven gain. Subsequent gains above the pivot point backed by at least +40% above average volume may trigger a technical buy signal. Disciplined investors know to avoid new buying efforts until a confirmed rally with follow through day from the major averages (M criteria) under the fact-based investment system's strict rules.
Through the Dec '21 quarter the Financial Services-Specialty firm's quarterly and annual earnings (C and A criteria) history has been strong and backed by solid sales revenues growth. The past 6 quarterly comparisons showed earnings increases above the year ago period by more than +25% (C criteria). Annual earnings growth has been strong and it has a 95 Earnings Per Share Rating.
There is a small supply of only 32.4 million shares outstanding (S criteria) which can contribute to greater price volatility in the event of institutional buying or selling. The number of top-rated funds owning its shares rose from 210 in Mar '21 to 241 in Dec '21, a reassuring sign concerning the I criteria. Its current Up/Down Volume Ration of 1.2 is an unbiased indication its shares have been under accumulation over the past 50 days.
|
|
|
Color Codes Explained :
Y - Better candidates highlighted by our
staff of experts.
G - Previously featured
in past reports as yellow but may no longer be buyable under the
guidelines.
***Last / Change / Volume data in this table is the closing quote data***
|
|
|
THESE ARE NOT BUY RECOMMENDATIONS!
Comments contained in the body of this report are technical
opinions only. The material herein has been obtained
from sources believed to be reliable and accurate, however,
its accuracy and completeness cannot be guaranteed.
This site is not an investment advisor, hence it does
not endorse or recommend any securities or other investments.
Any recommendation contained in this report may not
be suitable for all investors and it is not to be deemed
an offer or solicitation on our part with respect to
the purchase or sale of any securities. All trademarks,
service marks and trade names appearing in this report
are the property of their respective owners, and are
likewise used for identification purposes only.
This report is a service available
only to active Paid Premium Members.
You may opt-out of receiving report notifications
at any time. Questions or comments may be submitted
by writing to Premium Membership Services 665 S.E. 10 Street, Suite 201 Deerfield Beach, FL 33441-5634 or by calling 1-800-965-8307
or 954-785-1121.
|
|
|