You are not logged in.
This means you
CAN ONLY VIEW reports that were published prior to Thursday, April 3, 2025.
You
MUST UPGRADE YOUR MEMBERSHIP if you want to see any current reports.
AFTER MARKET UPDATE - WEDNESDAY, MARCH 2ND, 2022
Previous After Market Report Next After Market Report >>>
|
|
|
|
DOW |
+596.40 |
33,891.35 |
+1.79% |
|
Volume |
1,131,062,175 |
-15% |
|
Volume |
5,193,425,500 |
-14% |
|
NASDAQ |
+219.56 |
13,752.02 |
+1.62% |
|
Advancers |
2,222 |
71% |
|
Advancers |
2,786 |
64% |
|
S&P 500 |
+80.28 |
4,386.54 |
+1.86% |
|
Decliners |
907 |
29% |
|
Decliners |
1,553 |
36% |
|
Russell 2000 |
+50.37 |
2,058.87 |
+2.51% |
|
52 Wk Highs |
127 |
|
|
52 Wk Highs |
77 |
|
|
S&P 600 |
+35.29 |
1,326.40 |
+2.73% |
|
52 Wk Lows |
99 |
|
|
52 Wk Lows |
215 |
|
|
The major averages signaled a market correction (M criteria) with last week's noted plunge to new lows for the year. Thursday, March 3rd marks Day 6 of the new rally attempt. Followers of the fact-based investment system know to patiently watch for a solid follow-through day between Day 4-7 to confirm a new uptrend before any new buying efforts may be justified.
|
 |
Indices Rose With Lighter Volume - Not a Solid Follow Through
Kenneth J. Gruneisen - Passed the CAN SLIM® Master's Exam
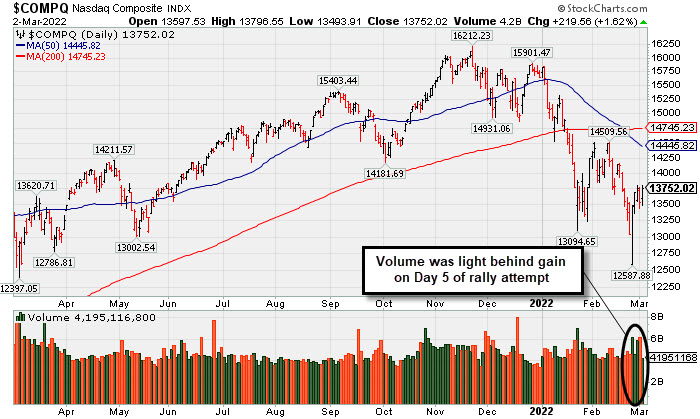
The Dow jumped 596 points, while the S&P 500 rebounded 1.9%. The Nasdaq Composite rallied 1.6%, recouping Tuesday’s losses. Volume totals reported were lighter than the prior session on the NYSE and on the Nasdaq exchange, revealing lackluster buying demand coming from the institutional crowd. Breadth was positive as advancers led decliners by more than a 2-1 margin on the NYSE and 5-3 on the Nasdaq exchange. There were 38 high-ranked companies from the Leaders List that hit new 52-week highs and were listed on the BreakOuts Page, versus 32 on the prior session. New 52-week highs outnumbered new 52-week lows on the NYSE but new lows still outnumbered new highs on the Nasdaq exchange. The market averages (M criteria) are in a "correction" and disciplined investors are reminded to reduce exposure and raise cash.
 PICTURED: The Nasdaq Composite Index posted a gain with lighter volume on Day 5 of a new rally attempt after slumping well below Its 200-day moving average (DMA) line to a new 2022 low.
U.S. stocks finished firmly higher on Wednesday as investors monitored the ongoing Russia-Ukraine conflict and parsed Federal Reserve (Fed) Chair Jerome Powell’s semi-annual testimony before the House Financial Services Committee. The Fed chief voiced his support for a 25-basis point (0.25%) rate hike at the March policy meeting, but noted that officials could raise rates at a faster clip in the future to combat persistent inflation. Powell also acknowledged that geopolitical tensions in Eastern Europe had added a layer of uncertainty to the outlook.
Treasuries declined for the first time in five days, with the yield on the 10-year note surging 17 basis points (0.17%) to 1.90%, while the two-year note yield spiked 18 basis points (0.18%) to 1.53%. On the data front, U.S. private payrolls increased 475,000 in February, while the prior month’s contraction was upwardly revised to reflect a gain of 509,000. Meanwhile, energy markets extended recent gains as refiners self-imposed restrictions on purchasing Russian oil. West Texas Intermediate crude jumped another 7.7% to $111.33/barrel, near an overnight peak of $111.50/barrel, the highest level in over a decade.
All 11 S&P 500 finished in positive territory, with Financials, Materials and Energy stocks leading the bounce. In earnings, Nordstrom, Inc. (JWN +37.82%) soared following a top and bottom line beat. Meanwhile, Ford Motor Co. (F +8.38%) rose on plans to separate its electric vehicle operations from its legacy business. |
 Kenneth J. Gruneisen started out as a licensed stockbroker in August 1987, a couple of months prior to the historic stock market crash that took the Dow Jones Industrial Average down -22.6% in a single day. He has published daily fact-based fundamental and technical analysis on high-ranked stocks online for two decades. Through FACTBASEDINVESTING.COM, Kenneth provides educational articles, news, market commentary, and other information regarding proven investment systems that work in good times and bad.
Comments contained in the body of this report are technical opinions only and are not necessarily those of Gruneisen Growth Corp. The material herein has been obtained from sources believed to be reliable and accurate, however, its accuracy and completeness cannot be guaranteed. Our firm, employees, and customers may effect transactions, including transactions contrary to any recommendation herein, or have positions in the securities mentioned herein or options with respect thereto. Any recommendation contained in this report may not be suitable for all investors and it is not to be deemed an offer or solicitation on our part with respect to the purchase or sale of any securities. |
|
 |
Financial, Tech, and Energy-Linked Groups Led Gainers
Kenneth J. Gruneisen - Passed the CAN SLIM® Master's Exam
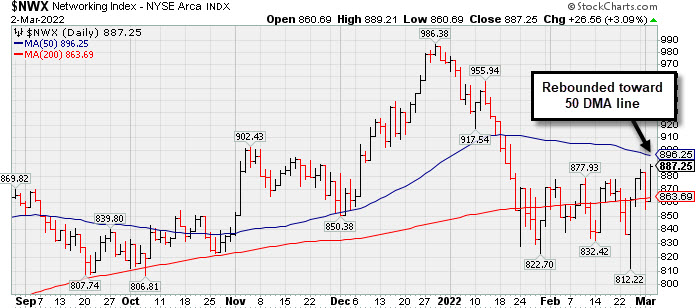
The Bank Index ($BKX +3.61%) and Broker/Dealer Index ($XBD +1.98%) posted influential gains and the Retail Index ($RLX +1.54%) also rose, helping to lift the major averages. The Semiconductor Index ($SOX +3.37%) and Networking Index ($NWX +3.09%) both posted solid gains to lead the tech sector higher while the Biotech Index ($BTK +0.28%) only inched higher. The Oil Services Index ($OSX +4.42%) and Integrated Oil Index ($XOI +2.08%) both posted solid gains while the Gold & Silver Index ($XAU -0.30%) edged lower. PICTURED: The Networking Index ($NWX +3.09%) rebounded toward its 50-day moving average after consolidating near its 200-day moving average (DMA) line.
| Oil Services |
$OSX |
70.83 |
+3.00 |
+4.42% |
+34.35% |
| Integrated Oil |
$XOI |
1,501.73 |
+30.67 |
+2.08% |
+27.46% |
| Semiconductor |
$SOX |
3,416.16 |
+111.31 |
+3.37% |
-13.43% |
| Networking |
$NWX |
887.25 |
+26.56 |
+3.09% |
-8.63% |
| Broker/Dealer |
$XBD |
473.49 |
+9.19 |
+1.98% |
-2.75% |
| Retail |
$RLX |
3,741.36 |
+56.86 |
+1.54% |
-11.48% |
| Gold & Silver |
$XAU |
148.91 |
-0.45 |
-0.30% |
+12.43% |
| Bank |
$BKX |
131.04 |
+4.56 |
+3.61% |
-0.89% |
| Biotech |
$BTK |
5,005.84 |
+13.73 |
+0.28% |
-9.29% |
|
|
|
 |
Still Quietly Consolidating Above 200 DMA Line
Kenneth J. Gruneisen - Passed the CAN SLIM® Master's Exam
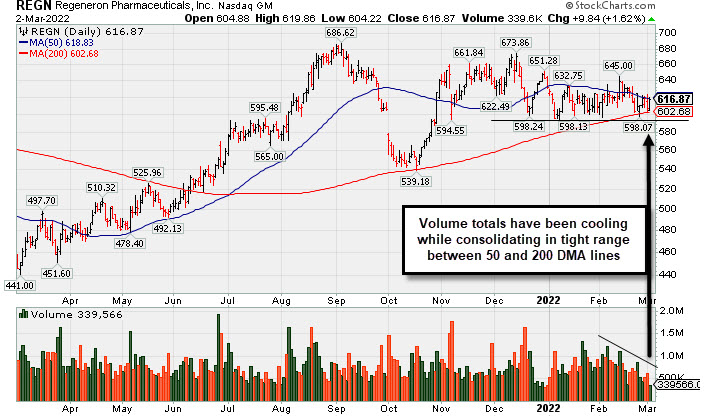
Regeneron Pharmaceuticals Inc (REGN +$9.84 or +1.62% to $616.87) volume totals have been cooling while still consolidating in a tight range below its 50-day moving average (DMA) line ($618.83) and above its 200 DMA line ($602.68). Prior lows in the $592-596 area define additional near-term support to watch. Its Relative Strength rating is 85, still well above the 80+ minimum guideline for buy candidates. A rebound above the 50 DMA line is needed for its outlook to improve, but it faces additional resistance due to overhead supply.
REGN was last covered in greater detail on 2/01/22 with an annotated graph under the headline, "Earnings News Due While Consolidating Above 200 DMA Line". The high-ranked DRUGS - Biotechnology firm reported earnings +149% on +104% sales revenues for the Dec '21 quarter versus the year ago period. That marked its 6th quarterly comparison above the +25% minimum earnings guideline (C criteria) and with a strong sales revenues growth rate. Its annual earnings (A criteria) growth has been strong. It has a 99 Earnings Per Share Rating.
There are 2,743 top-rated funds that own its shares as of Dec '21, up from 2,376 in Dec '20, a reassuring sign concerning the I criteria. Its current Up/Down Volume Ratio of 1.1 is an unbiased indication its shares have been under slight accumulation over the past 50 days. REGN completed a Secondary Offering on 5/28/20. There are 97.1 million shares in the public float (S criteria) which can contribute to greater volatility in the event of institutional buying or selling.
|
|
|
Color Codes Explained :
Y - Better candidates highlighted by our
staff of experts.
G - Previously featured
in past reports as yellow but may no longer be buyable under the
guidelines.
***Last / Change / Volume data in this table is the closing quote data***
|
|
|
THESE ARE NOT BUY RECOMMENDATIONS!
Comments contained in the body of this report are technical
opinions only. The material herein has been obtained
from sources believed to be reliable and accurate, however,
its accuracy and completeness cannot be guaranteed.
This site is not an investment advisor, hence it does
not endorse or recommend any securities or other investments.
Any recommendation contained in this report may not
be suitable for all investors and it is not to be deemed
an offer or solicitation on our part with respect to
the purchase or sale of any securities. All trademarks,
service marks and trade names appearing in this report
are the property of their respective owners, and are
likewise used for identification purposes only.
This report is a service available
only to active Paid Premium Members.
You may opt-out of receiving report notifications
at any time. Questions or comments may be submitted
by writing to Premium Membership Services 665 S.E. 10 Street, Suite 201 Deerfield Beach, FL 33441-5634 or by calling 1-800-965-8307
or 954-785-1121.
|
|
|