You are not logged in.
This means you
CAN ONLY VIEW reports that were published prior to Thursday, April 10, 2025.
You
MUST UPGRADE YOUR MEMBERSHIP if you want to see any current reports.
AFTER MARKET UPDATE - WEDNESDAY, MARCH 9TH, 2011
Previous After Market Report Next After Market Report >>>
|
|
|
|
DOW |
-1.29 |
12,213.09 |
-0.01% |
|
Volume |
871,226,970 |
-13% |
|
Volume |
1,948,732,090 |
+9% |
|
NASDAQ |
-14.05 |
2,751.72 |
-0.51% |
|
Advancers |
1,389 |
45% |
|
Advancers |
1,083 |
39% |
|
S&P 500 |
-1.81 |
1,320.01 |
-0.14% |
|
Decliners |
1,612 |
52% |
|
Decliners |
1,556 |
57% |
|
Russell 2000 |
-3.47 |
821.19 |
-0.42% |
|
52 Wk Highs |
157 |
|
|
52 Wk Highs |
92 |
|
|
S&P 600 |
-0.40 |
436.17 |
-0.09% |
|
52 Wk Lows |
10 |
|
|
52 Wk Lows |
33 |
|
|
 |
Nasdaq Lagged While Tech Shares Faced Pressure
Kenneth J. Gruneisen - Passed the CAN SLIM® Master's Exam
On Wednesday the major averages wobbled through the session and finished with small losses. Volume totals were mixed, reported lighter on the NYSE and higher on the Nasdaq exchange versus the prior session's totals. Decliners led advancers by nearly 3-2 on the Nasdaq exchange and by a narrower 8-7 margin on the NYSE. New 52-week highs outnumbered new 52-week lows on the NYSE and on the Nasdaq exchange. There was a total of 45 high-ranked companies from the CANSLIM.net Leaders List that made new 52-week highs and appeared on the CANSLIM.net BreakOuts Page, up from a total of 41 on the prior session. On the Featured Stocks Page there were gains from 9 of the 22 high-ranked market leaders currently listed.
An economic report suggested the recovery is intact. January wholesale inventories rose 1.1%, more than expected, but failed to keep pace with a 3.4% increase in sales. Strengthening demand indicates orders to factories will keep rising.
The price of oil lifted above $105 per barrel after news that Libya’s largest oil refinery was closed because of fighting between government and opposition forces. Supplies of West Texas Intermediate, the U.S. benchmark grade of crude, reportedly surged to the highest level since at least 2004.
Finisar Corp (FNSR -38.5%) plunged after profits missed expectations, weighing on other makers of networking equipment including JDS Uniphase Corp (JDSU -16.71%). International Business Machines Corp. (IBM +2.2%) was a standout in the Dow for the second day in a row after seven brokerage firms boosted price targets following a presentation by the company. Texas Instruments Inc (TXN -3.12%) and Honeywell International Inc (HON -1%) declined after earnings forecasts failed to impress.
A recent expansion in leadership (new highs) has been noted as a reassuring sign that the market's rally may still have some legs. However, any additional distribution days in the near term could prove more damaging and may lead to a more substantial correction for the major averages. New buying efforts should be cautiously and carefully made, only when all of the investment system's key criteria are met. As always, limit losses if ever a stock falls more than -7% from your purchase price.
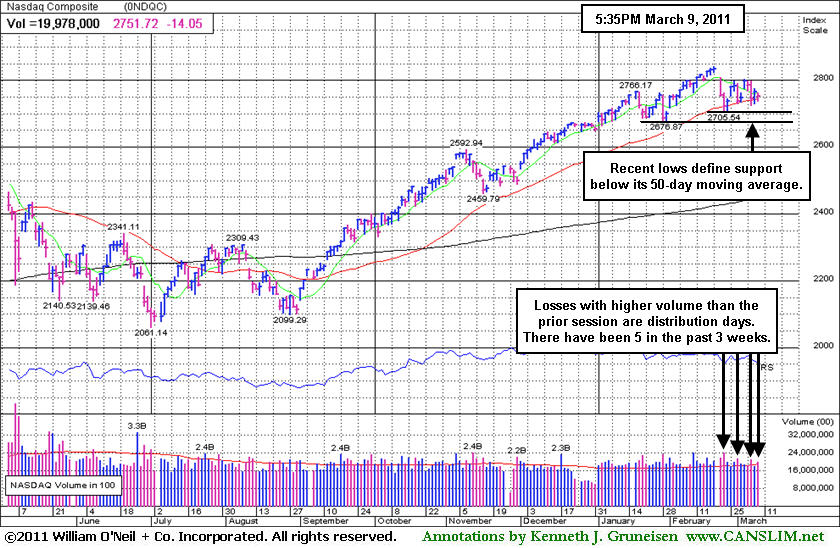
PICTURED: The Nasdaq Composite Index is often noted as the "tech-heavy" index. The session's negative bias in the tech sector led to a larger loss than seen in the other major averages. There have been 5 distribution days in the past 3 weeks, a sign the rally is under pressure. It is making a stand near its 50-day moving average (DMA) line while prior lows define the next support levels to watch.
|
 Kenneth J. Gruneisen started out as a licensed stockbroker in August 1987, a couple of months prior to the historic stock market crash that took the Dow Jones Industrial Average down -22.6% in a single day. He has published daily fact-based fundamental and technical analysis on high-ranked stocks online for two decades. Through FACTBASEDINVESTING.COM, Kenneth provides educational articles, news, market commentary, and other information regarding proven investment systems that work in good times and bad.
Comments contained in the body of this report are technical opinions only and are not necessarily those of Gruneisen Growth Corp. The material herein has been obtained from sources believed to be reliable and accurate, however, its accuracy and completeness cannot be guaranteed. Our firm, employees, and customers may effect transactions, including transactions contrary to any recommendation herein, or have positions in the securities mentioned herein or options with respect thereto. Any recommendation contained in this report may not be suitable for all investors and it is not to be deemed an offer or solicitation on our part with respect to the purchase or sale of any securities. |
|
 |
SOX Violated 50-Day Average; Retail and Healthcare Led Gainers
Kenneth J. Gruneisen - Passed the CAN SLIM® Master's Exam
The Retail Index ($RLX +0.71%) and Healthcare Index ($HMO +1.47%) were among the leading groups on Wednesday. The Broker/Dealer Index ($XBD -0.62%) ended modestly lower while the Bank Index ($BKX +0.09%) held its ground. The tech sector created a drag on the major averages as the Semiconductor Index ($SOX -3.03%) and Networking Index ($NWX -2.24%) suffered larger losses while the Internet Index ($IIX -0.42%) edged lower and the Biotechnology Index ($BTK -0.03%) essentially ended unchanged. Commodity-linked groups also had a negative bias as the Gold & Silver Index ($XAU -1.57%), Oil Services Index ($OSX -1.06%), and Integrated Oil Index ($XOI -0.47%) lost ground.
Charts courtesy www.stockcharts.com
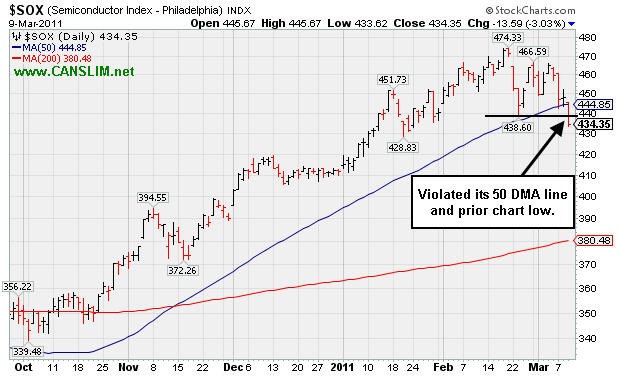
PICTURED: The Semiconductor Index ($SOX -3.03%) violated its 50-day moving average (DMA) line and prior chart low. Monday's Industry Group Watch section (read here) illustrated an earlier violation of an upward trendline which raised concerns the group was weakening.
| Oil Services |
$OSX |
283.81 |
-3.04 |
-1.06% |
+15.78% |
| Healthcare |
$HMO |
2,101.85 |
+30.42 |
+1.47% |
+24.22% |
| Integrated Oil |
$XOI |
1,341.10 |
-6.40 |
-0.47% |
+10.55% |
| Semiconductor |
$SOX |
434.35 |
-13.59 |
-3.03% |
+5.47% |
| Networking |
$NWX |
324.14 |
-7.42 |
-2.24% |
+15.53% |
| Internet |
$IIX |
314.00 |
-1.33 |
-0.42% |
+2.04% |
| Broker/Dealer |
$XBD |
123.38 |
-0.78 |
-0.62% |
+1.54% |
| Retail |
$RLX |
510.31 |
+3.58 |
+0.71% |
+0.38% |
| Gold & Silver |
$XAU |
208.78 |
-3.34 |
-1.57% |
-7.86% |
| Bank |
$BKX |
53.31 |
+0.05 |
+0.09% |
+2.11% |
| Biotech |
$BTK |
1,291.03 |
-0.39 |
-0.03% |
-0.51% |
|
|
|
 |
Market Behavior Likely To Sway Leader's Direction
Kenneth J. Gruneisen - Passed the CAN SLIM® Master's Exam
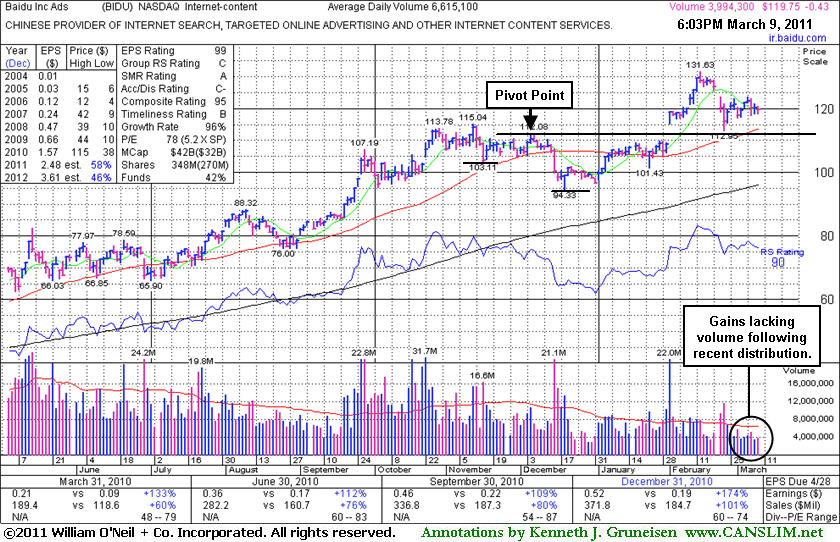
Baidu Inc. (BIDU -$0.43 or -0.36% to $119.75) has been consolidating above its 50-day moving average (DMA) line and recent chart lows defining important chart support to watch. In recent weeks, following distributional losses, its gains have been backed by below average volume. After it was shown in the February 2011 issue of CANSLIM.net News under the headline, "Breakaway Gap After Impressive Acceleration In Latest Quarter", this high-ranked China-based firm in the Internet - Content industry rallied even further into all-time high ground before stalling. It had been explained - "That gap up gain may be considered a 'breakaway gap' and its strong finish at the session high allowed it to hit and close at a new all-time high. A breakaway gap is the one noted exception where the usual limit can be stretched to allow for disciplined investors to buy as much as +10% above the pivot point ($112.08 X 1.1 = $123.29), however risk obviously increases the further one buys from a proper pivot point. There is no overhead supply to act as resistance, so it could then easily rise unhindered for more climactic gains."
BIDU has sputtered while the major averages endured distributional pressure. Since 3 out of 4 stocks tend to follow in the direction of the major averages (M criteria), the broader market's behavior in the near-term will largely dictate what the future will hold. Reasons to remain optimistic include the fact that it has maintained very strong quarterly and annual earnings (C and A criteria) history. Fundamentally, its sales revenues and earnings increases have been impressive in the 4 most recent quarterly comparisons, solidly above the +25% guideline, and its latest quarter ended December 31, 2010 continued a streak of sequential comparisons showing impressive acceleration in its sales revenues growth. Return On Equity is reported at 55%, well above the 17% minimum guideline. The number of top-rated funds owning its shares rose from 835 in Mar '10 to to 1,016 in Dec '10, a reassuring sign concerning the I criteria.
|
|
|
Color Codes Explained :
Y - Better candidates highlighted by our
staff of experts.
G - Previously featured
in past reports as yellow but may no longer be buyable under the
guidelines.
***Last / Change / Volume data in this table is the closing quote data***
Symbol/Exchange
Company Name
Industry Group |
PRICE |
CHANGE
(%Change) |
Day High |
Volume
(% DAV)
(% 50 day avg vol) |
52 Wk Hi
% From Hi |
Featured
Date |
Price
Featured |
Pivot Featured |
|
Max Buy |
BIDU
-
NASDAQ
Baidu Inc Ads
INTERNET - Internet Information Providers
|
$119.75
|
-0.43
-0.36% |
$120.61
|
3,994,273
60.38% of 50 DAV
50 DAV is 6,615,100
|
$131.63
-9.03%
|
2/1/2011
|
$117.74
|
PP = $112.08
|
|
MB = $117.68
|
 Most Recent Note - 3/9/2011 6:29:21 PM
G - In recent weeks its gains have been backed by below average volume. Consolidating above its 50 DMA line and recent chart low defining important chart support to watch. See latest FSU analysis for details and a new annotated graph.
>>> The latest Featured Stock Update with an annotated graph appeared on 3/9/2011. Click here.
View all notes |
Alert me of new notes |
CANSLIM.net Company Profile |
SEC |
Zacks Reports |
StockTalk |
News |
Chart |
Request a new note
C
A N
S L
I M


|
CMG
-
NYSE
Chipotle Mexican Grill
LEISURE - Restaurants
|
$251.41
|
+1.74
0.70% |
$253.09
|
686,356
64.89% of 50 DAV
50 DAV is 1,057,800
|
$275.00
-8.58%
|
2/11/2011
|
$271.15
|
PP = $262.87
|
|
MB = $276.01
|
Most Recent Note - 3/8/2011 4:59:17 PM
G - Consolidating above support at its 50 DMA line and prior highs in the $237 area. A violation and damaging loss would raise greater concerns and trigger a technical sell signal.
>>> The latest Featured Stock Update with an annotated graph appeared on 2/11/2011. Click here.
View all notes |
Alert me of new notes |
CANSLIM.net Company Profile |
SEC |
Zacks Reports |
StockTalk |
News |
Chart |
Request a new note
C
A N
S L
I M
|
CRUS
-
NASDAQ
Cirrus Logic Inc
ELECTRONICS - Semiconductor - Specialized
|
$21.24
|
-1.87
-8.09% |
$22.97
|
4,463,176
125.79% of 50 DAV
50 DAV is 3,548,200
|
$25.48
-16.64%
|
1/28/2011
|
$20.69
|
PP = $19.17
|
|
MB = $20.13
|
Most Recent Note - 3/9/2011 1:23:20 PM
G - Down today for a 4th consecutive loss, slumping near support above prior resistance. Its recent low (2/23/11 low $21.17) and much earlier high close ($20.54 on 7/26/10) define chart support to watch along with its 50 DMA line.
>>> The latest Featured Stock Update with an annotated graph appeared on 3/4/2011. Click here.
View all notes |
Alert me of new notes |
CANSLIM.net Company Profile |
SEC |
Zacks Reports |
StockTalk |
News |
Chart |
Request a new note
C
A N
S L
I M
|
CTSH
-
NASDAQ
Cognizant Tech Sol Cl A
COMPUTER SOFTWARE and SERVICES - Business Software and Services
|
$78.41
|
+0.63
0.80% |
$78.69
|
3,661,486
163.89% of 50 DAV
50 DAV is 2,234,100
|
$77.96
0.58%
|
2/7/2011
|
$75.09
|
PP = $76.46
|
|
MB = $80.28
|
Most Recent Note - 3/9/2011 4:33:58 PM
Y - Up today on +64% above average volume for a new high, a welcome reconfirming gain indicative of institutional accumulation. Found support at its 50 DMA line, and no overhead supply remains to hinder its progress.
>>> The latest Featured Stock Update with an annotated graph appeared on 2/8/2011. Click here.
View all notes |
Alert me of new notes |
CANSLIM.net Company Profile |
SEC |
Zacks Reports |
StockTalk |
News |
Chart |
Request a new note
C
A N
S L
I M
|
DECK
-
NASDAQ
Deckers Outdoor Corp
CONSUMER NON-DURABLES - Textile - Apparel Footwear
|
$86.00
|
-1.79
-2.04% |
$88.36
|
996,945
61.88% of 50 DAV
50 DAV is 1,611,100
|
$94.70
-9.19%
|
2/3/2011
|
$79.61
|
PP = $82.67
|
|
MB = $86.80
|
Most Recent Note - 3/9/2011 4:42:39 PM
G - Small loss today on light volume followed 5 consecutive small gains on light or near average volume. Support to watch is at its pivot point and 50 DMA line.
>>> The latest Featured Stock Update with an annotated graph appeared on 3/3/2011. Click here.
View all notes |
Alert me of new notes |
CANSLIM.net Company Profile |
SEC |
Zacks Reports |
StockTalk |
News |
Chart |
Request a new note
C
A N
S L
I M
|
Symbol/Exchange
Company Name
Industry Group |
PRICE |
CHANGE
(%Change) |
Day High |
Volume
(% DAV)
(% 50 day avg vol) |
52 Wk Hi
% From Hi |
Featured
Date |
Price
Featured |
Pivot Featured |
|
Max Buy |
EBIX
-
NASDAQ
Ebix Inc
COMPUTER SOFTWARE and SERVICES - Business Software and Services
|
$28.87
|
+0.30
1.05% |
$29.57
|
696,230
128.53% of 50 DAV
50 DAV is 541,700
|
$29.61
-2.50%
|
2/28/2011
|
$25.70
|
PP = $25.97
|
|
MB = $27.27
|
Most Recent Note - 3/9/2011 4:43:29 PM
G - Still hovering near its 52-week high, extended beyond the "max buy" level previously noted. Prior highs in the $25-26 area define initial support to watch above its 50 DMA line.
>>> The latest Featured Stock Update with an annotated graph appeared on 2/28/2011. Click here.
View all notes |
Alert me of new notes |
CANSLIM.net Company Profile |
SEC |
Zacks Reports |
StockTalk |
News |
Chart |
Request a new note
C
A N
S L
I M
|
EZCH
-
NASDAQ
Ezchip Semiconductor Ltd
ELECTRONICS - Semiconductor - Specialized
|
$29.73
|
-0.57
-1.88% |
$30.02
|
283,900
73.70% of 50 DAV
50 DAV is 385,200
|
$33.48
-11.20%
|
12/2/2010
|
$27.53
|
PP = $26.00
|
|
MB = $27.30
|
Most Recent Note - 3/9/2011 3:46:50 PM
G - Pulling back with increasing volume today. Its 50 DMA line recently has acted as resistance while volume totals have cooled. A convincing rebound above its short-term average would help its outlook, meanwhile it faces overhead supply up through the $33 area which may hinder its ability to rally.
>>> The latest Featured Stock Update with an annotated graph appeared on 3/1/2011. Click here.
View all notes |
Alert me of new notes |
CANSLIM.net Company Profile |
SEC |
Zacks Reports |
StockTalk |
News |
Chart |
Request a new note
C
A N
S L
I M
|
EZPW
-
NASDAQ
Ezcorp Inc Cl A
SPECIALTY RETAIL - Specialty Retail, Other
|
$28.47
|
-0.62
-2.13% |
$29.19
|
275,404
73.82% of 50 DAV
50 DAV is 373,100
|
$29.94
-4.91%
|
2/18/2011
|
$27.94
|
PP = $30.04
|
|
MB = $31.54
|
Most Recent Note - 3/9/2011 3:49:21 PM
Y - Consolidating -4.7% off its 52-week high now, above its 50 DMA line and showing recent resilience. Subsequent gains with heavy volume above its pivot point may trigger a new (or add-on) technical buy signal. Recent low ($25.56 on 1/25/11) defines an important support level.
>>> The latest Featured Stock Update with an annotated graph appeared on 2/3/2011. Click here.
View all notes |
Alert me of new notes |
CANSLIM.net Company Profile |
SEC |
Zacks Reports |
StockTalk |
News |
Chart |
Request a new note
C
A N
S L
I M
|
FOSL
-
NASDAQ
Fossil Inc
CONSUMER DURABLES - Recreational Goods, Other
|
$84.83
|
+1.62
1.95% |
$85.20
|
1,065,004
119.34% of 50 DAV
50 DAV is 892,400
|
$84.19
0.76%
|
2/1/2011
|
$73.30
|
PP = $74.44
|
|
MB = $78.16
|
Most Recent Note - 3/9/2011 3:53:00 PM
G - Hit a new all-time high today with a 6th consecutive gain, extended from its prior base. It found support at its 50 DMA line while consolidating above prior resistance in the $74 area.
>>> The latest Featured Stock Update with an annotated graph appeared on 2/24/2011. Click here.
View all notes |
Alert me of new notes |
CANSLIM.net Company Profile |
SEC |
Zacks Reports |
StockTalk |
News |
Chart |
Request a new note
C
A N
S L
I M
|
GSIT
-
NASDAQ
G S I Technology Inc
ELECTRONICS - Semiconductor - Broad Line
|
$8.83
|
-0.19
-2.11% |
$9.01
|
273,235
113.47% of 50 DAV
50 DAV is 240,800
|
$10.20
-13.43%
|
2/18/2011
|
$10.08
|
PP = $10.25
|
|
MB = $10.76
|
Most Recent Note - 3/9/2011 4:41:21 PM
G - Down today with higher and slightly above average volume, slumping further below its 50 DMA line near prior lows in the $8.60-8.80 range previously noted as important chart support. A rally and strong close above its 2/18/11 close ($9.78) would help its outlook following its damaging 2/22/11 gap down.
>>> The latest Featured Stock Update with an annotated graph appeared on 2/18/2011. Click here.
View all notes |
Alert me of new notes |
CANSLIM.net Company Profile |
SEC |
Zacks Reports |
StockTalk |
News |
Chart |
Request a new note
C
A N
S L
I M
|
Symbol/Exchange
Company Name
Industry Group |
PRICE |
CHANGE
(%Change) |
Day High |
Volume
(% DAV)
(% 50 day avg vol) |
52 Wk Hi
% From Hi |
Featured
Date |
Price
Featured |
Pivot Featured |
|
Max Buy |
HMSY
-
NASDAQ
H M S Holdings Corp
COMPUTER SOFTWARE and SERVICES - Healthcare Information Service
|
$80.77
|
+0.01
0.01% |
$81.36
|
138,471
83.87% of 50 DAV
50 DAV is 165,100
|
$81.20
-0.53%
|
11/19/2010
|
$61.89
|
PP = $63.01
|
|
MB = $66.16
|
Most Recent Note - 3/8/2011 5:13:59 PM
G - Hit another new all-time high with a gain on light volume today adding to its spurt of gains. Getting more extended from any sound base pattern, support to watch is defined by prior chart highs and its 50 DMA line in the $67 area.
>>> The latest Featured Stock Update with an annotated graph appeared on 2/16/2011. Click here.
View all notes |
Alert me of new notes |
CANSLIM.net Company Profile |
SEC |
Zacks Reports |
StockTalk |
News |
Chart |
Request a new note
C
A N
S L
I M
|
JOBS
-
NASDAQ
Fifty One Job Inc Ads
DIVERSIFIED SERVICES - Staffing and; Outsourcing Service
|
$57.52
|
-0.18
-0.31% |
$57.73
|
137,592
106.00% of 50 DAV
50 DAV is 129,800
|
$64.55
-10.89%
|
2/7/2011
|
$59.23
|
PP = $61.38
|
|
MB = $64.45
|
Most Recent Note - 3/9/2011 4:46:10 PM
G - Loss today with average volume was its 7th loss in 8 sessions, and after action indicative of distributional pressure its color code was changed to green. Recently churned above average volume and stalled near its pivot point noted nearly a month ago. Gains for new highs with well above average volume would be a reassuring sign of accumulation by institutional investors, meanwhile its recent low ($52.58 on 1/28/11) defines support below its 50 DMA line where violations would trigger technical sell signals.
>>> The latest Featured Stock Update with an annotated graph appeared on 2/7/2011. Click here.
View all notes |
Alert me of new notes |
CANSLIM.net Company Profile |
SEC |
Zacks Reports |
StockTalk |
News |
Chart |
Request a new note
C
A N
S L
I M
|
LULU
-
NASDAQ
Lululemon Athletica
MANUFACTURING - Textile Manufacturing
|
$76.05
|
+0.79
1.05% |
$77.35
|
1,257,882
63.86% of 50 DAV
50 DAV is 1,969,800
|
$85.28
-10.82%
|
1/26/2011
|
$68.11
|
PP = $74.70
|
|
MB = $78.44
|
Most Recent Note - 3/9/2011 4:47:31 PM
Y - Quieter volume has been behind recent gains while consolidating just above its 50 DMA line, an important support level. A close below a significant prior high close ($73.51 on 12/21/10) would completely negate its latest breakout, raising more serious concerns.
>>> The latest Featured Stock Update with an annotated graph appeared on 2/25/2011. Click here.
View all notes |
Alert me of new notes |
CANSLIM.net Company Profile |
SEC |
Zacks Reports |
StockTalk |
News |
Chart |
Request a new note
C
A N
S L
I M
|
MWIV
-
NASDAQ
M W I Veterinary Supply
HEALTH SERVICES - Medical Instruments and; Supplies
|
$78.02
|
+1.37
1.79% |
$78.48
|
227,631
291.83% of 50 DAV
50 DAV is 78,000
|
$76.82
1.56%
|
11/4/2010
|
$61.79
|
PP = $59.60
|
|
MB = $62.58
|
Most Recent Note - 3/9/2011 12:25:32 PM
G - Up again today, extending its streak of gains with above average volume for another new all-time high. Found support near prior highs and its 50 DMA line recently but did not build a sound new base pattern. See the latest FSU analysis for more details and a new annotated graph.
>>> The latest Featured Stock Update with an annotated graph appeared on 3/8/2011. Click here.
View all notes |
Alert me of new notes |
CANSLIM.net Company Profile |
SEC |
Zacks Reports |
StockTalk |
News |
Chart |
Request a new note
C
A N
S L
I M
|
OPEN
-
NASDAQ
Opentable Inc
INTERNET - Internet Software and Services
|
$87.50
|
+0.25
0.29% |
$88.95
|
591,321
55.74% of 50 DAV
50 DAV is 1,060,900
|
$95.97
-8.83%
|
1/5/2011
|
$74.05
|
PP = $76.79
|
|
MB = $80.63
|
Most Recent Note - 3/7/2011 10:59:27 AM
G - Consolidating above prior resistance near $82 and above its 50 DMA line. Its brief consolidation of about 4 weeks has the look of a bullish base-on-base type pattern forming, but a proper "flat base" should be a minimum of 5 weeks in length.
>>> The latest Featured Stock Update with an annotated graph appeared on 2/15/2011. Click here.
View all notes |
Alert me of new notes |
CANSLIM.net Company Profile |
SEC |
Zacks Reports |
StockTalk |
News |
Chart |
Request a new note
C
A N
S L
I M
|
Symbol/Exchange
Company Name
Industry Group |
PRICE |
CHANGE
(%Change) |
Day High |
Volume
(% DAV)
(% 50 day avg vol) |
52 Wk Hi
% From Hi |
Featured
Date |
Price
Featured |
Pivot Featured |
|
Max Buy |
ORCL
-
NASDAQ
Oracle Corp
COMPUTER SOFTWARE and SERVICES - Application Software
|
$32.79
|
+0.05
0.14% |
$33.14
|
17,189,438
72.84% of 50 DAV
50 DAV is 23,600,200
|
$33.71
-2.73%
|
1/20/2011
|
$32.31
|
PP = $32.37
|
|
MB = $33.99
|
Most Recent Note - 3/9/2011 4:49:01 PM
Y - Consolidating just above its 50 DMA line again. Its prior low previously noted ($30.80 on 1/10/11) defines the next important chart support level to watch.
>>> The latest Featured Stock Update with an annotated graph appeared on 2/22/2011. Click here.
View all notes |
Alert me of new notes |
CANSLIM.net Company Profile |
SEC |
Zacks Reports |
StockTalk |
News |
Chart |
Request a new note
C
A N
S L
I M
|
PAY
-
NYSE
Verifone Systems Inc
COMPUTER HARDWARE - Transaction Automation Systems
|
$49.89
|
-0.59
-1.17% |
$50.64
|
1,492,104
89.35% of 50 DAV
50 DAV is 1,670,000
|
$51.23
-2.62%
|
1/27/2011
|
$41.77
|
PP = $44.97
|
|
MB = $47.22
|
Most Recent Note - 3/8/2011 5:16:12 PM
G - Hit a new 52-week and all-time high today with a gain on above average volume. No resistance remains due to overhead supply, but it is extended from a sound base pattern. Recent lows and its 50 DMA line define chart support to watch in the $43 area.
>>> The latest Featured Stock Update with an annotated graph appeared on 3/2/2011. Click here.
View all notes |
Alert me of new notes |
CANSLIM.net Company Profile |
SEC |
Zacks Reports |
StockTalk |
News |
Chart |
Request a new note
C
A N
S L
I M
|
PCLN
-
NASDAQ
Priceline.Com Inc
INTERNET - Internet Software and Services
|
$468.52
|
-0.56
-0.12% |
$474.36
|
1,126,425
100.32% of 50 DAV
50 DAV is 1,122,800
|
$474.74
-1.31%
|
1/3/2011
|
$399.55
|
PP = $428.20
|
|
MB = $449.61
|
Most Recent Note - 3/7/2011 5:50:08 PM
G - Paused today after 3 consecutive gains with above average volume hitting new 52-week highs. It is extended from a sound base, and found impressive support near its 50 DMA line in recent months .
>>> The latest Featured Stock Update with an annotated graph appeared on 2/14/2011. Click here.
View all notes |
Alert me of new notes |
CANSLIM.net Company Profile |
SEC |
Zacks Reports |
StockTalk |
News |
Chart |
Request a new note
C
A N
S L
I M
|
RAX
-
NYSE
Rackspace Hosting Inc
INTERNET - Internet Software and; Services
|
$37.04
|
-0.50
-1.33% |
$37.69
|
1,136,073
62.32% of 50 DAV
50 DAV is 1,823,000
|
$40.62
-8.81%
|
1/10/2011
|
$22.84
|
PP = $32.76
|
|
MB = $34.40
|
Most Recent Note - 3/8/2011 5:04:12 PM
G - Still consolidating above prior highs near $35 previously noted as defining support to watch above its 50 DMA line.
>>> The latest Featured Stock Update with an annotated graph appeared on 2/9/2011. Click here.
View all notes |
Alert me of new notes |
CANSLIM.net Company Profile |
SEC |
Zacks Reports |
StockTalk |
News |
Chart |
Request a new note
C
A N
S L
I M
|
TIBX
-
NASDAQ
Tibco Software Inc
COMPUTER SOFTWARE and SERVICES - Business Software and Services
|
$24.37
|
-0.22
-0.87% |
$24.68
|
1,809,390
73.13% of 50 DAV
50 DAV is 2,474,300
|
$25.94
-6.05%
|
2/1/2011
|
$24.35
|
PP = $22.18
|
|
MB = $23.29
|
Most Recent Note - 3/8/2011 5:06:56 PM
G - Up today on lighter volume, finishing -5.2% off its 52-week high. Recently found support above prior highs in the $22 area and well above its 50 DMA line.
>>> The latest Featured Stock Update with an annotated graph appeared on 2/10/2011. Click here.
View all notes |
Alert me of new notes |
CANSLIM.net Company Profile |
SEC |
Zacks Reports |
StockTalk |
News |
Chart |
Request a new note
C
A N
S L
I M
|
Symbol/Exchange
Company Name
Industry Group |
PRICE |
CHANGE
(%Change) |
Day High |
Volume
(% DAV)
(% 50 day avg vol) |
52 Wk Hi
% From Hi |
Featured
Date |
Price
Featured |
Pivot Featured |
|
Max Buy |
UA
-
NYSE
Under Armour Inc Cl A
CONSUMER NON-DURABLES - Textile - Apparel Clothing
|
$68.85
|
-0.64
-0.92% |
$70.19
|
512,694
68.04% of 50 DAV
50 DAV is 753,500
|
$70.69
-2.60%
|
1/27/2011
|
$58.31
|
PP = $56.99
|
|
MB = $59.84
|
Most Recent Note - 3/8/2011 12:54:58 PM
G -Touched a new 52-week high today with its 4th consecutive gain. Prior resistance and its 50 DMA line in the $60 area define chart support to watch. Its brief consolidation has been healthy, but it needs more time to potentially form a sound base-on-base type pattern. See the latest FSU analysis for more details and a new annotated graph.
>>> The latest Featured Stock Update with an annotated graph appeared on 3/7/2011. Click here.
View all notes |
Alert me of new notes |
CANSLIM.net Company Profile |
SEC |
Zacks Reports |
StockTalk |
News |
Chart |
Request a new note
C
A N
S L
I M
|
ULTA
-
NASDAQ
Ulta Salon Cosm & Frag
SPECIALTY RETAIL - Specialty Retail, Other
|
$41.13
|
-0.74
-1.77% |
$42.28
|
704,926
147.14% of 50 DAV
50 DAV is 479,100
|
$44.06
-6.65%
|
1/6/2011
|
$36.12
|
PP = $37.34
|
|
MB = $39.21
|
Most Recent Note - 3/9/2011 4:38:02 PM
G - Down with above average volume today, a sign of mild distributional pressure while finishing -6.7% off its all-time high. Reporting earnings after the close on Thursday, March 10th. Volume and volatility often increase near earnings news. Prior highs in the $37-38 area define chart support to watch above its 50 DMA line.
>>> The latest Featured Stock Update with an annotated graph appeared on 2/17/2011. Click here.
View all notes |
Alert me of new notes |
CANSLIM.net Company Profile |
SEC |
Zacks Reports |
StockTalk |
News |
Chart |
Request a new note
C
A N
S L
I M
|
|
|
|
THESE ARE NOT BUY RECOMMENDATIONS!
Comments contained in the body of this report are technical
opinions only. The material herein has been obtained
from sources believed to be reliable and accurate, however,
its accuracy and completeness cannot be guaranteed.
This site is not an investment advisor, hence it does
not endorse or recommend any securities or other investments.
Any recommendation contained in this report may not
be suitable for all investors and it is not to be deemed
an offer or solicitation on our part with respect to
the purchase or sale of any securities. All trademarks,
service marks and trade names appearing in this report
are the property of their respective owners, and are
likewise used for identification purposes only.
This report is a service available
only to active Paid Premium Members.
You may opt-out of receiving report notifications
at any time. Questions or comments may be submitted
by writing to Premium Membership Services 665 S.E. 10 Street, Suite 201 Deerfield Beach, FL 33441-5634 or by calling 1-800-965-8307
or 954-785-1121.
|
|
|

