You are not logged in.
This means you
CAN ONLY VIEW reports that were published prior to Sunday, October 20, 2024.
You
MUST UPGRADE YOUR MEMBERSHIP if you want to see any current reports.
AFTER MARKET UPDATE - TUESDAY, MARCH 8TH, 2011
Previous After Market Report Next After Market Report >>>
|
|
|
|
DOW |
+124.35 |
12,214.38 |
+1.03% |
|
Volume |
1,003,092,970 |
-3% |
|
Volume |
1,790,289,670 |
-16% |
|
NASDAQ |
+20.14 |
2,765.77 |
+0.73% |
|
Advancers |
2,275 |
73% |
|
Advancers |
1,910 |
69% |
|
S&P 500 |
+11.69 |
1,321.82 |
+0.89% |
|
Decliners |
749 |
24% |
|
Decliners |
757 |
27% |
|
Russell 2000 |
+12.41 |
824.66 |
+1.53% |
|
52 Wk Highs |
149 |
|
|
52 Wk Highs |
95 |
|
|
S&P 600 |
+6.97 |
436.57 |
+1.62% |
|
52 Wk Lows |
10 |
|
|
52 Wk Lows |
34 |
|
|
 |
Major Averages Rise With Lighter Volume
Kenneth J. Gruneisen - Passed the CAN SLIM® Master's Exam
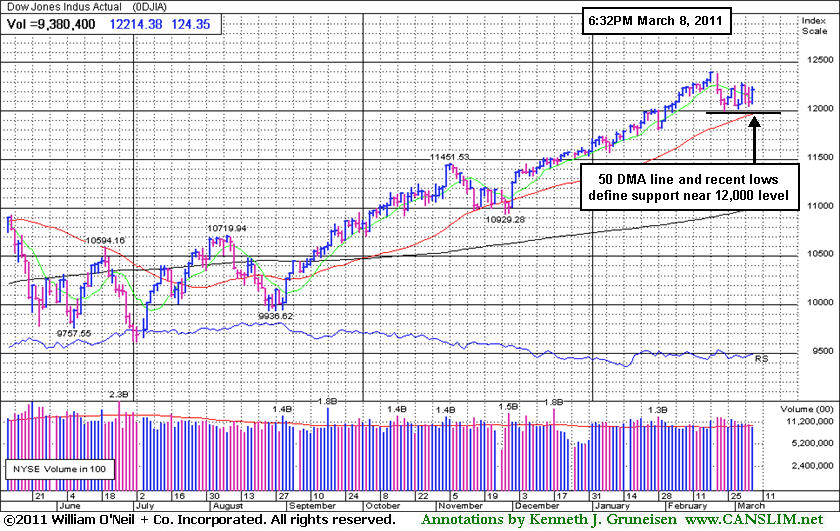
Tuesday's volume totals on the NYSE and on the Nasdaq exchange volume were reported lighter than the prior session's totals, suggesting that institutional investors were not aggressively accumulating shares. Advancing issues beat decliners by 3-1 on the NYSE and by 5-2 on the Nasdaq New 52-week highs outnumbered new 52-week lows on the NYSE and on the Nasdaq exchange. There was a total of 41 high-ranked companies from the CANSLIM.net Leaders List that made new 52-week highs and appeared on the CANSLIM.net BreakOuts Page, down from a total of 45 on the prior session. On the Featured Stocks Page there were gains from 18 of the 22 high-ranked market leaders currently listed.
Tuesday stocks were back in rally mode on signs of an improving economy. A new private survey was good news for stocks, as it said confidence among U.S. small companies rose in February to the highest level in three years as hiring and sales expectations increased.
Financial stocks led a broad advance on Wall Street. Bank of America (BAC +4.7%) led bank stocks higher after its chief executive told analysts and investors that the residential mortgage business is in "recovery mode" and the bank will avoid acquisitions in favor of returning cash to investors. PulteGroup Inc (PHM +8.4%) jumped Sales posted by the homebuilder so far this year suggest demand is stabilizing. International Business Machines Corp. (IBM +1.5%) helped lead the Dow higher the company said it expects to return $70 billion to shareholders over the next five years. Sprint Nextel Corp (S +4.9%) rose on reports the phone company may acquire T-Mobile USA. McDonald's Corp (MCD -1.0%) was one of three Dow components to trade lower. Same-store results in the U.S. for the burger chain were weaker than expected.
Oil declined for the first time in three days. Opposition leaders in Libya said they turned down an offer from the government to begin talks. Meanwhile, OPEC is considering holding a special meeting to discuss a production increase. Energy stocks sat out the rally.
A recent expansion in leadership (new highs) has been noted as a reassuring sign that the market's rally may still have some legs. However, any additional distribution days in the near term could prove more damaging and may lead to a more substantial correction for the major averages. New buying efforts should be cautiously and carefully made, only when all of the investment system's key criteria are met. As always, limit losses if ever a stock falls more than -7% from your purchase price.
PICTURED: The Dow Jones Industrial Average's 50-day moving average (DMA) line and recent lows define support near the 12,000 level.
|
 Kenneth J. Gruneisen started out as a licensed stockbroker in August 1987, a couple of months prior to the historic stock market crash that took the Dow Jones Industrial Average down -22.6% in a single day. He has published daily fact-based fundamental and technical analysis on high-ranked stocks online for two decades. Through FACTBASEDINVESTING.COM, Kenneth provides educational articles, news, market commentary, and other information regarding proven investment systems that work in good times and bad.
Comments contained in the body of this report are technical opinions only and are not necessarily those of Gruneisen Growth Corp. The material herein has been obtained from sources believed to be reliable and accurate, however, its accuracy and completeness cannot be guaranteed. Our firm, employees, and customers may effect transactions, including transactions contrary to any recommendation herein, or have positions in the securities mentioned herein or options with respect thereto. Any recommendation contained in this report may not be suitable for all investors and it is not to be deemed an offer or solicitation on our part with respect to the purchase or sale of any securities. |
|
 |
Stronger Financial Shares Underpin Indices' Gains
Kenneth J. Gruneisen - Passed the CAN SLIM® Master's Exam
Financial shares dug in their heels and rallied on Tuesday and the Broker/Dealer Index ($XBD +1.59%) and Bank Index ($BKX +2.70%) helped underpin the major averages' rally. The Healthcare Index ($HMO +1.32%) also posted a solid gain. The Retail Index ($RLX +0.21%) and tech shares had a a slightly positive bias across the board as the Semiconductor Index ($SOX +0.13%), Internet Index ($IIX +0.21%), Biotechnology Index ($BTK +0.40%), and Networking Index ($NWX +0.40%) each finished with small gains. Meanwhile, commodity-linked groups were laggards, and the Gold & Silver Index ($XAU -0.87%), Integrated Oil Index ($XOI -0.97%), and Oil Services Index ($OSX -0.62%) finished modestly lower.
Charts courtesy www.stockcharts.com
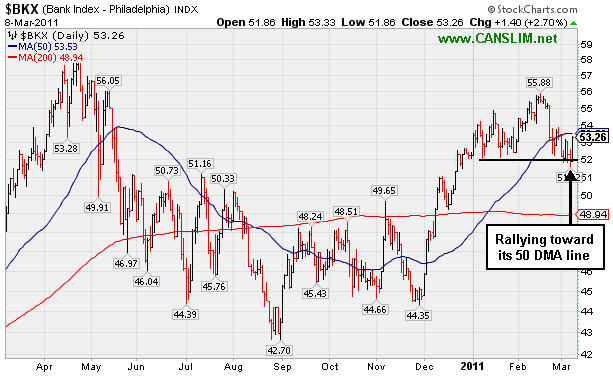
PICTURED: The Bank Index ($BKX +2.70%) rallied toward its 50-day moving average line after recently testing support near prior lows.
| Oil Services |
$OSX |
286.85 |
-1.78 |
-0.62% |
+17.02% |
| Healthcare |
$HMO |
2,071.43 |
+27.02 |
+1.32% |
+22.43% |
| Integrated Oil |
$XOI |
1,347.49 |
-13.14 |
-0.97% |
+11.07% |
| Semiconductor |
$SOX |
447.94 |
+0.59 |
+0.13% |
+8.77% |
| Networking |
$NWX |
331.56 |
+1.33 |
+0.40% |
+18.18% |
| Internet |
$IIX |
315.33 |
+0.67 |
+0.21% |
+2.47% |
| Broker/Dealer |
$XBD |
124.16 |
+1.94 |
+1.59% |
+2.18% |
| Retail |
$RLX |
506.73 |
+1.05 |
+0.21% |
-0.32% |
| Gold & Silver |
$XAU |
212.12 |
-1.86 |
-0.87% |
-6.38% |
| Bank |
$BKX |
53.26 |
+1.40 |
+2.70% |
+2.01% |
| Biotech |
$BTK |
1,291.42 |
+5.10 |
+0.40% |
-0.48% |
|
|
|
 |
Surge To New Highs Has Leader Extended From Sound Base
Kenneth J. Gruneisen - Passed the CAN SLIM® Master's Exam
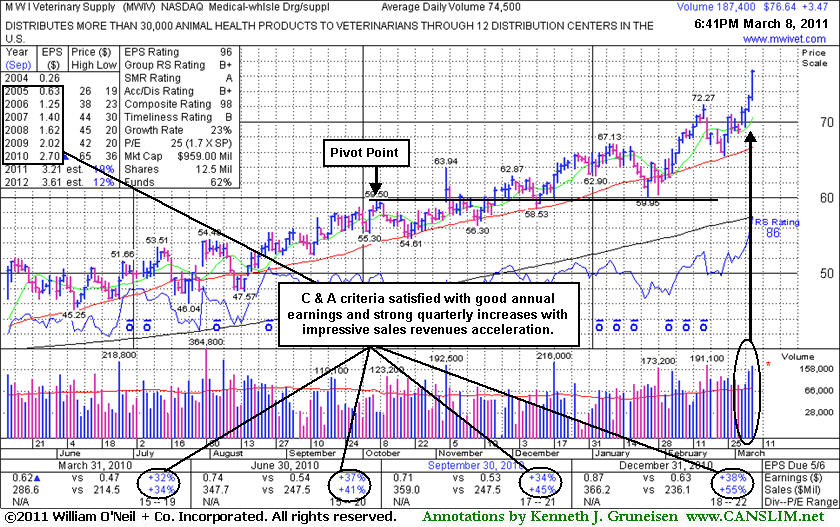
M W I Veterinary Supply (MWIV +$3.48 or +4.76% to $76.65) was up again today with above above average volume for another new all-time high. It found support near prior highs and its 50-day moving average (DMA) line recently but did not build a sound new base pattern. It could go on to produce more climactic gains, but disciplined investors avoid chasing extended stocks. Following its last appearance in this FSU section on 2/02/11 with detailed analysis and an annotated graph included under the headline, "Earnings News Due While Consolidating Near Support", it reported strong earnings news. As previously noted, sales revenues acceleration (bigger percentage increases sequentially, +34%, +41%, +45% and +55% in the Mar, Jun, Sep, and Dec '10 quarterly comparisons versus the year earlier) is a very reassuring sign. The acceleration suggests increasing demand for the company's products, which, along with the price hitting new highs, solidly satisfies the N criteria.
Its solid quarterly and annual earnings history satisfies the C and A criteria. Its small supply (S criteria) of only 12.5 million shares outstanding could contribute to greater volatility in the event of institutional buying or selling. The number of top-rated funds owning its shares rose from 255 in Mar '10 to 270 in Dec '10, a reassuring sign of support from the institutional (I criteria) crowd. From $52.05 when first featured in yellow on 7/29/10 it has now traded +47% higher. Patient investors may watch for it to eventually form a sound new base or look to accumulate shares at a secondary buy point when and if such circumstances should be noted.
 |
|
|
Color Codes Explained :
Y - Better candidates highlighted by our
staff of experts.
G - Previously featured
in past reports as yellow but may no longer be buyable under the
guidelines.
***Last / Change / Volume data in this table is the closing quote data***
Symbol/Exchange
Company Name
Industry Group |
PRICE |
CHANGE
(%Change) |
Day High |
Volume
(% DAV)
(% 50 day avg vol) |
52 Wk Hi
% From Hi |
Featured
Date |
Price
Featured |
Pivot Featured |
|
Max Buy |
BIDU
-
NASDAQ
Baidu Inc Ads
INTERNET - Internet Information Providers
|
$120.18
|
+0.00
0.00% |
$121.60
|
3,475,656
52.53% of 50 DAV
50 DAV is 6,616,400
|
$131.63
-8.70%
|
2/1/2011
|
$117.74
|
PP = $112.08
|
|
MB = $117.68
|
 Most Recent Note - 3/8/2011 4:56:02 PM
G - In recent weeks its gains have been backed by below average volume. Consolidating above its 50 DMA line and recent chart low defining important chart support to watch.
>>> The latest Featured Stock Update with an annotated graph appeared on 2/2/2011. Click here.
View all notes |
Alert me of new notes |
CANSLIM.net Company Profile |
SEC |
Zacks Reports |
StockTalk |
News |
Chart |
Request a new note
C
A N
S L
I M


|
CMG
-
NYSE
Chipotle Mexican Grill
LEISURE - Restaurants
|
$249.67
|
-2.89
-1.14% |
$252.55
|
1,014,435
96.81% of 50 DAV
50 DAV is 1,047,900
|
$275.00
-9.21%
|
2/11/2011
|
$271.15
|
PP = $262.87
|
|
MB = $276.01
|
Most Recent Note - 3/8/2011 4:59:17 PM
G - Consolidating above support at its 50 DMA line and prior highs in the $237 area. A violation and damaging loss would raise greater concerns and trigger a technical sell signal.
>>> The latest Featured Stock Update with an annotated graph appeared on 2/11/2011. Click here.
View all notes |
Alert me of new notes |
CANSLIM.net Company Profile |
SEC |
Zacks Reports |
StockTalk |
News |
Chart |
Request a new note
C
A N
S L
I M
|
CRUS
-
NASDAQ
Cirrus Logic Inc
ELECTRONICS - Semiconductor - Specialized
|
$23.11
|
-0.01
-0.04% |
$23.64
|
2,288,510
64.97% of 50 DAV
50 DAV is 3,522,500
|
$25.48
-9.30%
|
1/28/2011
|
$20.69
|
PP = $19.17
|
|
MB = $20.13
|
Most Recent Note - 3/7/2011 5:21:23 PM
G - Today it led the 30 Semiconductor Index components lower with a loss on higher volume. Recently found support above prior chart resistance. Its recent low (2/23/11 low $21.17) and much earlier high close ($20.54 on 7/26/10) define chart support to watch along with its 50 DMA line.
>>> The latest Featured Stock Update with an annotated graph appeared on 3/4/2011. Click here.
View all notes |
Alert me of new notes |
CANSLIM.net Company Profile |
SEC |
Zacks Reports |
StockTalk |
News |
Chart |
Request a new note
C
A N
S L
I M
|
CTSH
-
NASDAQ
Cognizant Tech Sol Cl A
COMPUTER SOFTWARE and SERVICES - Business Software and Services
|
$77.79
|
+1.88
2.47% |
$77.96
|
2,338,848
106.04% of 50 DAV
50 DAV is 2,205,700
|
$77.74
0.06%
|
2/7/2011
|
$75.09
|
PP = $76.46
|
|
MB = $80.28
|
Most Recent Note - 3/8/2011 4:42:10 PM
Y - Up today on average volume for a new high, rising from support at its 50 DMA line. No overhead supply remains to hinder its progress. It stalled after its 2/08/11 breakout with bare minimum volume. Subsequent confirming gains for new highs with above average volume would be a welcome reassurance of institutional accumulation.
>>> The latest Featured Stock Update with an annotated graph appeared on 2/8/2011. Click here.
View all notes |
Alert me of new notes |
CANSLIM.net Company Profile |
SEC |
Zacks Reports |
StockTalk |
News |
Chart |
Request a new note
C
A N
S L
I M
|
DECK
-
NASDAQ
Deckers Outdoor Corp
CONSUMER NON-DURABLES - Textile - Apparel Footwear
|
$87.79
|
+0.37
0.42% |
$88.35
|
847,203
52.30% of 50 DAV
50 DAV is 1,620,000
|
$94.70
-7.30%
|
2/3/2011
|
$79.61
|
PP = $82.67
|
|
MB = $86.80
|
Most Recent Note - 3/8/2011 5:01:50 PM
G - Posted 5 consecutive small gains on light or near average volume. Support to watch is at its pivot point and 50 DMA line.
>>> The latest Featured Stock Update with an annotated graph appeared on 3/3/2011. Click here.
View all notes |
Alert me of new notes |
CANSLIM.net Company Profile |
SEC |
Zacks Reports |
StockTalk |
News |
Chart |
Request a new note
C
A N
S L
I M
|
Symbol/Exchange
Company Name
Industry Group |
PRICE |
CHANGE
(%Change) |
Day High |
Volume
(% DAV)
(% 50 day avg vol) |
52 Wk Hi
% From Hi |
Featured
Date |
Price
Featured |
Pivot Featured |
|
Max Buy |
EBIX
-
NASDAQ
Ebix Inc
COMPUTER SOFTWARE and SERVICES - Business Software and Services
|
$28.57
|
-0.02
-0.07% |
$28.88
|
751,089
140.81% of 50 DAV
50 DAV is 533,400
|
$29.61
-3.51%
|
2/28/2011
|
$25.70
|
PP = $25.97
|
|
MB = $27.27
|
Most Recent Note - 3/8/2011 12:01:33 PM
G - Hovering near its 52-week high, extended beyond the "max buy" level previously noted. Prior highs in the $25-26 area define initial support to watch above its 50 DMA line.
>>> The latest Featured Stock Update with an annotated graph appeared on 2/28/2011. Click here.
View all notes |
Alert me of new notes |
CANSLIM.net Company Profile |
SEC |
Zacks Reports |
StockTalk |
News |
Chart |
Request a new note
C
A N
S L
I M
|
EZCH
-
NASDAQ
Ezchip Semiconductor Ltd
ELECTRONICS - Semiconductor - Specialized
|
$30.30
|
+0.69
2.33% |
$30.30
|
242,357
63.26% of 50 DAV
50 DAV is 383,100
|
$33.48
-9.50%
|
12/2/2010
|
$27.53
|
PP = $26.00
|
|
MB = $27.30
|
Most Recent Note - 3/8/2011 4:51:36 PM
G - Posted a gain on light volume and closed near the session high but still below its 50 DMA line which recently acted as resistance while volume totals have cooled. A convincing rebound above its short-term average would help its outlook, meanwhile it faces overhead supply up through the $33 area which may hinder its ability to rally.
>>> The latest Featured Stock Update with an annotated graph appeared on 3/1/2011. Click here.
View all notes |
Alert me of new notes |
CANSLIM.net Company Profile |
SEC |
Zacks Reports |
StockTalk |
News |
Chart |
Request a new note
C
A N
S L
I M
|
EZPW
-
NASDAQ
Ezcorp Inc Cl A
SPECIALTY RETAIL - Specialty Retail, Other
|
$29.09
|
+0.66
2.32% |
$29.33
|
471,107
127.91% of 50 DAV
50 DAV is 368,300
|
$29.94
-2.84%
|
2/18/2011
|
$27.94
|
PP = $30.04
|
|
MB = $31.54
|
Most Recent Note - 3/8/2011 4:53:38 PM
Y - Up with higher volume today, finishing -2.8% off its 52-week high. Consolidating just above its 50 DMA line showing resilience. Subsequent gains with heavy volume above its pivot point may trigger a new (or add-on) technical buy signal. Recent low ($25.56 on 1/25/11) defines an important support level now.
>>> The latest Featured Stock Update with an annotated graph appeared on 2/3/2011. Click here.
View all notes |
Alert me of new notes |
CANSLIM.net Company Profile |
SEC |
Zacks Reports |
StockTalk |
News |
Chart |
Request a new note
C
A N
S L
I M
|
FOSL
-
NASDAQ
Fossil Inc
CONSUMER DURABLES - Recreational Goods, Other
|
$83.21
|
+0.16
0.19% |
$84.19
|
1,195,409
136.32% of 50 DAV
50 DAV is 876,900
|
$83.68
-0.56%
|
2/1/2011
|
$73.30
|
PP = $74.44
|
|
MB = $78.16
|
Most Recent Note - 3/7/2011 12:25:43 PM
G - Perched -3.6% off its all-time high today, extended from its prior base. It found support at its 50 DMA line while consolidating above prior resistance in the $74 area.
>>> The latest Featured Stock Update with an annotated graph appeared on 2/24/2011. Click here.
View all notes |
Alert me of new notes |
CANSLIM.net Company Profile |
SEC |
Zacks Reports |
StockTalk |
News |
Chart |
Request a new note
C
A N
S L
I M
|
GSIT
-
NASDAQ
G S I Technology Inc
ELECTRONICS - Semiconductor - Broad Line
|
$9.02
|
+0.02
0.22% |
$9.11
|
119,463
49.39% of 50 DAV
50 DAV is 241,900
|
$10.20
-11.57%
|
2/18/2011
|
$10.08
|
PP = $10.25
|
|
MB = $10.76
|
Most Recent Note - 3/7/2011 5:19:04 PM
G - Violated and closed below its 50 DMA line today, raising concerns while slumping near prior lows in the $8.60-8.80 range that define important chart support. A rally and strong close above its 2/18/11 close ($9.78) would help its outlook following its damaging 2/22/11 gap down.
>>> The latest Featured Stock Update with an annotated graph appeared on 2/18/2011. Click here.
View all notes |
Alert me of new notes |
CANSLIM.net Company Profile |
SEC |
Zacks Reports |
StockTalk |
News |
Chart |
Request a new note
C
A N
S L
I M
|
Symbol/Exchange
Company Name
Industry Group |
PRICE |
CHANGE
(%Change) |
Day High |
Volume
(% DAV)
(% 50 day avg vol) |
52 Wk Hi
% From Hi |
Featured
Date |
Price
Featured |
Pivot Featured |
|
Max Buy |
HMSY
-
NASDAQ
H M S Holdings Corp
COMPUTER SOFTWARE and SERVICES - Healthcare Information Service
|
$80.76
|
+1.76
2.23% |
$81.20
|
166,131
102.05% of 50 DAV
50 DAV is 162,800
|
$79.99
0.96%
|
11/19/2010
|
$61.89
|
PP = $63.01
|
|
MB = $66.16
|
Most Recent Note - 3/8/2011 5:13:59 PM
G - Hit another new all-time high with a gain on light volume today adding to its spurt of gains. Getting more extended from any sound base pattern, support to watch is defined by prior chart highs and its 50 DMA line in the $67 area.
>>> The latest Featured Stock Update with an annotated graph appeared on 2/16/2011. Click here.
View all notes |
Alert me of new notes |
CANSLIM.net Company Profile |
SEC |
Zacks Reports |
StockTalk |
News |
Chart |
Request a new note
C
A N
S L
I M
|
JOBS
-
NASDAQ
Fifty One Job Inc Ads
DIVERSIFIED SERVICES - Staffing and; Outsourcing Service
|
$57.70
|
-0.02
-0.03% |
$58.38
|
104,824
81.70% of 50 DAV
50 DAV is 128,300
|
$64.55
-10.61%
|
2/7/2011
|
$59.23
|
PP = $61.38
|
|
MB = $64.45
|
Most Recent Note - 3/7/2011 5:27:54 PM
G - Loss today with higher volume was indicative of distributional pressure and its color code is changed to green. Recently churned above average volume and stalled near its pivot point noted nearly a month ago. Gains for new highs with well above average volume would be a reassuring sign of accumulation by institutional investors, meanwhile its recent low ($52.58 on 1/28/11) defines support below its 50 DMA line where violations would trigger technical sell signals.
>>> The latest Featured Stock Update with an annotated graph appeared on 2/7/2011. Click here.
View all notes |
Alert me of new notes |
CANSLIM.net Company Profile |
SEC |
Zacks Reports |
StockTalk |
News |
Chart |
Request a new note
C
A N
S L
I M
|
LULU
-
NASDAQ
Lululemon Athletica
MANUFACTURING - Textile Manufacturing
|
$75.26
|
+0.08
0.11% |
$75.94
|
1,135,039
57.76% of 50 DAV
50 DAV is 1,965,200
|
$85.28
-11.75%
|
1/26/2011
|
$68.11
|
PP = $74.70
|
|
MB = $78.44
|
Most Recent Note - 3/8/2011 5:18:29 PM
Y - Quietly consolidating near its 50 DMA line, an important support level. A close below a significant prior high close ($73.51 on 12/21/10) would completely negate its latest breakout, raising more serious concerns.
>>> The latest Featured Stock Update with an annotated graph appeared on 2/25/2011. Click here.
View all notes |
Alert me of new notes |
CANSLIM.net Company Profile |
SEC |
Zacks Reports |
StockTalk |
News |
Chart |
Request a new note
C
A N
S L
I M
|
MWIV
-
NASDAQ
M W I Veterinary Supply
HEALTH SERVICES - Medical Instruments and; Supplies
|
$76.65
|
+3.48
4.76% |
$76.82
|
195,786
262.80% of 50 DAV
50 DAV is 74,500
|
$73.50
4.29%
|
11/4/2010
|
$61.79
|
PP = $59.60
|
|
MB = $62.58
|
Most Recent Note - 3/8/2011 12:27:54 PM
G - Up again today with above above average volume for another new all-time high. Found support near prior highs and its 50 DMA line recently but did not build a sound new base pattern.
>>> The latest Featured Stock Update with an annotated graph appeared on 3/8/2011. Click here.
View all notes |
Alert me of new notes |
CANSLIM.net Company Profile |
SEC |
Zacks Reports |
StockTalk |
News |
Chart |
Request a new note
C
A N
S L
I M
|
OPEN
-
NASDAQ
Opentable Inc
INTERNET - Internet Software and Services
|
$87.25
|
+0.67
0.77% |
$88.00
|
789,723
75.18% of 50 DAV
50 DAV is 1,050,400
|
$95.97
-9.09%
|
1/5/2011
|
$74.05
|
PP = $76.79
|
|
MB = $80.63
|
Most Recent Note - 3/7/2011 10:59:27 AM
G - Consolidating above prior resistance near $82 and above its 50 DMA line. Its brief consolidation of about 4 weeks has the look of a bullish base-on-base type pattern forming, but a proper "flat base" should be a minimum of 5 weeks in length.
>>> The latest Featured Stock Update with an annotated graph appeared on 2/15/2011. Click here.
View all notes |
Alert me of new notes |
CANSLIM.net Company Profile |
SEC |
Zacks Reports |
StockTalk |
News |
Chart |
Request a new note
C
A N
S L
I M
|
Symbol/Exchange
Company Name
Industry Group |
PRICE |
CHANGE
(%Change) |
Day High |
Volume
(% DAV)
(% 50 day avg vol) |
52 Wk Hi
% From Hi |
Featured
Date |
Price
Featured |
Pivot Featured |
|
Max Buy |
ORCL
-
NASDAQ
Oracle Corp
COMPUTER SOFTWARE and SERVICES - Application Software
|
$32.75
|
+0.65
2.01% |
$33.01
|
21,891,848
93.46% of 50 DAV
50 DAV is 23,423,300
|
$33.71
-2.86%
|
1/20/2011
|
$32.31
|
PP = $32.37
|
|
MB = $33.99
|
Most Recent Note - 3/8/2011 5:15:17 PM
Y - Gain today on light volume helped it close back above its 50 DMA line again. Its prior low previously noted ($30.80 on 1/10/11) defines the next important chart support level to watch.
>>> The latest Featured Stock Update with an annotated graph appeared on 2/22/2011. Click here.
View all notes |
Alert me of new notes |
CANSLIM.net Company Profile |
SEC |
Zacks Reports |
StockTalk |
News |
Chart |
Request a new note
C
A N
S L
I M
|
PAY
-
NYSE
Verifone Systems Inc
COMPUTER HARDWARE - Transaction Automation Systems
|
$50.48
|
+1.57
3.21% |
$51.23
|
2,541,305
154.89% of 50 DAV
50 DAV is 1,640,700
|
$50.17
0.62%
|
1/27/2011
|
$41.77
|
PP = $44.97
|
|
MB = $47.22
|
Most Recent Note - 3/8/2011 5:16:12 PM
G - Hit a new 52-week and all-time high today with a gain on above average volume. No resistance remains due to overhead supply, but it is extended from a sound base pattern. Recent lows and its 50 DMA line define chart support to watch in the $43 area.
>>> The latest Featured Stock Update with an annotated graph appeared on 3/2/2011. Click here.
View all notes |
Alert me of new notes |
CANSLIM.net Company Profile |
SEC |
Zacks Reports |
StockTalk |
News |
Chart |
Request a new note
C
A N
S L
I M
|
PCLN
-
NASDAQ
Priceline.Com Inc
INTERNET - Internet Software and Services
|
$469.08
|
+2.39
0.51% |
$471.70
|
1,273,667
114.82% of 50 DAV
50 DAV is 1,109,300
|
$474.74
-1.19%
|
1/3/2011
|
$399.55
|
PP = $428.20
|
|
MB = $449.61
|
Most Recent Note - 3/7/2011 5:50:08 PM
G - Paused today after 3 consecutive gains with above average volume hitting new 52-week highs. It is extended from a sound base, and found impressive support near its 50 DMA line in recent months .
>>> The latest Featured Stock Update with an annotated graph appeared on 2/14/2011. Click here.
View all notes |
Alert me of new notes |
CANSLIM.net Company Profile |
SEC |
Zacks Reports |
StockTalk |
News |
Chart |
Request a new note
C
A N
S L
I M
|
RAX
-
NYSE
Rackspace Hosting Inc
INTERNET - Internet Software and; Services
|
$37.54
|
+0.79
2.15% |
$38.00
|
1,390,833
77.06% of 50 DAV
50 DAV is 1,804,900
|
$40.62
-7.58%
|
1/10/2011
|
$22.84
|
PP = $32.76
|
|
MB = $34.40
|
Most Recent Note - 3/8/2011 5:04:12 PM
G - Still consolidating above prior highs near $35 previously noted as defining support to watch above its 50 DMA line.
>>> The latest Featured Stock Update with an annotated graph appeared on 2/9/2011. Click here.
View all notes |
Alert me of new notes |
CANSLIM.net Company Profile |
SEC |
Zacks Reports |
StockTalk |
News |
Chart |
Request a new note
C
A N
S L
I M
|
TIBX
-
NASDAQ
Tibco Software Inc
COMPUTER SOFTWARE and SERVICES - Business Software and Services
|
$24.59
|
+0.49
2.01% |
$25.00
|
1,428,405
56.87% of 50 DAV
50 DAV is 2,511,800
|
$25.94
-5.22%
|
2/1/2011
|
$24.35
|
PP = $22.18
|
|
MB = $23.29
|
Most Recent Note - 3/8/2011 5:06:56 PM
G - Up today on lighter volume, finishing -5.2% off its 52-week high. Recently found support above prior highs in the $22 area and well above its 50 DMA line.
>>> The latest Featured Stock Update with an annotated graph appeared on 2/10/2011. Click here.
View all notes |
Alert me of new notes |
CANSLIM.net Company Profile |
SEC |
Zacks Reports |
StockTalk |
News |
Chart |
Request a new note
C
A N
S L
I M
|
Symbol/Exchange
Company Name
Industry Group |
PRICE |
CHANGE
(%Change) |
Day High |
Volume
(% DAV)
(% 50 day avg vol) |
52 Wk Hi
% From Hi |
Featured
Date |
Price
Featured |
Pivot Featured |
|
Max Buy |
UA
-
NYSE
Under Armour Inc Cl A
CONSUMER NON-DURABLES - Textile - Apparel Clothing
|
$69.49
|
+1.63
2.40% |
$70.69
|
1,146,816
155.33% of 50 DAV
50 DAV is 738,300
|
$70.43
-1.33%
|
1/27/2011
|
$58.31
|
PP = $56.99
|
|
MB = $59.84
|
Most Recent Note - 3/8/2011 12:54:58 PM
G -Touched a new 52-week high today with its 4th consecutive gain. Prior resistance and its 50 DMA line in the $60 area define chart support to watch. Its brief consolidation has been healthy, but it needs more time to potentially form a sound base-on-base type pattern. See the latest FSU analysis for more details and a new annotated graph.
>>> The latest Featured Stock Update with an annotated graph appeared on 3/7/2011. Click here.
View all notes |
Alert me of new notes |
CANSLIM.net Company Profile |
SEC |
Zacks Reports |
StockTalk |
News |
Chart |
Request a new note
C
A N
S L
I M
|
ULTA
-
NASDAQ
Ulta Salon Cosm & Frag
SPECIALTY RETAIL - Specialty Retail, Other
|
$41.87
|
+0.60
1.45% |
$42.21
|
520,136
109.32% of 50 DAV
50 DAV is 475,800
|
$44.06
-4.97%
|
1/6/2011
|
$36.12
|
PP = $37.34
|
|
MB = $39.21
|
Most Recent Note - 3/7/2011 5:40:25 PM
G - Loss on higher volume today, finishing -6.3% off its all-time high. Its Up/Down Volume Ratio of 1.7 is a sign of accumulation, but it has not built a sound new base pattern. Prior highs in the $37-38 area define chart support to watch above its 50 DMA line.
>>> The latest Featured Stock Update with an annotated graph appeared on 2/17/2011. Click here.
View all notes |
Alert me of new notes |
CANSLIM.net Company Profile |
SEC |
Zacks Reports |
StockTalk |
News |
Chart |
Request a new note
C
A N
S L
I M
|
|
|
|
THESE ARE NOT BUY RECOMMENDATIONS!
Comments contained in the body of this report are technical
opinions only. The material herein has been obtained
from sources believed to be reliable and accurate, however,
its accuracy and completeness cannot be guaranteed.
This site is not an investment advisor, hence it does
not endorse or recommend any securities or other investments.
Any recommendation contained in this report may not
be suitable for all investors and it is not to be deemed
an offer or solicitation on our part with respect to
the purchase or sale of any securities. All trademarks,
service marks and trade names appearing in this report
are the property of their respective owners, and are
likewise used for identification purposes only.
This report is a service available
only to active Paid Premium Members.
You may opt-out of receiving report notifications
at any time. Questions or comments may be submitted
by writing to Premium Membership Services 665 S.E. 10 Street, Suite 201 Deerfield Beach, FL 33441-5634 or by calling 1-800-965-8307
or 954-785-1121.
|
|
|

