You are not logged in.
This means you
CAN ONLY VIEW reports that were published prior to Friday, April 11, 2025.
You
MUST UPGRADE YOUR MEMBERSHIP if you want to see any current reports.
AFTER MARKET UPDATE - THURSDAY, MARCH 10TH, 2011
Previous After Market Report Next After Market Report >>>
|
|
|
|
DOW |
-228.48 |
11,984.61 |
-1.87% |
|
Volume |
1,151,172,090 |
+32% |
|
Volume |
2,311,607,700 |
+19% |
|
NASDAQ |
-50.70 |
2,701.02 |
-1.84% |
|
Advancers |
441 |
14% |
|
Advancers |
391 |
14% |
|
S&P 500 |
-24.91 |
1,295.11 |
-1.89% |
|
Decliners |
2,571 |
83% |
|
Decliners |
2,280 |
83% |
|
Russell 2000 |
-21.66 |
799.53 |
-2.64% |
|
52 Wk Highs |
27 |
|
|
52 Wk Highs |
33 |
|
|
S&P 600 |
-10.70 |
425.47 |
-2.45% |
|
52 Wk Lows |
31 |
|
|
52 Wk Lows |
68 |
|
|
 |
Market Dives Into Correction Prompting Investors To Raise Cash
Kenneth J. Gruneisen - Passed the CAN SLIM® Master's Exam
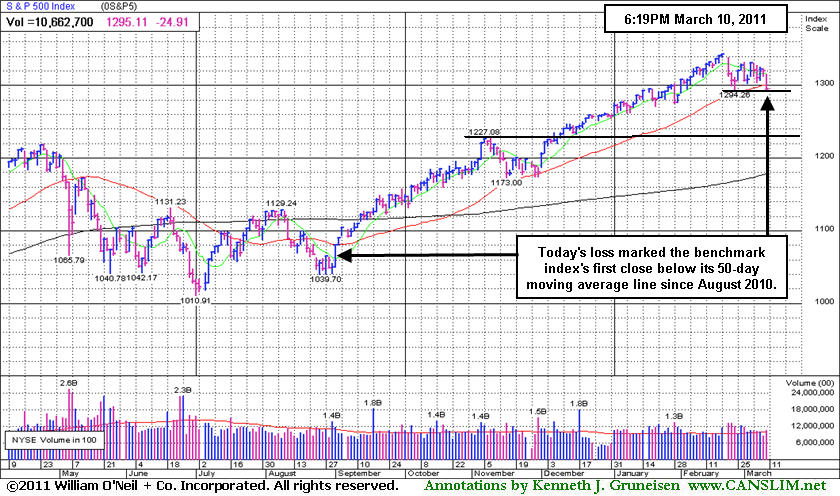
The major averages' ominous action on Thursday made it clear that stocks are back in a correction as the Dow Jones Industrial Average, S&P 500 Index, and Nasdaq Composite Index unanimously suffered damaging losses and closed below their respective 50-day moving average (DMA) lines. Volume totals were reported higher on the NYSE and on the Nasdaq exchange versus the prior session's totals, a clear sign of heavier distributional pressure or selling from the institutional crowd. Declining issues beat advancers by 5-1 on the NYSE and by 6-1 on the Nasdaq exchange. Thursday also marked the first time since November 16, 2010 that new 52-week lows outnumbered new 52-week highs on both the NYSE and on the Nasdaq exchange. Meanwhile, there were only 4 high-ranked companies from the CANSLIM.net Leaders List that made new 52-week highs and appeared on the CANSLIM.net BreakOuts Page, down considerably from a total of 45 on the prior session. On the Featured Stocks Page there were gains from 5 of the 22 high-ranked market leaders currently listed.
The major averages opened sharply lower after Moody's Investors Service cut Spain's credit rating and initial jobless claims (in the U.S.) also rose 26,000 last week, more than expected. Export growth slowed while China reported the biggest trade deficit in seven years. The January U.S. trade deficit jumped to the highest level in seven months, and the federal budget deficit jumped to a record in February. The price of oil dropped on concerns about global growth. Amid the negative sentiment, a Treasury auction of 30-year notes attracted the highest demand since 2000. Stocks were also weakened after reports that Saudi police opened fire at a rally. In Libya, protesters were forced to flee a key oil installation.
The Dow Jones Industrial Average suffered its worst decline since August as global events triggered a broad sell-off, and the Blue Chip index closed below 12,000 for the first time since January 31st. The new General Motors (GM -2.57%) sputtered to a brand new low after announcing that its chief financial officer, Chris Liddell, will leave the company April 1st to seek something more challenging to do with his life. Mr. Liddell saw GM through its record $23 billion IPO last November after the company emerged from a government-sponsored bankruptcy. Replacing him is former Morgan Stanley (MS -2.26%) banker Dan Ammann, who is now GM's finance vice president and treasurer.
Starbucks Corp (SBUX +9.9%) and Green Mountain Coffee Roasters (GMCR +41.4%) rallied as the companies announced a partnership to sell high-priced coffee products. Human Genome Sciences Inc (HGSI +13.05%) rallied after regulators approved the first new drug for lupus in 52 years.
The additional distribution has proven more damaging and it may lead to a much more substantial correction for the major averages (bad M criteria). During a correction investors should raise their cash levels and reduce stock market exposure. New buying efforts should be avoided until a new rally with a follow-through day (FTD) provides a fresh confirmation that buying demand from the institutional crowd is returning again. Even after a FTD, marked by an expansion in volume and stocks hitting new highs with higher volume, buying efforts should only be cautiously and carefully made when all of the investment system's key criteria are met.
PICTURED: The S&P 500 Index's loss marked the benchmark index's first close below its 50-day moving average line since August 2010.
|
 Kenneth J. Gruneisen started out as a licensed stockbroker in August 1987, a couple of months prior to the historic stock market crash that took the Dow Jones Industrial Average down -22.6% in a single day. He has published daily fact-based fundamental and technical analysis on high-ranked stocks online for two decades. Through FACTBASEDINVESTING.COM, Kenneth provides educational articles, news, market commentary, and other information regarding proven investment systems that work in good times and bad.
Comments contained in the body of this report are technical opinions only and are not necessarily those of Gruneisen Growth Corp. The material herein has been obtained from sources believed to be reliable and accurate, however, its accuracy and completeness cannot be guaranteed. Our firm, employees, and customers may effect transactions, including transactions contrary to any recommendation herein, or have positions in the securities mentioned herein or options with respect thereto. Any recommendation contained in this report may not be suitable for all investors and it is not to be deemed an offer or solicitation on our part with respect to the purchase or sale of any securities. |
|
 |
Commodity-Linked, Technology, and Financial Groups Fall
Kenneth J. Gruneisen - Passed the CAN SLIM® Master's Exam
Energy-related shares fell the hardest as the Oil Services Index ($OSX -4.37%) and Integrated Oil Index ($XOI -3.37%) led Thursday's decliners. The Gold & Silver Index ($XAU -2.81%) and Healthcare Index ($HMO -1.97%) also suffered big losses, failing to reward "safe-haven" investors amid a broad-based sell-off in stocks. The Networking Index ($NWX -2.71%), Semiconductor Index ($SOX -2.45%), Internet Index ($IIX -1.59%), and Biotechnology Index ($BTK -1.48%) ended unanimously lower. The Retail Index ($RLX -1.10%) and financial indexes were also negative influences as the Bank Index ($BKX -2.36%) and Broker/Dealer Index ($XBD -2.04%) suffered damaging losses yet again.
Charts courtesy www.stockcharts.com
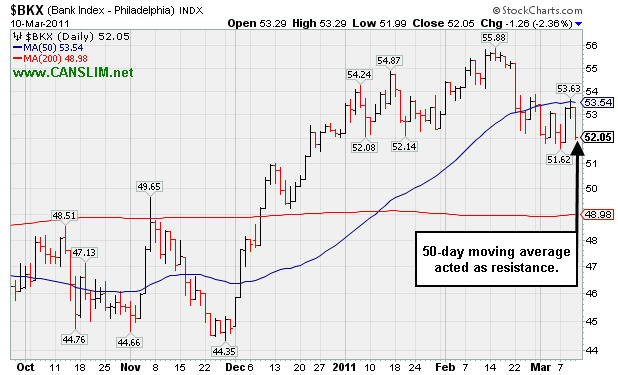
PICTURED: The Bank Index's ($BKX -2.36%) 50-day moving average (DMA) line acted as a resistance level, and it is slumping again. A rally back above the 50 DMA line by the Bank Index would be a very reassuring sign. History has shown financial shares are a reliable leading indicator, so any more damaging losses would obviously not bode well for the broader market's outlook.
| Oil Services |
$OSX |
271.41 |
-12.40 |
-4.37% |
+10.73% |
| Healthcare |
$HMO |
2,060.38 |
-41.46 |
-1.97% |
+21.77% |
| Integrated Oil |
$XOI |
1,295.84 |
-45.26 |
-3.37% |
+6.81% |
| Semiconductor |
$SOX |
423.73 |
-10.62 |
-2.45% |
+2.89% |
| Networking |
$NWX |
315.36 |
-8.79 |
-2.71% |
+12.40% |
| Internet |
$IIX |
309.00 |
-5.00 |
-1.59% |
+0.41% |
| Broker/Dealer |
$XBD |
120.85 |
-2.52 |
-2.04% |
-0.54% |
| Retail |
$RLX |
504.70 |
-5.60 |
-1.10% |
-0.72% |
| Gold & Silver |
$XAU |
202.92 |
-5.86 |
-2.81% |
-10.44% |
| Bank |
$BKX |
52.05 |
-1.26 |
-2.36% |
-0.31% |
| Biotech |
$BTK |
1,272.01 |
-19.09 |
-1.48% |
-1.97% |
|
|
|
 |
Deterioration In Stock And Broader Market Hurting Outlook
Kenneth J. Gruneisen - Passed the CAN SLIM® Master's Exam
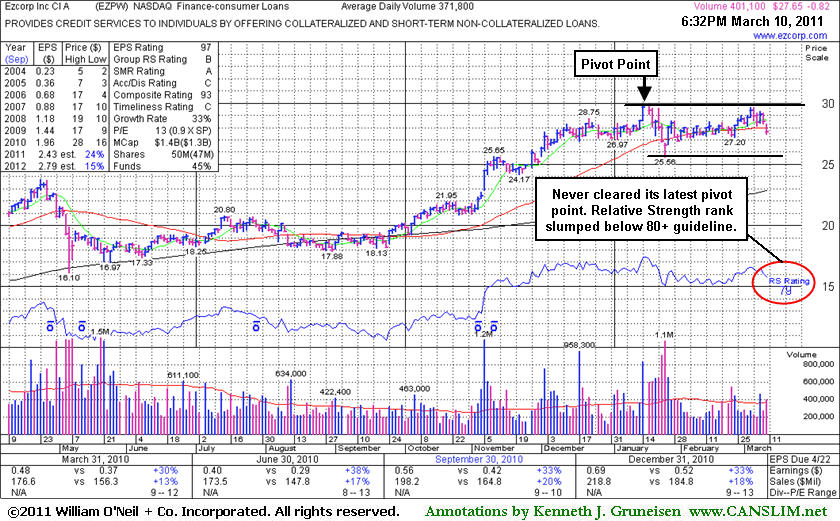
Ezcorp Inc's (EZPW -$0.81 or -2.88% to $27.65) color code was changed to green as today's loss violated its 50-day moving average (DMA) line and raised concerns. Broader market weakness (M criteria) also has raised concerns as recent distributional action essentially ended the latest rally. Patient investor might watch for a new rally and follow-through-day to provide an important reassurance of fresh institutional accumulation. Gains with heavy volume above EZPW's latest pivot point have not shown up to provide the critical proof of institutional buying demand, meanwhile the recent low ($25.56 on 1/25/11) defines an important support level to watch. It is consolidating -7.7% off its 52-week high. Subsequent gains with heavy volume above its recent highs may trigger a new (or add-on) technical buy signal. Since its last appearance in this FSU section on 2/02/11 with an annotated graph under the headline "Consolidation Following Damaging Dose Of Distributional Pressure" it has seen mostly quiet volume totals while consolidating near its 50-day moving average (DMA) line.
Earnings have remained above the +25% guideline in its quarterly comparisons versus the year ago period, satisfying the C criteria. It also has a strong annual earnings history (A criteria). The number of top-rated funds owning its shares rose from 369 in Mar '10 to 403 in Dec '10, a slightly encouraging sign with respect to the I criteria. EZPW was featured in yellow in the 11/05/10 mid-day report (read here). It had found support near its 200-day moving average (DMA) line and rebounded impressively since it was dropped from the Featured Stocks list on 5/07/10.
 |
|
|
Color Codes Explained :
Y - Better candidates highlighted by our
staff of experts.
G - Previously featured
in past reports as yellow but may no longer be buyable under the
guidelines.
***Last / Change / Volume data in this table is the closing quote data***
Symbol/Exchange
Company Name
Industry Group |
PRICE |
CHANGE
(%Change) |
Day High |
Volume
(% DAV)
(% 50 day avg vol) |
52 Wk Hi
% From Hi |
Featured
Date |
Price
Featured |
Pivot Featured |
|
Max Buy |
BIDU
-
NASDAQ
Baidu Inc Ads
INTERNET - Internet Information Providers
|
$120.87
|
+1.12
0.94% |
$121.50
|
6,269,216
95.21% of 50 DAV
50 DAV is 6,584,900
|
$131.63
-8.17%
|
2/1/2011
|
$117.74
|
PP = $112.08
|
|
MB = $117.68
|
 Most Recent Note - 3/10/2011 4:10:58 PM
G - Positive reversal today was a reassuring sign. In recent weeks its gains have been backed by below average volume. Consolidating above its 50 DMA line and recent chart low defining important chart support to watch. See latest FSU analysis for details and a new annotated graph.
>>> The latest Featured Stock Update with an annotated graph appeared on 3/9/2011. Click here.
View all notes |
Alert me of new notes |
CANSLIM.net Company Profile |
SEC |
Zacks Reports |
StockTalk |
News |
Chart |
Request a new note
C
A N
S L
I M


|
CMG
-
NYSE
Chipotle Mexican Grill
LEISURE - Restaurants
|
$253.22
|
+1.81
0.72% |
$256.27
|
1,232,673
117.58% of 50 DAV
50 DAV is 1,048,400
|
$275.00
-7.92%
|
2/11/2011
|
$271.15
|
PP = $262.87
|
|
MB = $276.01
|
Most Recent Note - 3/10/2011 4:10:03 PM
G - Positive reversal today was a reassuring sign while consolidating above support at its 50 DMA line and prior highs in the $237 area. Violations and damaging losses would raise greater concerns and trigger technical sell signals.
>>> The latest Featured Stock Update with an annotated graph appeared on 2/11/2011. Click here.
View all notes |
Alert me of new notes |
CANSLIM.net Company Profile |
SEC |
Zacks Reports |
StockTalk |
News |
Chart |
Request a new note
C
A N
S L
I M
|
CRUS
-
NASDAQ
Cirrus Logic Inc
ELECTRONICS - Semiconductor - Specialized
|
$21.25
|
+0.01
0.05% |
$21.70
|
4,471,832
123.58% of 50 DAV
50 DAV is 3,618,500
|
$25.48
-16.60%
|
1/28/2011
|
$20.69
|
PP = $19.17
|
|
MB = $20.13
|
Most Recent Note - 3/10/2011 4:08:32 PM
G - Positive reversal today was a reassuring sign of prompt support after a gap down below a recent low (2/23/11 low $21.17) and below its 50 DMA line for the first time since November. Further deterioration below a previously noted high close ($20.54 on 7/26/10) would hurt its outlook and raise more serious concerns.
>>> The latest Featured Stock Update with an annotated graph appeared on 3/4/2011. Click here.
View all notes |
Alert me of new notes |
CANSLIM.net Company Profile |
SEC |
Zacks Reports |
StockTalk |
News |
Chart |
Request a new note
C
A N
S L
I M
|
CTSH
-
NASDAQ
Cognizant Tech Sol Cl A
COMPUTER SOFTWARE and SERVICES - Business Software and Services
|
$76.11
|
-2.30
-2.93% |
$77.76
|
3,482,711
151.84% of 50 DAV
50 DAV is 2,293,600
|
$78.69
-3.28%
|
2/7/2011
|
$75.09
|
PP = $76.46
|
|
MB = $80.28
|
Most Recent Note - 3/10/2011 3:59:07 PM
Y - Down today on above average volume, erasing its prior gain and more as distributional pressure again weighs on it and the broader market. Support to watch is at its 50 DMA line.
>>> The latest Featured Stock Update with an annotated graph appeared on 2/8/2011. Click here.
View all notes |
Alert me of new notes |
CANSLIM.net Company Profile |
SEC |
Zacks Reports |
StockTalk |
News |
Chart |
Request a new note
C
A N
S L
I M
|
DECK
-
NASDAQ
Deckers Outdoor Corp
CONSUMER NON-DURABLES - Textile - Apparel Footwear
|
$83.57
|
-2.43
-2.83% |
$85.71
|
1,267,996
78.62% of 50 DAV
50 DAV is 1,612,800
|
$94.70
-11.75%
|
2/3/2011
|
$79.61
|
PP = $82.67
|
|
MB = $86.80
|
Most Recent Note - 3/10/2011 4:00:35 PM
G - Down today on light volume, slumping near support at its pivot point and 50 DMA line.
>>> The latest Featured Stock Update with an annotated graph appeared on 3/3/2011. Click here.
View all notes |
Alert me of new notes |
CANSLIM.net Company Profile |
SEC |
Zacks Reports |
StockTalk |
News |
Chart |
Request a new note
C
A N
S L
I M
|
Symbol/Exchange
Company Name
Industry Group |
PRICE |
CHANGE
(%Change) |
Day High |
Volume
(% DAV)
(% 50 day avg vol) |
52 Wk Hi
% From Hi |
Featured
Date |
Price
Featured |
Pivot Featured |
|
Max Buy |
EBIX
-
NASDAQ
Ebix Inc
COMPUTER SOFTWARE and SERVICES - Business Software and Services
|
$27.23
|
-1.64
-5.68% |
$28.59
|
1,223,284
222.66% of 50 DAV
50 DAV is 549,400
|
$29.61
-8.04%
|
2/28/2011
|
$25.70
|
PP = $25.97
|
|
MB = $27.27
|
Most Recent Note - 3/10/2011 9:48:34 AM
Y - Color code is changed to yellow, however more damaging losses in the near term may raise concerns. It gapped down today amid widespread market weakness, quickly slumping below its "max buy" level near prior highs in the $25-26 area defining initial support to watch. Its 50 DMA line defines an additional support level.
>>> The latest Featured Stock Update with an annotated graph appeared on 2/28/2011. Click here.
View all notes |
Alert me of new notes |
CANSLIM.net Company Profile |
SEC |
Zacks Reports |
StockTalk |
News |
Chart |
Request a new note
C
A N
S L
I M
|
EZCH
-
NASDAQ
Ezchip Semiconductor Ltd
ELECTRONICS - Semiconductor - Specialized
|
$28.70
|
-1.03
-3.46% |
$29.27
|
387,807
99.82% of 50 DAV
50 DAV is 388,500
|
$33.48
-14.28%
|
12/2/2010
|
$27.53
|
PP = $26.00
|
|
MB = $27.30
|
Most Recent Note - 3/10/2011 10:24:45 AM
G - Gapped down today amid widespread market weakness. Its 50 DMA line recently has acted as resistance while volume totals have cooled. A convincing rebound above its short-term average would help its outlook, meanwhile it faces overhead supply up through the $33 area which may hinder its ability to rally.
>>> The latest Featured Stock Update with an annotated graph appeared on 3/1/2011. Click here.
View all notes |
Alert me of new notes |
CANSLIM.net Company Profile |
SEC |
Zacks Reports |
StockTalk |
News |
Chart |
Request a new note
C
A N
S L
I M
|
EZPW
-
NASDAQ
Ezcorp Inc Cl A
SPECIALTY RETAIL - Specialty Retail, Other
|
$27.65
|
-0.82
-2.88% |
$28.30
|
412,553
110.96% of 50 DAV
50 DAV is 371,800
|
$29.94
-7.65%
|
2/18/2011
|
$27.94
|
PP = $30.04
|
|
MB = $31.54
|
Most Recent Note - 3/10/2011 2:49:53 PM
G - Color code is changed to green while today's loss violating its 50 DMA line raises concerns. Gains with heavy volume above its latest pivot point have not shown up to provide the critical proof of institutional buying demand, meanwhile the recent low ($25.56 on 1/25/11) defines an important support level.
>>> The latest Featured Stock Update with an annotated graph appeared on 3/10/2011. Click here.
View all notes |
Alert me of new notes |
CANSLIM.net Company Profile |
SEC |
Zacks Reports |
StockTalk |
News |
Chart |
Request a new note
C
A N
S L
I M
|
FOSL
-
NASDAQ
Fossil Inc
CONSUMER DURABLES - Recreational Goods, Other
|
$83.28
|
-1.55
-1.83% |
$85.13
|
1,010,279
111.91% of 50 DAV
50 DAV is 902,800
|
$85.20
-2.25%
|
2/1/2011
|
$73.30
|
PP = $74.44
|
|
MB = $78.16
|
Most Recent Note - 3/10/2011 4:12:01 PM
G - Paused at its all-time high today after 6 consecutive gains, extended from its prior base. It found support at its 50 DMA line while consolidating above prior resistance in the $74 area.
>>> The latest Featured Stock Update with an annotated graph appeared on 2/24/2011. Click here.
View all notes |
Alert me of new notes |
CANSLIM.net Company Profile |
SEC |
Zacks Reports |
StockTalk |
News |
Chart |
Request a new note
C
A N
S L
I M
|
GSIT
-
NASDAQ
G S I Technology Inc
ELECTRONICS - Semiconductor - Broad Line
|
$8.42
|
-0.41
-4.64% |
$8.84
|
328,687
135.26% of 50 DAV
50 DAV is 243,000
|
$10.20
-17.45%
|
2/18/2011
|
$10.08
|
PP = $10.25
|
|
MB = $10.76
|
Most Recent Note - 3/10/2011 10:30:00 AM
Down today, raising concerns while slumping further below its 50 DMA line and violating prior lows in the $8.60-8.80 range. Based on technical weakness it will be dropped from the Featured Stocks list tonight.
>>> The latest Featured Stock Update with an annotated graph appeared on 2/18/2011. Click here.
View all notes |
Alert me of new notes |
CANSLIM.net Company Profile |
SEC |
Zacks Reports |
StockTalk |
News |
Chart |
Request a new note
C
A N
S L
I M
|
Symbol/Exchange
Company Name
Industry Group |
PRICE |
CHANGE
(%Change) |
Day High |
Volume
(% DAV)
(% 50 day avg vol) |
52 Wk Hi
% From Hi |
Featured
Date |
Price
Featured |
Pivot Featured |
|
Max Buy |
HMSY
-
NASDAQ
H M S Holdings Corp
COMPUTER SOFTWARE and SERVICES - Healthcare Information Service
|
$79.54
|
-1.23
-1.52% |
$80.53
|
214,402
128.69% of 50 DAV
50 DAV is 166,600
|
$81.36
-2.24%
|
11/19/2010
|
$61.89
|
PP = $63.01
|
|
MB = $66.16
|
Most Recent Note - 3/10/2011 4:01:49 PM
G - Perched near its all-time high after a spurt of gains, extended from any sound base pattern. Support to watch is defined by prior chart highs and its 50 DMA line in the $67 area.
>>> The latest Featured Stock Update with an annotated graph appeared on 2/16/2011. Click here.
View all notes |
Alert me of new notes |
CANSLIM.net Company Profile |
SEC |
Zacks Reports |
StockTalk |
News |
Chart |
Request a new note
C
A N
S L
I M
|
JOBS
-
NASDAQ
Fifty One Job Inc Ads
DIVERSIFIED SERVICES - Staffing and; Outsourcing Service
|
$56.51
|
-1.01
-1.76% |
$56.95
|
147,563
113.95% of 50 DAV
50 DAV is 129,500
|
$64.55
-12.46%
|
2/7/2011
|
$59.23
|
PP = $61.38
|
|
MB = $64.45
|
Most Recent Note - 3/10/2011 4:13:56 PM
G - Loss today with average volume was its 8th loss in 9 sessions, and after action indicative of distributional pressure its color code was changed to green. Recently churned above average volume and stalled near its pivot point noted nearly a month ago. Gains for new highs with well above average volume would be a reassuring sign of accumulation by institutional investors, meanwhile its recent low ($52.58 on 1/28/11) defines support below its 50 DMA line where violations would trigger technical sell signals.
>>> The latest Featured Stock Update with an annotated graph appeared on 2/7/2011. Click here.
View all notes |
Alert me of new notes |
CANSLIM.net Company Profile |
SEC |
Zacks Reports |
StockTalk |
News |
Chart |
Request a new note
C
A N
S L
I M
|
LULU
-
NASDAQ
Lululemon Athletica
MANUFACTURING - Textile Manufacturing
|
$74.72
|
-1.33
-1.75% |
$75.49
|
1,526,230
77.09% of 50 DAV
50 DAV is 1,979,800
|
$85.28
-12.38%
|
1/26/2011
|
$68.11
|
PP = $74.70
|
|
MB = $78.44
|
Most Recent Note - 3/10/2011 10:15:31 AM
Y - Small gap down today, trading below its 50 DMA line for the first time since September. A prompt show of support near that important short-term average would be a reassuring sign, but as previously noted - "A close below a significant prior high close ($73.51 on 12/21/10) would completely negate its latest breakout, raising more serious concerns."
>>> The latest Featured Stock Update with an annotated graph appeared on 2/25/2011. Click here.
View all notes |
Alert me of new notes |
CANSLIM.net Company Profile |
SEC |
Zacks Reports |
StockTalk |
News |
Chart |
Request a new note
C
A N
S L
I M
|
MWIV
-
NASDAQ
M W I Veterinary Supply
HEALTH SERVICES - Medical Instruments and; Supplies
|
$76.99
|
-1.03
-1.32% |
$77.60
|
136,927
169.67% of 50 DAV
50 DAV is 80,700
|
$78.48
-1.90%
|
11/4/2010
|
$61.79
|
PP = $59.60
|
|
MB = $62.58
|
Most Recent Note - 3/10/2011 12:19:44 PM
G - Perched near its all-time high following a streak of gains with above average volume. Found support near prior highs and its 50 DMA line recently but did not build a sound new base pattern. See the latest FSU analysis for more details and a new annotated graph.
>>> The latest Featured Stock Update with an annotated graph appeared on 3/8/2011. Click here.
View all notes |
Alert me of new notes |
CANSLIM.net Company Profile |
SEC |
Zacks Reports |
StockTalk |
News |
Chart |
Request a new note
C
A N
S L
I M
|
OPEN
-
NASDAQ
Opentable Inc
INTERNET - Internet Software and Services
|
$88.94
|
+1.44
1.65% |
$89.02
|
1,173,035
110.29% of 50 DAV
50 DAV is 1,063,600
|
$95.97
-7.33%
|
1/5/2011
|
$74.05
|
PP = $76.79
|
|
MB = $80.63
|
Most Recent Note - 3/10/2011 4:16:28 PM
G - Positive reversal for a gain, finishing near the session high after a small gap down today. Consolidating above prior resistance near $82 and above its 50 DMA line. Its brief consolidation of about 4 weeks has the look of a bullish base-on-base type pattern forming, but a proper "flat base" should be a minimum of 5 weeks in length.
>>> The latest Featured Stock Update with an annotated graph appeared on 2/15/2011. Click here.
View all notes |
Alert me of new notes |
CANSLIM.net Company Profile |
SEC |
Zacks Reports |
StockTalk |
News |
Chart |
Request a new note
C
A N
S L
I M
|
Symbol/Exchange
Company Name
Industry Group |
PRICE |
CHANGE
(%Change) |
Day High |
Volume
(% DAV)
(% 50 day avg vol) |
52 Wk Hi
% From Hi |
Featured
Date |
Price
Featured |
Pivot Featured |
|
Max Buy |
ORCL
-
NASDAQ
Oracle Corp
COMPUTER SOFTWARE and SERVICES - Application Software
|
$31.80
|
-0.99
-3.02% |
$32.46
|
29,065,781
122.81% of 50 DAV
50 DAV is 23,668,100
|
$33.71
-5.67%
|
1/20/2011
|
$32.31
|
PP = $32.37
|
|
MB = $33.99
|
Most Recent Note - 3/10/2011 10:33:58 AM
Y - Gapped down today amid widespread market weakness, slumping below its 50 DMA line again. Its Relative Strength rank has also slumped below the 80+ guideline normally required of buy candidates. Prior low previously noted ($30.80 on 1/10/11) defines the next important chart support level to watch.
>>> The latest Featured Stock Update with an annotated graph appeared on 2/22/2011. Click here.
View all notes |
Alert me of new notes |
CANSLIM.net Company Profile |
SEC |
Zacks Reports |
StockTalk |
News |
Chart |
Request a new note
C
A N
S L
I M
|
PAY
-
NYSE
Verifone Systems Inc
COMPUTER HARDWARE - Transaction Automation Systems
|
$48.56
|
-1.33
-2.67% |
$49.30
|
1,726,892
102.10% of 50 DAV
50 DAV is 1,691,300
|
$51.23
-5.21%
|
1/27/2011
|
$41.77
|
PP = $44.97
|
|
MB = $47.22
|
Most Recent Note - 3/10/2011 10:04:05 AM
G - Gapped down today, pulling back from new 52-week and all-time highs hit this week with a volume-driven gain. No resistance remains due to overhead supply, but it is extended from a sound base pattern. Its 50 DMA line defines chart support to watch.
>>> The latest Featured Stock Update with an annotated graph appeared on 3/2/2011. Click here.
View all notes |
Alert me of new notes |
CANSLIM.net Company Profile |
SEC |
Zacks Reports |
StockTalk |
News |
Chart |
Request a new note
C
A N
S L
I M
|
PCLN
-
NASDAQ
Priceline.Com Inc
INTERNET - Internet Software and Services
|
$464.41
|
-4.11
-0.88% |
$468.69
|
1,325,851
116.99% of 50 DAV
50 DAV is 1,133,300
|
$474.74
-2.18%
|
1/3/2011
|
$399.55
|
PP = $428.20
|
|
MB = $449.61
|
Most Recent Note - 3/10/2011 10:06:01 AM
G - Hovering near its 52-week high, extended from a sound base. Found impressive support near its 50 DMA line in recent months.
>>> The latest Featured Stock Update with an annotated graph appeared on 2/14/2011. Click here.
View all notes |
Alert me of new notes |
CANSLIM.net Company Profile |
SEC |
Zacks Reports |
StockTalk |
News |
Chart |
Request a new note
C
A N
S L
I M
|
RAX
-
NYSE
Rackspace Hosting Inc
INTERNET - Internet Software and; Services
|
$36.77
|
-0.27
-0.73% |
$37.22
|
1,337,839
73.05% of 50 DAV
50 DAV is 1,831,300
|
$40.62
-9.48%
|
1/10/2011
|
$22.84
|
PP = $32.76
|
|
MB = $34.40
|
Most Recent Note - 3/10/2011 10:08:42 AM
G - Gapped down today amid widespread market weakness. Consolidating above prior highs near $35 and its 50 DMA line defining chart support to watch.
>>> The latest Featured Stock Update with an annotated graph appeared on 2/9/2011. Click here.
View all notes |
Alert me of new notes |
CANSLIM.net Company Profile |
SEC |
Zacks Reports |
StockTalk |
News |
Chart |
Request a new note
C
A N
S L
I M
|
TIBX
-
NASDAQ
Tibco Software Inc
COMPUTER SOFTWARE and SERVICES - Business Software and Services
|
$23.92
|
-0.45
-1.85% |
$24.29
|
2,357,747
96.12% of 50 DAV
50 DAV is 2,452,900
|
$25.94
-7.79%
|
2/1/2011
|
$24.35
|
PP = $22.18
|
|
MB = $23.29
|
Most Recent Note - 3/10/2011 4:02:40 PM
G - Down today on average volume, finishing -7.8% off its 52-week high. Recently found support above prior highs in the $22 area and well above its 50 DMA line.
>>> The latest Featured Stock Update with an annotated graph appeared on 2/10/2011. Click here.
View all notes |
Alert me of new notes |
CANSLIM.net Company Profile |
SEC |
Zacks Reports |
StockTalk |
News |
Chart |
Request a new note
C
A N
S L
I M
|
Symbol/Exchange
Company Name
Industry Group |
PRICE |
CHANGE
(%Change) |
Day High |
Volume
(% DAV)
(% 50 day avg vol) |
52 Wk Hi
% From Hi |
Featured
Date |
Price
Featured |
Pivot Featured |
|
Max Buy |
UA
-
NYSE
Under Armour Inc Cl A
CONSUMER NON-DURABLES - Textile - Apparel Clothing
|
$67.69
|
-1.16
-1.68% |
$68.72
|
530,266
69.92% of 50 DAV
50 DAV is 758,400
|
$70.69
-4.24%
|
1/27/2011
|
$58.31
|
PP = $56.99
|
|
MB = $59.84
|
Most Recent Note - 3/10/2011 10:21:11 AM
G -Touched a new 52-week high this week then stalled, and there was a small gap down today amid widespread weakness. Prior resistance and its 50 DMA line in the $60 area define chart support to watch. Its brief consolidation has been healthy, but it needs more time to potentially form a sound base-on-base type pattern. See the latest FSU analysis for more details and a new annotated graph.
>>> The latest Featured Stock Update with an annotated graph appeared on 3/7/2011. Click here.
View all notes |
Alert me of new notes |
CANSLIM.net Company Profile |
SEC |
Zacks Reports |
StockTalk |
News |
Chart |
Request a new note
C
A N
S L
I M
|
ULTA
-
NASDAQ
Ulta Salon Cosm & Frag
SPECIALTY RETAIL - Specialty Retail, Other
|
$42.11
|
+0.98
2.38% |
$42.57
|
1,209,948
248.35% of 50 DAV
50 DAV is 487,200
|
$44.06
-4.43%
|
1/6/2011
|
$36.12
|
PP = $37.34
|
|
MB = $39.21
|
Most Recent Note - 3/10/2011 4:05:16 PM
G - Reporting earnings after the close today, it was up with more than 2 times average volume, finishing near the session high and just -4.0% off its all-time high. Volume and volatility often increase near earnings news. Prior highs in the $37-38 area define chart support to watch above its 50 DMA line.
>>> The latest Featured Stock Update with an annotated graph appeared on 2/17/2011. Click here.
View all notes |
Alert me of new notes |
CANSLIM.net Company Profile |
SEC |
Zacks Reports |
StockTalk |
News |
Chart |
Request a new note
C
A N
S L
I M
|
|
|
|
THESE ARE NOT BUY RECOMMENDATIONS!
Comments contained in the body of this report are technical
opinions only. The material herein has been obtained
from sources believed to be reliable and accurate, however,
its accuracy and completeness cannot be guaranteed.
This site is not an investment advisor, hence it does
not endorse or recommend any securities or other investments.
Any recommendation contained in this report may not
be suitable for all investors and it is not to be deemed
an offer or solicitation on our part with respect to
the purchase or sale of any securities. All trademarks,
service marks and trade names appearing in this report
are the property of their respective owners, and are
likewise used for identification purposes only.
This report is a service available
only to active Paid Premium Members.
You may opt-out of receiving report notifications
at any time. Questions or comments may be submitted
by writing to Premium Membership Services 665 S.E. 10 Street, Suite 201 Deerfield Beach, FL 33441-5634 or by calling 1-800-965-8307
or 954-785-1121.
|
|
|

