You are not logged in.
This means you
CAN ONLY VIEW reports that were published prior to Wednesday, April 9, 2025.
You
MUST UPGRADE YOUR MEMBERSHIP if you want to see any current reports.
AFTER MARKET UPDATE - FRIDAY, FEBRUARY 25TH, 2022
Previous After Market Report Next After Market Report >>>
|
|
|
|
DOW |
+834.92 |
34,058.75 |
+2.51% |
|
Volume |
1,115,361,249 |
-24% |
|
Volume |
4,617,416,200 |
-24% |
|
NASDAQ |
+221.04 |
13,694.62 |
+1.64% |
|
Advancers |
2,528 |
82% |
|
Advancers |
3,125 |
71% |
|
S&P 500 |
+95.95 |
4,384.65 |
+2.24% |
|
Decliners |
561 |
18% |
|
Decliners |
1,264 |
29% |
|
Russell 2000 |
+44.92 |
2,040.93 |
+2.25% |
|
52 Wk Highs |
44 |
|
|
52 Wk Highs |
47 |
|
|
S&P 600 |
+28.64 |
1,310.76 |
+2.23% |
|
52 Wk Lows |
73 |
|
|
52 Wk Lows |
135 |
|
|
 |
Major Averages Rose With Lighter Volume Totals
Kenneth J. Gruneisen - Passed the CAN SLIM® Master's Exam
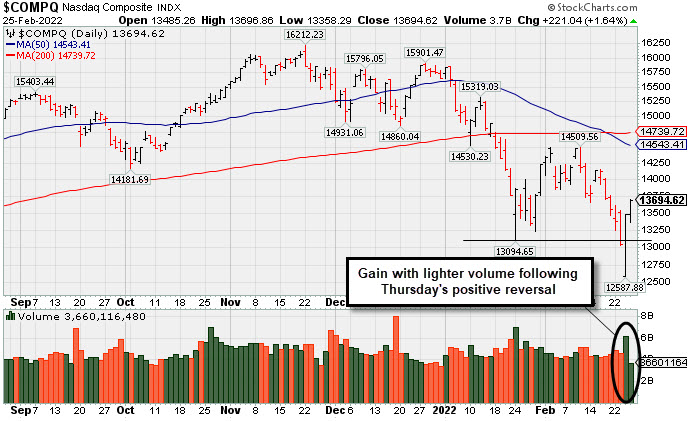
The Dow gained 834 points, notching its best session since November 2020 and ending little changed on the week (-0.1%). The S&P 500 surged 2.2%, while the Nasdaq Composite jumped 1.6%, with both benchmarks snapping two-week losing streaks (+0.8% and +1.1%, respectively). Volume totals reported were lighter than the prior session on the NYSE and on the Nasdaq exchange, revealing lackluster buying demand from the institutional crowd. Breadth was positive as advancers led decliners by almost a 5-1 margin on the NYSE and 5-2 on the Nasdaq exchange. There were 19 high-ranked companies from the Leaders List that hit new 52-week highs and were listed on the BreakOuts Page, versus 4 on the prior session. New 52-week lows totals contracted abruptly yet still outnumbered new 52-week highs totals on the NYSE and on the Nasdaq exchange. The major indices all rose further following noted "positive reversals" on Thursday after plunging to new 2022 lows. The market averages (M criteria) are in a "correction" and disciplined investors are reminded to reduce exposure and raise cash.
 PICTURED: The S&P 500 Index managed a "positive reversal" on Thursday after violating its January low and slumping well below Its 200-day moving average (DMA) line.
U.S. stocks finished firmly higher in a broad-based relief rally Friday as investors continued to monitor the escalating geopolitical conflict in Eastern Europe. Russian troops were reportedly closing in on Ukraine’s capital, Kyiv, though President Putin indicated a willingness to potentially negotiate with Ukraine despite urging their military to mutiny. The U.S. joined its allies in issuing personal sanctions on President Putin. Oversold conditions and technical dynamics were also cited as factors contributing to the reprieve in the equity sell-off.
Furthermore, U.S. sanctions have thus far not directly targeted Russia’s energy industry. West Texas Intermediate crude eased 0.5% to $92.32/barrel after briefly topping $100/barrel yesterday. Treasuries edged lower as recent Federal Reserve (Fed) commentary suggested that the crisis in Ukraine was unlikely to derail the central bank’s plans for monetary policy tightening. The yield on the 10-year note rose one basis point (0.01%) to 1.97%. The core PCE deflator (the Fed’s preferred proxy for inflation) climbed 5.2% year-over-year in January, in-line with expectations but still the biggest increase since 1983. Meanwhile, a release revealed personal spending rose a stronger-than-expected 2.1% in January.
All 11 S&P 500 sectors closed in positive territory, with Materials pacing gains. In earnings, Block Inc. (SQ +26.14%), formerly named Square, rose on upbeat forward guidance. Elsewhere, ETSY Inc. (ETSY +16.21%) on the heels of a top and bottom line beat. |
 Kenneth J. Gruneisen started out as a licensed stockbroker in August 1987, a couple of months prior to the historic stock market crash that took the Dow Jones Industrial Average down -22.6% in a single day. He has published daily fact-based fundamental and technical analysis on high-ranked stocks online for two decades. Through FACTBASEDINVESTING.COM, Kenneth provides educational articles, news, market commentary, and other information regarding proven investment systems that work in good times and bad.
Comments contained in the body of this report are technical opinions only and are not necessarily those of Gruneisen Growth Corp. The material herein has been obtained from sources believed to be reliable and accurate, however, its accuracy and completeness cannot be guaranteed. Our firm, employees, and customers may effect transactions, including transactions contrary to any recommendation herein, or have positions in the securities mentioned herein or options with respect thereto. Any recommendation contained in this report may not be suitable for all investors and it is not to be deemed an offer or solicitation on our part with respect to the purchase or sale of any securities. |
|
 |
Retail, Financial, Tech, and Commodity-Linked Groups Rose
Kenneth J. Gruneisen - Passed the CAN SLIM® Master's Exam
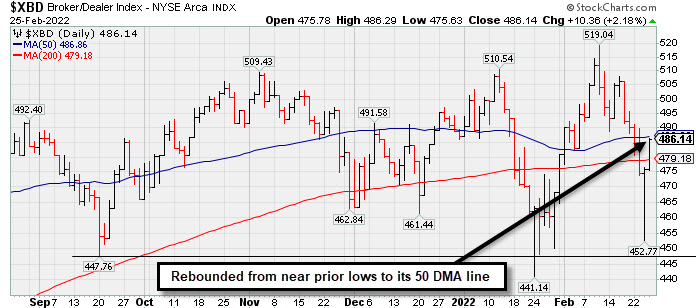
The Bank Index ($BKX +4.00%), Broker/Dealer Index ($XBD +2.18%), and Retail Index ($RLX +2.02%) posted influential gains. The Semiconductor Index ($SOX +1.57%), Networking Index ($NWX +1.81%), and Biotech Index ($BTK +0.94%) each posted gains. Commodity-linked groups also had a positive bias as the Oil Services Index ($OSX +1.87%), Integrated Oil Index ($XOI +2.27%), and the Gold & Silver Index ($XAU +1.77%) rose. PICTURED: The Broker/Dealer Index ($XBD +2.18%) rebounded near its 50 DMA line following Thursday's "positive reversal".
| Oil Services |
$OSX |
67.57 |
+1.24 |
+1.87% |
+28.17% |
| Integrated Oil |
$XOI |
1,435.77 |
+31.91 |
+2.27% |
+21.86% |
| Semiconductor |
$SOX |
3,452.67 |
+53.52 |
+1.57% |
-12.51% |
| Networking |
$NWX |
878.14 |
+15.63 |
+1.81% |
-9.57% |
| Broker/Dealer |
$XBD |
486.14 |
+10.36 |
+2.18% |
-0.15% |
| Retail |
$RLX |
3,705.76 |
+73.45 |
+2.02% |
-12.32% |
| Gold & Silver |
$XAU |
142.94 |
+2.48 |
+1.77% |
+7.92% |
| Bank |
$BKX |
135.94 |
+5.23 |
+4.00% |
+2.82% |
| Biotech |
$BTK |
4,979.55 |
+46.51 |
+0.94% |
-9.77% |
|
|
|
 |
|
|
|
Color Codes Explained :
Y - Better candidates highlighted by our
staff of experts.
G - Previously featured
in past reports as yellow but may no longer be buyable under the
guidelines.
***Last / Change / Volume data in this table is the closing quote data***
|
|
|
THESE ARE NOT BUY RECOMMENDATIONS!
Comments contained in the body of this report are technical
opinions only. The material herein has been obtained
from sources believed to be reliable and accurate, however,
its accuracy and completeness cannot be guaranteed.
This site is not an investment advisor, hence it does
not endorse or recommend any securities or other investments.
Any recommendation contained in this report may not
be suitable for all investors and it is not to be deemed
an offer or solicitation on our part with respect to
the purchase or sale of any securities. All trademarks,
service marks and trade names appearing in this report
are the property of their respective owners, and are
likewise used for identification purposes only.
This report is a service available
only to active Paid Premium Members.
You may opt-out of receiving report notifications
at any time. Questions or comments may be submitted
by writing to Premium Membership Services 665 S.E. 10 Street, Suite 201 Deerfield Beach, FL 33441-5634 or by calling 1-800-965-8307
or 954-785-1121.
|
|
|