***Last / Change / Volume data in this table is the closing quote data***
Symbol/Exchange
Company Name
Industry Group |
PRICE |
CHANGE
(%Change) |
Day High |
Volume
(% DAV)
(% 50 day avg vol) |
52 Wk Hi
% From Hi |
Featured
Date |
Price
Featured |
Pivot Featured |
|
Max Buy |
ADS
-
NYSE
Alliance Data Sys Corp
COMPUTER SOFTWARE and SERVICES - Information and Delivery Service
|
$120.23
|
+0.26
0.22% |
$121.21
|
365,578
51.77% of 50 DAV
50 DAV is 706,200
|
$122.62
-1.95%
|
1/17/2012
|
$108.24
|
PP = $107.43
|
|
MB = $112.80
|
Most Recent Note - 2/16/2012 11:18:48 AM
G - Pulling back today after a streak of 6 consecutive gains into new high territory. Its 50 DMA line defines support to watch on pullbacks while it is now extended from its latest base.
>>> The latest Featured Stock Update with an annotated graph appeared on 1/17/2012. Click here.
View all notes |
Alert me of new notes |
CANSLIM.net Company Profile |
SEC |
Zacks Reports |
StockTalk |
News |
Chart |
Request a new note
C
A N
S L
I M


|
ALXN
-
NASDAQ
Alexion Pharmaceuticals
DRUGS - Drug Manufacturers - Other
|
$83.46
|
+1.65
2.02% |
$83.94
|
1,700,546
140.63% of 50 DAV
50 DAV is 1,209,200
|
$85.48
-2.36%
|
11/30/2011
|
$68.66
|
PP = $70.52
|
|
MB = $74.05
|
 Most Recent Note - 2/22/2012 4:14:45 PM
G - Up today with above average volume. After volume-driven gains for new all-time highs it is extended from its prior base. Support to watch is its 50 DMA line.
>>> The latest Featured Stock Update with an annotated graph appeared on 1/13/2012. Click here.
View all notes |
Alert me of new notes |
CANSLIM.net Company Profile |
SEC |
Zacks Reports |
StockTalk |
News |
Chart |
Request a new note
C
A N
S L
I M
|
BODY
-
NASDAQ
Body Central Corp
RETAIL - Catalog andamp; Mail Order Houses
|
$28.12
|
+0.40
1.44% |
$28.23
|
61,801
36.20% of 50 DAV
50 DAV is 170,700
|
$28.93
-2.80%
|
1/27/2012
|
$26.69
|
PP = $25.46
|
|
MB = $26.73
|
Most Recent Note - 2/22/2012 4:19:14 PM
G - Up today with light volume, extended from its prior base. Prior highs in the $25-26 area recently acted as support after encountering some distributional pressure.
>>> The latest Featured Stock Update with an annotated graph appeared on 1/27/2012. Click here.
View all notes |
Alert me of new notes |
CANSLIM.net Company Profile |
SEC |
Zacks Reports |
StockTalk |
News |
Chart |
Request a new note
C
A N
S L
I M
|
CATM
-
NASDAQ
Cardtronics Inc
DIVERSIFIED SERVICES - Business/Management Services
|
$27.20
|
+0.33
1.23% |
$27.38
|
185,913
45.18% of 50 DAV
50 DAV is 411,500
|
$28.74
-5.36%
|
12/23/2011
|
$28.64
|
PP = $28.56
|
|
MB = $29.99
|
Most Recent Note - 2/21/2012 1:48:29 PM
G - Still consolidating near its 50 DMA line since finding prompt support at its 200 DMA line. Its waning Relative Strength Rank (81) has slumped near the minimum 80+ guideline for buy candidates.
>>> The latest Featured Stock Update with an annotated graph appeared on 1/30/2012. Click here.
View all notes |
Alert me of new notes |
CANSLIM.net Company Profile |
SEC |
Zacks Reports |
StockTalk |
News |
Chart |
Request a new note
C
A N
S L
I M
|
CDNS
-
NASDAQ
Cadence Design Systems
COMPUTER SOFTWARE and SERVICES - Technical and System Software
|
$11.80
|
-0.18
-1.50% |
$12.09
|
4,029,384
135.43% of 50 DAV
50 DAV is 2,975,300
|
$12.11
-2.56%
|
2/3/2012
|
$11.66
|
PP = $11.15
|
|
MB = $11.71
|
Most Recent Note - 2/21/2012 1:50:48 PM
G - Wedging to new 52-week highs with small gains above its "max buy" level. Recently making limited progress while no resistance remains due to overhead supply following strong technical action.
>>> The latest Featured Stock Update with an annotated graph appeared on 2/3/2012. Click here.
View all notes |
Alert me of new notes |
CANSLIM.net Company Profile |
SEC |
Zacks Reports |
StockTalk |
News |
Chart |
Request a new note
C
A N
S L
I M
|
Symbol/Exchange
Company Name
Industry Group |
PRICE |
CHANGE
(%Change) |
Day High |
Volume
(% DAV)
(% 50 day avg vol) |
52 Wk Hi
% From Hi |
Featured
Date |
Price
Featured |
Pivot Featured |
|
Max Buy |
CELG
-
NASDAQ
Celgene Corp
DRUGS - Drug Manufacturers - Major
|
$74.64
|
+0.61
0.82% |
$74.79
|
2,425,094
71.52% of 50 DAV
50 DAV is 3,390,700
|
$76.09
-1.91%
|
2/2/2012
|
$74.16
|
PP = $75.21
|
|
MB = $78.97
|
Most Recent Note - 2/21/2012 1:52:48 PM
Y - Stalled and slumped below the pivot point after recently rising from an advanced "3-weeks tight" base pattern previously noted. Still perched within close striking distance of its all-time high ($77.39 in Aug '08). Its 50 DMA line defines initial support above its prior highs in the $68 area.
>>> The latest Featured Stock Update with an annotated graph appeared on 2/2/2012. Click here.
View all notes |
Alert me of new notes |
CANSLIM.net Company Profile |
SEC |
Zacks Reports |
StockTalk |
News |
Chart |
Request a new note
C
A N
S L
I M
|
ECHO
-
NASDAQ
Echo Global Logistics
DIVERSIFIED SERVICES - Business/Management Services
|
$18.50
|
-0.16
-0.86% |
$18.74
|
79,436
127.51% of 50 DAV
50 DAV is 62,300
|
$19.38
-4.54%
|
2/22/2012
|
$18.50
|
PP = $18.63
|
|
MB = $19.56
|
Most Recent Note - 2/22/2012 12:30:15 PM
Y - Holding its ground near its all-time high today after volume-driven gains last week into new high territory. Leadership (L criteria) from at least one other high-ranked firm in the Transportation - Logistics group is reassuring although the group has a weak (D+) Relative Strength Rating. Color code is changed to yellow with pivot point cited based on its 7/06/11 high plus 10 cents. Technically it broke out from a 32-week cup shaped base pattern already and may be forming a high handle. Its quarterly and annual earnings increases have been strong, satisfying the C and A criteria. Ownership by top-rated funds rose from 86 in Dec '10 to 130 in Dec '11, a reassuring sign concerning the I criteria.
There are no Featured Stock Updates™ available for this stock at this time. You may request one by clicking the Request a New Note link below
View all notes |
Alert me of new notes |
CANSLIM.net Company Profile |
SEC |
Zacks Reports |
StockTalk |
News |
Chart |
Request a new note
C
A N
S L
I M
|
FEIC
-
NASDAQ
F E I Co
ELECTRONICS - Diversified Electronics
|
$44.24
|
+0.52
1.19% |
$44.65
|
314,358
113.28% of 50 DAV
50 DAV is 277,500
|
$48.31
-8.42%
|
12/7/2011
|
$41.41
|
PP = $42.35
|
|
MB = $44.47
|
Most Recent Note - 2/16/2012 5:30:14 PM
G - Consolidating above its 50 DMA line and prior highs in the $43 area defining important chart support. Reported earnings +21% on +14% sales revenues for the latest quarter ended December 31, 2011 versus the year ago period (below the +25% minimum guideline for earnings growth).
>>> The latest Featured Stock Update with an annotated graph appeared on 1/25/2012. Click here.
View all notes |
Alert me of new notes |
CANSLIM.net Company Profile |
SEC |
Zacks Reports |
StockTalk |
News |
Chart |
Request a new note
C
A N
S L
I M
|
GNC
-
NYSE
G N C Holdings Inc
RETAIL - Drug Stores
|
$32.55
|
-0.20
-0.61% |
$32.99
|
756,726
70.85% of 50 DAV
50 DAV is 1,068,100
|
$33.70
-3.41%
|
1/19/2012
|
$28.99
|
PP = $29.60
|
|
MB = $31.08
|
Most Recent Note - 2/21/2012 1:36:13 PM
G - Reported earnings +106% on +17% sales revenues for the quarter ended Dec 31, 2011 versus the year ago period. Color code was changed to green after trading up above it "max buy" level. Prior highs in the $29.50 area define initial support to watch on pullbacks.
>>> The latest Featured Stock Update with an annotated graph appeared on 1/19/2012. Click here.
View all notes |
Alert me of new notes |
CANSLIM.net Company Profile |
SEC |
Zacks Reports |
StockTalk |
News |
Chart |
Request a new note
C
A N
S L
I M
|
GOLD
-
NASDAQ
Randgold Resources Adr
METALS and MINING - Gold
|
$114.74
|
+1.68
1.49% |
$115.58
|
409,759
80.03% of 50 DAV
50 DAV is 512,000
|
$120.73
-4.96%
|
2/7/2012
|
$116.21
|
PP = $120.83
|
|
MB = $126.87
|
Most Recent Note - 2/21/2012 1:55:28 PM
Y - Found support at its 50 DMA line as it formed a downward sloping "handle" with losses on light volume following the previously noted base pattern. Subsequent volume-driven gains into new high territory may trigger a technical buy signal.
>>> The latest Featured Stock Update with an annotated graph appeared on 2/8/2012. Click here.
View all notes |
Alert me of new notes |
CANSLIM.net Company Profile |
SEC |
Zacks Reports |
StockTalk |
News |
Chart |
Request a new note
C
A N
S L
I M
|
Symbol/Exchange
Company Name
Industry Group |
PRICE |
CHANGE
(%Change) |
Day High |
Volume
(% DAV)
(% 50 day avg vol) |
52 Wk Hi
% From Hi |
Featured
Date |
Price
Featured |
Pivot Featured |
|
Max Buy |
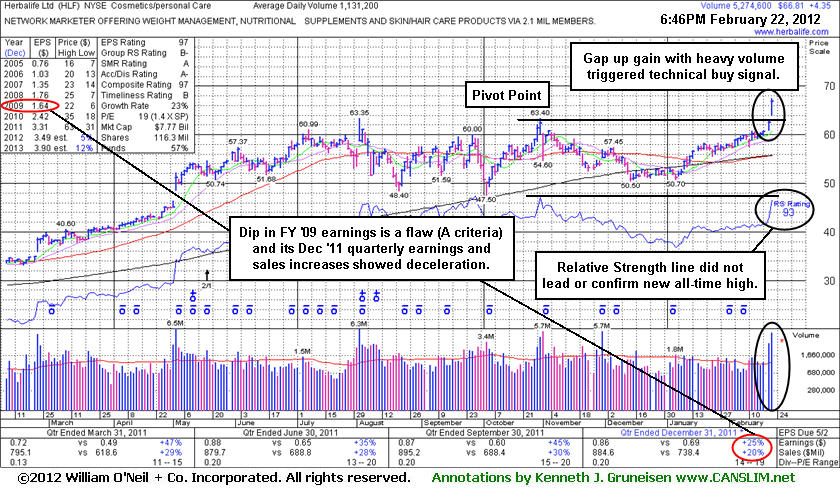
HLF
-
NYSE
Herbalife Ltd
DRUGS - Nutrition and Weight Management
|
$66.81
|
+4.35
6.96% |
$67.40
|
5,281,899
466.93% of 50 DAV
50 DAV is 1,131,200
|
$63.40
5.38%
|
2/22/2012
|
$65.90
|
PP = $63.50
|
|
MB = $66.68
|
Most Recent Note - 2/22/2012 7:45:08 PM
Y - Gapped up today and triggered a technical buy signal with a considerable volume-driven gain for a new 52-week high (N criteria). Reported earnings +25% on +20% sales revenues for the quarter ended December 31, 2011 versus the year ago period. Ownership by top-rated funds rose from 560 in Jun '11 to 627 in Dec '11, a reassuring trend concerning institutional interest (I criteria). See the latest FSU analysis for more details and a new annotated graph.
>>> The latest Featured Stock Update with an annotated graph appeared on 2/22/2012. Click here.
View all notes |
Alert me of new notes |
CANSLIM.net Company Profile |
SEC |
Zacks Reports |
StockTalk |
News |
Chart |
Request a new note
C
A N
S L
I M
|
HMSY
-
NASDAQ
H M S Holdings Corp
COMPUTER SOFTWARE and SERVICES - Healthcare Information Service
|
$32.81
|
+0.20
0.61% |
$33.10
|
650,921
69.62% of 50 DAV
50 DAV is 935,000
|
$34.98
-6.20%
|
10/27/2011
|
$26.44
|
PP = $28.37
|
|
MB = $29.79
|
Most Recent Note - 2/21/2012 1:56:58 PM
G - Reported earnings +29% on +14% sales revenues for the quarter ended Dec 31,2011 versus the year ago period. Down today, and further deterioration below its 50 DMA line would raise more serious concerns.
>>> The latest Featured Stock Update with an annotated graph appeared on 2/9/2012. Click here.
View all notes |
Alert me of new notes |
CANSLIM.net Company Profile |
SEC |
Zacks Reports |
StockTalk |
News |
Chart |
Request a new note
C
A N
S L
I M
|
ISRG
-
NASDAQ
Intuitive Surgical Inc
HEALTH SERVICES - Medical Appliances and Equipment
|
$504.08
|
-0.83
-0.16% |
$508.07
|
182,985
49.07% of 50 DAV
50 DAV is 372,900
|
$515.61
-2.24%
|
12/20/2011
|
$442.43
|
PP = $449.16
|
|
MB = $471.62
|
Most Recent Note - 2/21/2012 2:04:36 PM
G - Perched near its all-time high, stubbornly holding its ground extended from prior highs in the $475 area that define support to watch on pullbacks. Reported earnings +24% on +28% sales revenues for the quarter ended December 31, 2011 versus the year ago period.
>>> The latest Featured Stock Update with an annotated graph appeared on 1/18/2012. Click here.
View all notes |
Alert me of new notes |
CANSLIM.net Company Profile |
SEC |
Zacks Reports |
StockTalk |
News |
Chart |
Request a new note
C
A N
S L
I M
|
LULU
-
NASDAQ
Lululemon Athletica
MANUFACTURING - Textile Manufacturing
|
$65.00
|
+0.74
1.15% |
$65.34
|
1,134,589
42.60% of 50 DAV
50 DAV is 2,663,200
|
$67.22
-3.30%
|
1/10/2012
|
$60.97
|
PP = $59.46
|
|
MB = $62.43
|
Most Recent Note - 2/21/2012 7:24:55 PM
G - Hovering near its all-time high, stubbornly holding its ground with cooling volume totals in recent weeks suggesting that very few are exiting. See the latest FSU analysis for more details and a new annotated weekly graph.
>>> The latest Featured Stock Update with an annotated graph appeared on 2/21/2012. Click here.
View all notes |
Alert me of new notes |
CANSLIM.net Company Profile |
SEC |
Zacks Reports |
StockTalk |
News |
Chart |
Request a new note
C
A N
S L
I M
|
MA
-
NYSE
Mastercard Inc Cl A
DIVERSIFIED SERVICES - Business/Management Services
|
$406.83
|
+7.28
1.82% |
$408.54
|
1,008,691
93.22% of 50 DAV
50 DAV is 1,082,000
|
$401.79
1.25%
|
2/2/2012
|
$379.05
|
PP = $381.32
|
|
MB = $400.39
|
Most Recent Note - 2/22/2012 4:18:01 PM
G - Quietly rose to a new all-time high today and rallied beyond its "max buy" level. Color code is changed to green while getting extended from its prior highs. See the latest FSU analysis for more details and a new annotated graph.
>>> The latest Featured Stock Update with an annotated graph appeared on 2/17/2012. Click here.
View all notes |
Alert me of new notes |
CANSLIM.net Company Profile |
SEC |
Zacks Reports |
StockTalk |
News |
Chart |
Request a new note
C
A N
S L
I M
|
Symbol/Exchange
Company Name
Industry Group |
PRICE |
CHANGE
(%Change) |
Day High |
Volume
(% DAV)
(% 50 day avg vol) |
52 Wk Hi
% From Hi |
Featured
Date |
Price
Featured |
Pivot Featured |
|
Max Buy |
MELI
-
NASDAQ
Mercadolibre Inc
INTERNET - Internet Software and; Services
|
$97.72
|
+0.67
0.69% |
$98.00
|
447,453
91.43% of 50 DAV
50 DAV is 489,400
|
$101.84
-4.05%
|
2/6/2012
|
$97.09
|
PP = $95.58
|
|
MB = $100.36
|
Most Recent Note - 2/16/2012 12:22:28 PM
Y - Reversed into the red today after early gains into new 52-week and all-time high territory. Its weakness has quickly erased the prior session's impressive gain backed by 2 times average volume.
>>> The latest Featured Stock Update with an annotated graph appeared on 2/6/2012. Click here.
View all notes |
Alert me of new notes |
CANSLIM.net Company Profile |
SEC |
Zacks Reports |
StockTalk |
News |
Chart |
Request a new note
C
A N
S L
I M
|
MKTX
-
NASDAQ
Marketaxess Holdings Inc
FINANCIAL SERVICES - Investment Brokerage - Nationa
|
$30.53
|
-1.52
-4.74% |
$31.27
|
411,949
232.35% of 50 DAV
50 DAV is 177,300
|
$35.42
-13.81%
|
10/28/2011
|
$29.79
|
PP = $31.05
|
|
MB = $32.60
|
Most Recent Note - 2/22/2012 3:48:18 PM
G - Announced a proposed Secondary Offering of 3.6 million shares of common stock by selling stockholders. Gapped down today and traded below its 50 DMA line with a damaging loss on above average volume.
>>> The latest Featured Stock Update with an annotated graph appeared on 1/24/2012. Click here.
View all notes |
Alert me of new notes |
CANSLIM.net Company Profile |
SEC |
Zacks Reports |
StockTalk |
News |
Chart |
Request a new note
C
A N
S L
I M
|
OSIS
-
NASDAQ
O S I Systems Inc
ELECTRONICS - Semiconductor Equipment and Mate
|
$52.59
|
-0.14
-0.27% |
$52.93
|
99,356
100.06% of 50 DAV
50 DAV is 99,300
|
$57.51
-8.56%
|
11/1/2011
|
$42.07
|
PP = $45.57
|
|
MB = $47.85
|
Most Recent Note - 2/22/2012 4:07:11 PM
Consolidating just above its 50 DMA line which defines important support to watch. Earnings increase below the +25% minimum earnings guideline in the Dec '11 quarter was noted as a fundamental concern. It will be dropped from the Featured Stocks list tonight.
>>> The latest Featured Stock Update with an annotated graph appeared on 1/31/2012. Click here.
View all notes |
Alert me of new notes |
CANSLIM.net Company Profile |
SEC |
Zacks Reports |
StockTalk |
News |
Chart |
Request a new note
C
A N
S L
I M
|
RAX
-
NYSE
Rackspace Hosting Inc
INTERNET - Internet Software and; Services
|
$53.71
|
+1.46
2.79% |
$54.19
|
1,669,332
84.31% of 50 DAV
50 DAV is 1,980,100
|
$56.94
-5.67%
|
2/2/2012
|
$46.69
|
PP = $45.55
|
|
MB = $47.83
|
Most Recent Note - 2/22/2012 4:08:16 PM
G - Up today with below average volume, still consolidating following a considerable 2/14/12 gap up gain with very heavy volume following strong earnings news. Now it is too extended from the previous base to be considered an ideal buy candidate under the fact-based investment system's guidelines.
>>> The latest Featured Stock Update with an annotated graph appeared on 2/16/2012. Click here.
View all notes |
Alert me of new notes |
CANSLIM.net Company Profile |
SEC |
Zacks Reports |
StockTalk |
News |
Chart |
Request a new note
C
A N
S L
I M
|
RRTS
-
NYSE
Roadrunner Trans Systems
TRANSPORTATION - Air Delivery and Freight Service
|
$17.69
|
-0.32
-1.78% |
$18.12
|
59,686
44.31% of 50 DAV
50 DAV is 134,700
|
$18.44
-4.07%
|
2/10/2012
|
$17.40
|
PP = $17.50
|
|
MB = $18.38
|
Most Recent Note - 2/22/2012 4:10:45 PM
Y - Down today for a 3rd consecutive loss on lighter than average volume following 3 consecutive gains with above average volume. Prior highs in the $17 area define initial support to watch on pullbacks.
>>> The latest Featured Stock Update with an annotated graph appeared on 2/13/2012. Click here.
View all notes |
Alert me of new notes |
CANSLIM.net Company Profile |
SEC |
Zacks Reports |
StockTalk |
News |
Chart |
Request a new note
C
A N
S L
I M
|
Symbol/Exchange
Company Name
Industry Group |
PRICE |
CHANGE
(%Change) |
Day High |
Volume
(% DAV)
(% 50 day avg vol) |
52 Wk Hi
% From Hi |
Featured
Date |
Price
Featured |
Pivot Featured |
|
Max Buy |
SWI
-
NYSE
Solarwinds Inc
COMPUTER SOFTWARE and SERVICES - Application Software
|
$37.69
|
-0.35
-0.92% |
$38.13
|
689,387
57.84% of 50 DAV
50 DAV is 1,191,900
|
$38.65
-2.48%
|
1/26/2012
|
$32.36
|
PP = $33.78
|
|
MB = $35.47
|
Most Recent Note - 2/21/2012 1:37:42 PM
G - Quietly touched a new all-time high today, and it is extended from its latest base. Reported earnings +21% on +34% sales revenues for the quarter ended December 31, 2011 versus the year ago period. Earnings below the +25% guideline raise fundamental concerns.
>>> The latest Featured Stock Update with an annotated graph appeared on 1/26/2012. Click here.
View all notes |
Alert me of new notes |
CANSLIM.net Company Profile |
SEC |
Zacks Reports |
StockTalk |
News |
Chart |
Request a new note
C
A N
S L
I M
|
SXCI
-
NASDAQ
S X C Health Solutions
COMPUTER SOFTWARE and SERVICES - Healthcare Information Service
|
$63.53
|
+1.73
2.80% |
$64.24
|
802,748
249.46% of 50 DAV
50 DAV is 321,800
|
$66.40
-4.32%
|
1/10/2012
|
$62.05
|
PP = $60.10
|
|
MB = $63.11
|
Most Recent Note - 2/22/2012 1:13:13 PM
G - Posting a 2nd consecutive gain today with volume picking up since finding support above prior highs in the $60 area and its 50 DMA line. Due to release its fiscal 2011 fourth quarter and year-end financial results before the open on Thursday, February 23, 2012.
>>> The latest Featured Stock Update with an annotated graph appeared on 1/20/2012. Click here.
View all notes |
Alert me of new notes |
CANSLIM.net Company Profile |
SEC |
Zacks Reports |
StockTalk |
News |
Chart |
Request a new note
C
A N
S L
I M
|
TDG
-
NYSE
Transdigm Group Inc
AEROSPACE/DEFENSE - Aerospace/Defense Products and; Services
|
$117.39
|
+1.15
0.99% |
$117.86
|
353,894
102.73% of 50 DAV
50 DAV is 344,500
|
$118.83
-1.21%
|
1/10/2012
|
$98.83
|
PP = $102.83
|
|
MB = $107.97
|
Most Recent Note - 2/21/2012 1:40:29 PM
G - Still hovering near its all-time high, stubbornly holding its ground, extended from its prior base after a spurt of volume-driven gains. Prior highs near $102 define the initial support level to watch above its 50 DMA line.
>>> The latest Featured Stock Update with an annotated graph appeared on 2/10/2012. Click here.
View all notes |
Alert me of new notes |
CANSLIM.net Company Profile |
SEC |
Zacks Reports |
StockTalk |
News |
Chart |
Request a new note
C
A N
S L
I M
|
TNGO
-
NASDAQ
Tangoe Inc
COMPUTER SOFTWARE and SERVICES - Technical and System Software
|
$18.05
|
+0.31
1.75% |
$18.15
|
218,071
76.41% of 50 DAV
50 DAV is 285,400
|
$18.48
-2.33%
|
2/13/2012
|
$15.39
|
PP = $16.51
|
|
MB = $17.34
|
Most Recent Note - 2/21/2012 1:28:15 PM
G - Gain today has it perched near its best-ever close. Found support near prior highs in the $16 area during the pullback following its technical breakout last week.
>>> The latest Featured Stock Update with an annotated graph appeared on 2/14/2012. Click here.
View all notes |
Alert me of new notes |
CANSLIM.net Company Profile |
SEC |
Zacks Reports |
StockTalk |
News |
Chart |
Request a new note
C
A N
S L
I M
|
TSCO
-
NASDAQ
Tractor Supply Co
SPECIALTY RETAIL - Specialty Retail, Other
|
$83.67
|
+0.30
0.36% |
$83.91
|
608,297
84.38% of 50 DAV
50 DAV is 720,900
|
$87.13
-3.97%
|
1/12/2012
|
$79.12
|
PP = $75.58
|
|
MB = $79.36
|
Most Recent Note - 2/21/2012 1:41:28 PM
G - Volume totals have still been cooling while stubbornly holding its ground near its all-time high. Reported earnings +43% on +20% sales revenues for the quarter ended December 31, 2011 versus the year ago period. Prior highs in the mid-$70s which were a resistance area now define initial support to watch on pullbacks.
>>> The latest Featured Stock Update with an annotated graph appeared on 1/12/2012. Click here.
View all notes |
Alert me of new notes |
CANSLIM.net Company Profile |
SEC |
Zacks Reports |
StockTalk |
News |
Chart |
Request a new note
C
A N
S L
I M
|
Symbol/Exchange
Company Name
Industry Group |
PRICE |
CHANGE
(%Change) |
Day High |
Volume
(% DAV)
(% 50 day avg vol) |
52 Wk Hi
% From Hi |
Featured
Date |
Price
Featured |
Pivot Featured |
|
Max Buy |
UA
-
NYSE
Under Armour Inc Cl A
CONSUMER NON-DURABLES - Textile - Apparel Clothing
|
$82.81
|
+0.29
0.35% |
$83.49
|
540,586
42.61% of 50 DAV
50 DAV is 1,268,600
|
$87.40
-5.25%
|
2/15/2012
|
$85.77
|
PP = $84.86
|
|
MB = $89.10
|
Most Recent Note - 2/21/2012 1:43:32 PM
Y - Pulling back today on light volume, perched near its pivot point. Disciplined investors may watch for a gain above the pivot point with sufficient volume to trigger a proper technical buy signal. See the latest FSU analysis for more details and a new annotated graph.
>>> The latest Featured Stock Update with an annotated graph appeared on 2/15/2012. Click here.
View all notes |
Alert me of new notes |
CANSLIM.net Company Profile |
SEC |
Zacks Reports |
StockTalk |
News |
Chart |
Request a new note
C
A N
S L
I M
|
UBNT
-
NASDAQ
Ubiquiti Networks Inc
TELECOMMUNICATIONS - Diversified Communication Serv
|
$25.35
|
+0.35
1.40% |
$25.39
|
97,246
34.92% of 50 DAV
50 DAV is 278,500
|
$27.23
-6.90%
|
1/27/2012
|
$22.25
|
PP = $23.14
|
|
MB = $24.30
|
Most Recent Note - 2/17/2012 10:57:50 AM
G - Small gap up today, and its color code is changed to green after rising back above its "max buy" level. Prior highs in the $23 area acted as support on pullbacks following its recent technical breakout.
>>> The latest Featured Stock Update with an annotated graph appeared on 2/1/2012. Click here.
View all notes |
Alert me of new notes |
CANSLIM.net Company Profile |
SEC |
Zacks Reports |
StockTalk |
News |
Chart |
Request a new note
C
A N
S L
I M
|
ULTA
-
NASDAQ
Ulta Salon Cosm & Frag
SPECIALTY RETAIL - Specialty Retail, Other
|
$82.57
|
+0.51
0.62% |
$82.90
|
815,335
106.23% of 50 DAV
50 DAV is 767,500
|
$84.48
-2.26%
|
1/11/2012
|
$71.97
|
PP = $75.80
|
|
MB = $79.59
|
Most Recent Note - 2/16/2012 11:31:36 AM
G - Inching further into all-time high territory, it is extended from any sound base pattern. Prior highs near $75 define initial chart support above its 50 DMA line.
>>> The latest Featured Stock Update with an annotated graph appeared on 1/11/2012. Click here.
View all notes |
Alert me of new notes |
CANSLIM.net Company Profile |
SEC |
Zacks Reports |
StockTalk |
News |
Chart |
Request a new note
C
A N
S L
I M
|
V
-
NYSE
Visa Inc Cl A
DIVERSIFIED SERVICES - Business/Management Services
|
$116.36
|
+2.16
1.89% |
$116.75
|
3,595,558
87.66% of 50 DAV
50 DAV is 4,101,600
|
$117.18
-0.70%
|
2/2/2012
|
$105.43
|
PP = $104.30
|
|
MB = $109.52
|
Most Recent Note - 2/22/2012 4:12:05 PM
G - Up today with below average volume for a best-ever close. Prior highs in the $103-104 area define initial support to watch on pullbacks.
>>> The latest Featured Stock Update with an annotated graph appeared on 1/23/2012. Click here.
View all notes |
Alert me of new notes |
CANSLIM.net Company Profile |
SEC |
Zacks Reports |
StockTalk |
News |
Chart |
Request a new note
C
A N
S L
I M
|