You are not logged in.
This means you
CAN ONLY VIEW reports that were published prior to Thursday, March 20, 2025.
You
MUST UPGRADE YOUR MEMBERSHIP if you want to see any current reports.
AFTER MARKET UPDATE - THURSDAY, OCTOBER 26TH, 2023
Previous After Market Report Next After Market Report >>>
|
|
|
|
DOW |
-251.63 |
32,784.30 |
-0.76% |
|
Volume |
1,022,682,746 |
+11% |
|
Volume |
4,968,474,600 |
+7% |
|
NASDAQ |
-225.62 |
12,595.61 |
-1.76% |
|
Advancers |
1,475 |
53% |
|
Advancers |
1,965 |
46% |
|
S&P 500 |
-49.54 |
4,137.23 |
-1.18% |
|
Decliners |
1,327 |
47% |
|
Decliners |
2,328 |
54% |
|
Russell 2000 |
+5.57 |
1,657.00 |
+0.34% |
|
52 Wk Highs |
17 |
|
|
52 Wk Highs |
26 |
|
|
S&P 600 |
+3.29 |
1,079.69 |
+0.31% |
|
52 Wk Lows |
272 |
|
|
52 Wk Lows |
513 |
|
|
The market averages are in a correction (M criteria). New buying efforts should be avoided until a solid follow-through day signals a new confirmed rally.
|
 |
Major Indices Sputtered as Mega-Caps Suffered
Kenneth J. Gruneisen - Passed the CAN SLIM® Master's Exam
The market-cap weighted S&P 500 fell -1.2%. The Russell 2000 and S&P Mid Cap 400 registered gains of 0.3% and 0.5%, respectively. The volume totals were higher than the prior session on the NYSE and on the Nasdaq exchange. Decliners led advancers by a small margin on the Nasdaq exchange while advancers narrowly outnumbered decliners on the NYSE. There were 7 high-ranked companies from the Leaders List that hit new 52-week highs and were listed on the BreakOuts Page, versus the total of 4 on the prior session. New 52-week lows totals contracted yet solidly outnumbered new 52-week highs on the NYSE and on the Nasdaq exchange. The market averages are in a correction (M criteria). New buying efforts should be avoided until a solid follow-through day signals a new confirmed rally.
PICTURED: The S&P 500 Index fell further below its 200-day moving average (DMA) line with higher volume behind its 9th loss in the span of 11 sessions.
The economic news featured a whopping 4.9% real GDP growth in the third quarter, stronger-than-expected durable goods orders in September, and an initial jobless claims total (210,000) that suggested the labor market is still not showing any material weakness. Treasury yields moved lower and the 2-yr note yield fell seven basis points to 5.05%. The 10-yr note yield fell 11 basis points to 4.85% following a strong $38 billion 7-yr note auction.
Relative weakness in the mega cap space was palpable. Meta Platforms (META -3.73%) suffered a sizable decline and sank well below its 50-day moving average (DMA) line after reporting better-than-expected earnings with disappointing guidance. Alphabet (GOOG -2.55%) gapped down for a 2nd consecutive session, sinking deeper below itys 50 DMA line. Meanwhile, Ford (F -1.65%) and the UAW reached a tentative agreement. Notable names that reported earnings and were able to outperform the broader market included IBM (IBM +4.87%), Merck (MRK +1.89%), and W.W. Grainger (GWW +3.29%) among the standouts.
Israel staged a raid on Gaza in preparation for next phases of the war. The ECB leaving its corridor of key interest rates unchanged following ten consecutive rate increases.
|
 Kenneth J. Gruneisen started out as a licensed stockbroker in August 1987, a couple of months prior to the historic stock market crash that took the Dow Jones Industrial Average down -22.6% in a single day. He has published daily fact-based fundamental and technical analysis on high-ranked stocks online for two decades. Through FACTBASEDINVESTING.COM, Kenneth provides educational articles, news, market commentary, and other information regarding proven investment systems that work in good times and bad.
Comments contained in the body of this report are technical opinions only and are not necessarily those of Gruneisen Growth Corp. The material herein has been obtained from sources believed to be reliable and accurate, however, its accuracy and completeness cannot be guaranteed. Our firm, employees, and customers may effect transactions, including transactions contrary to any recommendation herein, or have positions in the securities mentioned herein or options with respect thereto. Any recommendation contained in this report may not be suitable for all investors and it is not to be deemed an offer or solicitation on our part with respect to the purchase or sale of any securities. |
|
 |
Financial, Biotech, and Networking Indexes Posted Gains
Kenneth J. Gruneisen - Passed the CAN SLIM® Master's Exam
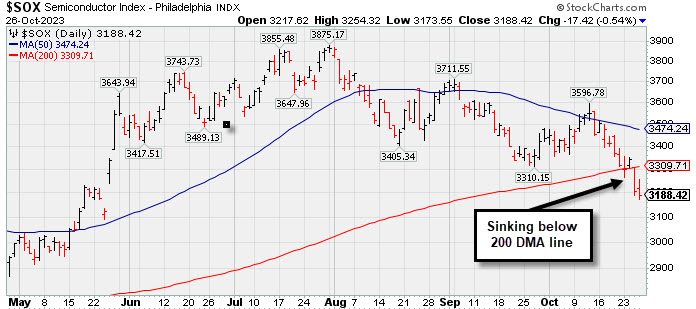
The Broker/Dealer Index ($XBD +1.65%) and the Bank Index ($BKX +1.56%) posted gains but the Retail Index ($RLX -1.13%) suffered another loss. The tech sector was mixed as the Semiconductor Index ($SOX -0.54%) edged lower while the Biotech Index ($BTK +0.53%) and Networking Index ($NWX +0.57%) both edged higher. Commodity-linked groups again had a negative bias as the Gold & Silver Index ($XAU -0.82%) and Oil Services Index ($OSX -2.30%) and the Integrated Oil Index ($XOI -0.91%) each lost ground.
PICTURED: The Semiconductor Index ($SOX -0.54%) fell further below its 200-day moving average (DMA) line with its 7th loss in the span of 8 sessions.
| Oil Services |
$OSX |
87.96 |
-2.07 |
-2.30% |
+4.89% |
| Integrated Oil |
$XOI |
1,882.30 |
-17.34 |
-0.91% |
+5.32% |
| Semiconductor |
$SOX |
3,188.42 |
-17.42 |
-0.54% |
+25.92% |
| Networking |
$NWX |
682.03 |
+3.86 |
+0.57% |
-12.93% |
| Broker/Dealer |
$XBD |
458.17 |
+7.45 |
+1.65% |
+2.01% |
| Retail |
$RLX |
3,154.06 |
-36.17 |
-1.13% |
+14.53% |
| Gold & Silver |
$XAU |
112.89 |
-0.93 |
-0.82% |
-6.59% |
| Bank |
$BKX |
73.42 |
+1.13 |
+1.56% |
-27.20% |
| Biotech |
$BTK |
4,663.35 |
+24.44 |
+0.53% |
-11.70% |
|
|
|
 |
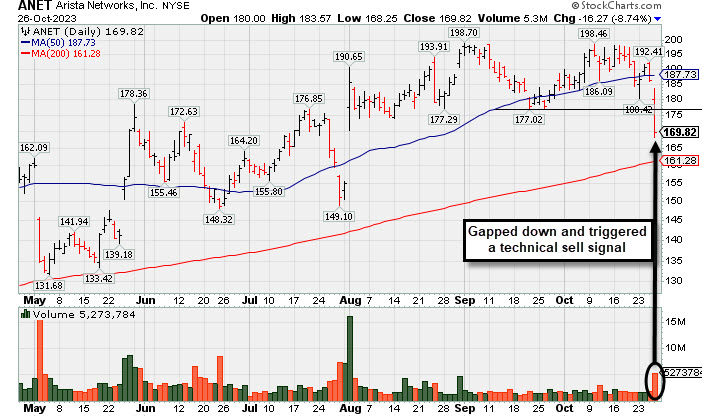
Damaging Gap Down Triggered Technical Sell Signal
Kenneth J. Gruneisen - Passed the CAN SLIM® Master's Exam
Arista Networks Inc (ANET -$13.78 or -7.40% to $172.32) gapped down today undercutting the prior low with a damaging loss raising more serious concerns and triggering a worrisome technical sell signal. It had slumped back below its 50 DMA line ($188) on the prior session and closed at the session low with a loss hurting its outlook. It will be dropped from the Featured Stocks list tonight.
Keep in mind it is due to report Sep '23 quarterly results on 10/30/23. Fundamentals have been strong through its Jun '23 quarterly earnings which rose +40% on +39% sales revenues versus the year-ago period. ANET currently has a 98 Earnings Per Share Rating. It has shown 7 consecutive quarterly comparisons with strong and steady above the +25% minimum earnings guideline (C criteria). Annual earnings (A criteria) had a downturn in FY '20 like many companies during the pandemic.
ANET was highlighted in yellow with pivot point cited based on its 12/27/21 high plus 10 cents in the 3/08/23 mid-day report (read here). It was last shown in this FSU section on 9/29/23 with an annotated graph under the headline, "Arista Consolidates Above 50-Day Moving Average Line".
The number of top-rated funds owning its shares rose from 1,758 in Dec '21 to 2,320 in Sep '23, a reassuring sign concerning the I criteria. Its current Up/Down Volume Ratio of 1.4 is an unbiased indication its shares have been under accumulation over the past 50 days. The high-ranked Computer - Networking firm has a Timeliness Rating of A and a Sponsorship Rating of C. Its small supply of 250.8 million shares (S criteria) in the public float may contribute to greater volatility in the event of institutional buying or selling.
|
|
|
Color Codes Explained :
Y - Better candidates highlighted by our
staff of experts.
G - Previously featured
in past reports as yellow but may no longer be buyable under the
guidelines.
***Last / Change / Volume data in this table is the closing quote data***
|
|
|
THESE ARE NOT BUY RECOMMENDATIONS!
Comments contained in the body of this report are technical
opinions only. The material herein has been obtained
from sources believed to be reliable and accurate, however,
its accuracy and completeness cannot be guaranteed.
This site is not an investment advisor, hence it does
not endorse or recommend any securities or other investments.
Any recommendation contained in this report may not
be suitable for all investors and it is not to be deemed
an offer or solicitation on our part with respect to
the purchase or sale of any securities. All trademarks,
service marks and trade names appearing in this report
are the property of their respective owners, and are
likewise used for identification purposes only.
This report is a service available
only to active Paid Premium Members.
You may opt-out of receiving report notifications
at any time. Questions or comments may be submitted
by writing to Premium Membership Services 665 S.E. 10 Street, Suite 201 Deerfield Beach, FL 33441-5634 or by calling 1-800-965-8307
or 954-785-1121.
|
|
|