You are not logged in.
This means you
CAN ONLY VIEW reports that were published prior to Monday, April 7, 2025.
You
MUST UPGRADE YOUR MEMBERSHIP if you want to see any current reports.
AFTER MARKET UPDATE - FRIDAY, OCTOBER 21ST, 2022
Previous After Market Report Next After Market Report >>>
|
|
|
|
DOW |
+748.97 |
31,082.56 |
+2.47% |
|
Volume |
1,219,894,592 |
+29% |
|
Volume |
4,709,708,600 |
+2% |
|
NASDAQ |
+244.87 |
10,859.72 |
+2.31% |
|
Advancers |
2,129 |
70% |
|
Advancers |
2,879 |
64% |
|
S&P 500 |
+86.97 |
3,752.75 |
+2.37% |
|
Decliners |
922 |
30% |
|
Decliners |
1,645 |
36% |
|
Russell 2000 |
+37.85 |
1,742.24 |
+2.22% |
|
52 Wk Highs |
40 |
|
|
52 Wk Highs |
70 |
|
|
S&P 600 |
+26.25 |
1,127.54 |
+2.38% |
|
52 Wk Lows |
548 |
|
|
52 Wk Lows |
454 |
|
|
More convincing gains on Friday helped the market (M criteria) signal a new uptrend with a follow-through day.
|
 |
Major Averages Posted Solid Gains With Higher Volume
Kenneth J. Gruneisen - Passed the CAN SLIM® Master's Exam
The Dow added 748 points to end the week 4.9% higher, while the Nasdaq Composite advanced 2.3% to notch a 5.2% weekly gain. The S&P 500 rose 2.4% and climbed 4.7% this week. The volume totals reported were higher than the prior session on the NYSE and on the Nasdaq exchange, inflated by options expirations. Breadth was positive as advancers led decliners by more than a 2-1 margin on the NYSE and nearly 2-1 on the Nasdaq exchange. Leadership improved as there were 17 high-ranked companies from the Leaders List that hit new 52-week highs and were listed on the BreakOuts Page, versus the total of 10 on the prior session. New 52-week lows totals expanded and outnumbered new 52-week highs totals on both the NYSE and the Nasdaq exchange. The volume totals on Friday's session were higher than the prior session while the major indices posted solid gains and the new 52-week highs total improved slightly on NYSE. The follow-through day helped establish a confirmed uptrend (M criteria). Healthy leadership (new 52-week highs totals) will be essential in the near-term for the rally to be productive.
Chart courtesy of www.stockcharts.com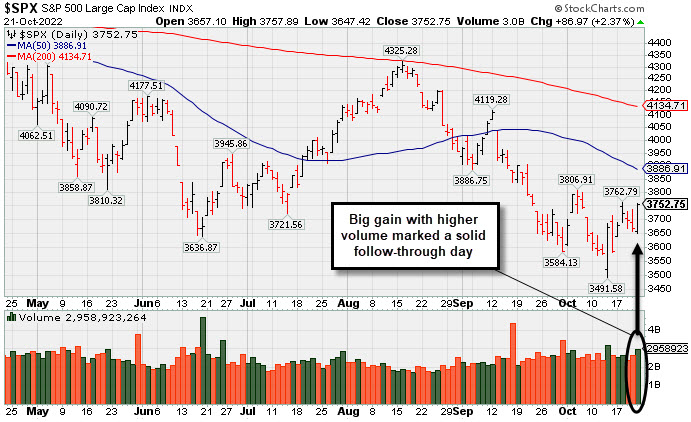 PICTURED: The S&P 500 Index posted a solid gain with higher volume on Day 7 of the rally. Only stocks meeting all key-criteria of the fact-based investment system should be considered as buy candidates.
U.S. equities finished higher Friday following reports the Federal Reserve (Fed) may implement a smaller rate increase at the December meeting. All S&P 500 sectors finished in positive territory this week, with Energy leading gains.
In earnings news, Verizon Communications Inc fell 4.5% after reporting a slip in earnings and its third-straight quarter of subscriber loss. Social media company Snap Inc (SNAP -28.08%) dove lower after missing earnings and revenue estimates and reporting its slowest sales growth since going public. American Express Co (AXP -1.7%) fell despite reporting record earnings and revenue and raising their full-year outlook. The company reported they have increased the amount of money set aside for potential consumer defaults, which has incited concern over climbing interest rates and a potential recession.
Treasuries finished mixed amid reports the Fed is concerned about overtightening monetary policy. The yield on the 10-year note dipped one basis point (0.01%) to 4.22% after hitting a 14-year high yesterday, while the 30-year bond yield climbed 10 basis points (0.10%) to 4.33%. The more policy-sensitive two-year note yield shed 13 basis points (0.13%) to 4.48%. In commodities, West Texas Intermediate (WTI) crude added 0.8% to $85.18/barrel as market participants weighed optimism over demand against recessionary concerns. Despite today’s gains, WTI crude fell 0.5% this week. The domestic benchmark has been whipsawed in recent weeks as markets assess tight supply conditions against a darkening economic outlook.
|
 Kenneth J. Gruneisen started out as a licensed stockbroker in August 1987, a couple of months prior to the historic stock market crash that took the Dow Jones Industrial Average down -22.6% in a single day. He has published daily fact-based fundamental and technical analysis on high-ranked stocks online for two decades. Through FACTBASEDINVESTING.COM, Kenneth provides educational articles, news, market commentary, and other information regarding proven investment systems that work in good times and bad.
Comments contained in the body of this report are technical opinions only and are not necessarily those of Gruneisen Growth Corp. The material herein has been obtained from sources believed to be reliable and accurate, however, its accuracy and completeness cannot be guaranteed. Our firm, employees, and customers may effect transactions, including transactions contrary to any recommendation herein, or have positions in the securities mentioned herein or options with respect thereto. Any recommendation contained in this report may not be suitable for all investors and it is not to be deemed an offer or solicitation on our part with respect to the purchase or sale of any securities. |
|
 |
Commodity-Linked Groups Led Widespread Gains
Kenneth J. Gruneisen - Passed the CAN SLIM® Master's Exam
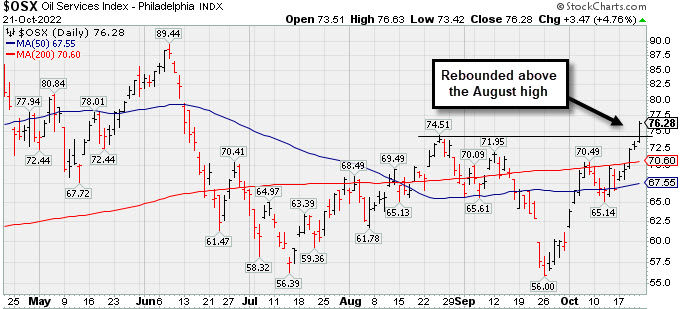
Commodity-linked groups posted standout gains on Friday as the Gold & Silver Index ($XAU +5.12%) outpaced the Oil Services Index ($OSX +4.76%) and the Integrated Oil Index ($XOI +2.58%) The Semiconductor Index ($SOX +3.70%), Networking Index ($NWX +3.56%), and Biotech Index ($BTK +2.44%) posted unanimous gains. The Broker/Dealer Index ($XBD +3.09%), Bank Index ($BKX +2.63%), and Retail Index ($RLX +2.96%) rounded out the solidly positive session with big gains.
PICTURED: The Oil Services Index ($OSX +4.76%) rebounded above its 200-day moving average (DMA) line this week and finished Friday with a big gain lifting it above the August high.
| Oil Services |
$OSX |
76.28 |
+3.47 |
+4.76% |
+44.69% |
| Integrated Oil |
$XOI |
1,793.31 |
+45.13 |
+2.58% |
+52.21% |
| Semiconductor |
$SOX |
2,336.69 |
+83.47 |
+3.70% |
-40.79% |
| Networking |
$NWX |
789.04 |
+27.12 |
+3.56% |
-18.75% |
| Broker/Dealer |
$XBD |
433.10 |
+12.97 |
+3.09% |
-11.04% |
| Retail |
$RLX |
3,082.84 |
+88.72 |
+2.96% |
-27.06% |
| Gold & Silver |
$XAU |
103.69 |
+5.05 |
+5.12% |
-21.71% |
| Bank |
$BKX |
98.84 |
+2.53 |
+2.63% |
-25.24% |
| Biotech |
$BTK |
4,682.02 |
+111.38 |
+2.44% |
-15.16% |
|
|
|
 |
Featured Stocks
Kenneth J. Gruneisen - Passed the CAN SLIM® Master's Exam
|
|
|
Color Codes Explained :
Y - Better candidates highlighted by our
staff of experts.
G - Previously featured
in past reports as yellow but may no longer be buyable under the
guidelines.
***Last / Change / Volume data in this table is the closing quote data***
Symbol/Exchange
Company Name
Industry Group |
PRICE |
CHANGE
(%Change) |
Day High |
Volume
(% DAV)
(% 50 day avg vol) |
52 Wk Hi
% From Hi |
Featured
Date |
Price
Featured |
Pivot Featured |
|
Max Buy |
 CI
-
NYSE
CI
-
NYSE
Cigna Corp
Medical-Managed Care
|
$301.34
|
+7.03
2.39% |
$302.29
|
1,821,270
93.02% of 50 DAV
50 DAV is 1,958,000
|
$300.75
0.20%
|
7/7/2022
|
$276.55
|
PP = $273.68
|
|
MB = $287.36
|
 Most Recent Note - 10/21/2022 5:21:45 PM
G - Posted a gain today with near average volume for a new all-tie high. Its 50 DMA line ($288.62) defines near-term support to watch above the recent low ($283.79 on 10/10/22). Fundamental concerns also remain after the Jun '22 quarter rose +19% on +5% sales revenues versus the year ago period, breaking a streak of 3 quarterly earnings increases above the +25% minimum guideline (C criteria).
>>> FEATURED STOCK ARTICLE : No Resistance Remains Due to Overhead Supply - 10/4/2022 |
View all notes |
Set NEW NOTE alert |
Company Profile |
SEC
News |
Chart |
Request a new note
C
A
S
I |
ESQ
-
NASDAQ
Esquire Financial Hldgs
Finance-Commercial Loans
|
$39.24
|
-0.06
-0.15% |
$39.86
|
31,018
124.07% of 50 DAV
50 DAV is 25,000
|
$41.68
-5.85%
|
10/18/2022
|
$40.02
|
PP = $39.95
|
|
MB = $41.95
|
Most Recent Note - 10/21/2022 5:24:32 PM
Y - Pulled back today with lighter (near average) volume for a 3rd consecutive loss after challenging its 52-week high. Posted a big gain on 10/18/22 and closed above the pivot point backed by +68% above average volume triggering a technical buy signal. Recent rebound above the 50 DMA line ($38.47) helped its outlook improve. Very little near-term resistance remains up to the $41.68 level.
>>> FEATURED STOCK ARTICLE : Rebound Above 50-Day Moving Average Needed for Outlook to Improve - 10/7/2022 |
View all notes |
Set NEW NOTE alert |
Company Profile |
SEC
News |
Chart |
Request a new note
C
A
S
I |
CCRN
-
NASDAQ
Cross Country Healthcare
DIVERSIFIED SERVICES - Staffing and Outsourcing Service
|
$36.43
|
+2.79
8.29% |
$36.50
|
874,295
100.49% of 50 DAV
50 DAV is 870,000
|
$35.58
2.39%
|
9/9/2022
|
$27.32
|
PP = $30.61
|
|
MB = $32.14
|
Most Recent Note - 10/21/2022 5:20:10 PM
G - Posted a big gain with higher (near average) volume for a new 52-week high. Prior highs in the $30.50 area define initial support to watch above its 50 DMA line ($28.28).
>>> FEATURED STOCK ARTICLE : Healthcare Staffing Firm Hovering Near All-Time High - 10/17/2022 |
View all notes |
Set NEW NOTE alert |
Company Profile |
SEC
News |
Chart |
Request a new note
C
A
S
I |
CMC
-
NYSE
Commercial Metals Co
METALS and MINING - Steel and Iron
|
$43.85
|
+0.91
2.12% |
$44.44
|
1,991,359
212.30% of 50 DAV
50 DAV is 938,000
|
$46.68
-6.06%
|
10/14/2022
|
$41.61
|
PP = $44.45
|
|
MB = $46.67
|
Most Recent Note - 10/21/2022 5:22:50 PM
Y - Posted a gain with +112% above average volume and closed above the pivot point triggering a technical buy signal. Faces very little resistance due to overhead supply up to the $46 level. Reported Aug '22 quarterly earnings +94% on +19% sales revenues versus the year ago period and prior quarterly comparisons were well above the +25% minimum earnings guideline (C criteria) of the fact-based investment system. Annual earnings growth has been strong.
>>> FEATURED STOCK ARTICLE : Little Resistance Remains for Strong Steel/Metal Products Firm - 10/14/2022 |
View all notes |
Set NEW NOTE alert |
Company Profile |
SEC
News |
Chart |
Request a new note
C
A
S
I |
|
|
|
THESE ARE NOT BUY RECOMMENDATIONS!
Comments contained in the body of this report are technical
opinions only. The material herein has been obtained
from sources believed to be reliable and accurate, however,
its accuracy and completeness cannot be guaranteed.
This site is not an investment advisor, hence it does
not endorse or recommend any securities or other investments.
Any recommendation contained in this report may not
be suitable for all investors and it is not to be deemed
an offer or solicitation on our part with respect to
the purchase or sale of any securities. All trademarks,
service marks and trade names appearing in this report
are the property of their respective owners, and are
likewise used for identification purposes only.
This report is a service available
only to active Paid Premium Members.
You may opt-out of receiving report notifications
at any time. Questions or comments may be submitted
by writing to Premium Membership Services 665 S.E. 10 Street, Suite 201 Deerfield Beach, FL 33441-5634 or by calling 1-800-965-8307
or 954-785-1121.
|
|
|