You are not logged in.
This means you
CAN ONLY VIEW reports that were published prior to Tuesday, April 8, 2025.
You
MUST UPGRADE YOUR MEMBERSHIP if you want to see any current reports.
AFTER MARKET UPDATE - THURSDAY, OCTOBER 20TH, 2022
Previous After Market Report Next After Market Report >>>
|
|
|
|
DOW |
-90.22 |
30,333.59 |
-0.30% |
|
Volume |
943,877,259 |
+3% |
|
Volume |
4,601,688,900 |
-6% |
|
NASDAQ |
-65.66 |
10,614.84 |
-0.61% |
|
Advancers |
928 |
31% |
|
Advancers |
1,848 |
41% |
|
S&P 500 |
-29.38 |
3,665.78 |
-0.80% |
|
Decliners |
2,083 |
69% |
|
Decliners |
2,710 |
59% |
|
Russell 2000 |
-21.36 |
1,704.39 |
-1.24% |
|
52 Wk Highs |
37 |
|
|
52 Wk Highs |
72 |
|
|
S&P 600 |
-15.76 |
1,101.29 |
-1.41% |
|
52 Wk Lows |
412 |
|
|
52 Wk Lows |
372 |
|
|
More convincing gains in the morning faded on Tuesday as the market (M criteria) appeared to signal a new uptrend with a mediocre follow-through day. Since then the market has only sputtered.
|
 |
Breadth Negative as Major Indices Fell Again
Kenneth J. Gruneisen - Passed the CAN SLIM® Master's Exam
The Dow lost 90 points, while the Nasdaq Composite shed 0.6%. The S&P 500 declined 0.8%. The volume totals reported were mixed, higher than the prior session on the NYSE and lighter on the Nasdaq exchange. Breadth was negative as decliners led advancers by more than a 2-1 margin on the NYSE and 3-2 on the Nasdaq exchange. There were 10 high-ranked companies from the Leaders List that hit new 52-week highs and were listed on the BreakOuts Page, versus the total of 9 on the prior session. New 52-week lows totals expanded and outnumbered new 52-week highs totals on both the NYSE and the Nasdaq exchange. The volume totals on Tuesday's session were higher than the prior session while the major indices' gains were rather small, and new 52-week highs totals improved slightly on Nasdaq exchange but they were lower on the NYSE. It was not a very convincing follow-through day, but it may be considered enough to establish a new confirmed uptrend (M criteria). Further improvement in leadership (new 52-week highs totals) will be essential in the near-term for the rally to be productive.
Chart courtesy of www.stockcharts.com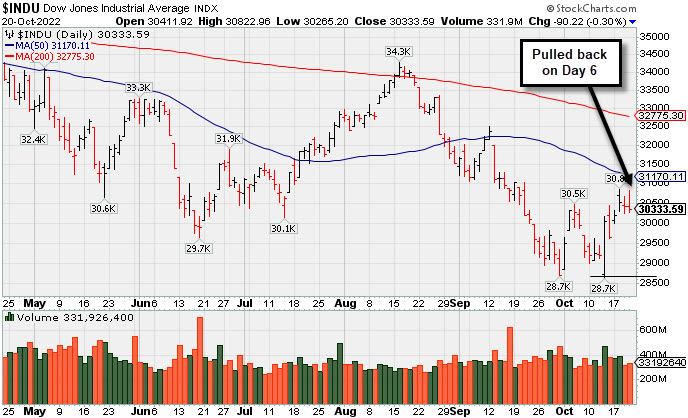 PICTURED: The Dow Jones Industrial Average fell with slightly higher volume on Day 6 of the new rally attempt. Only stocks meeting all key-criteria of the fact-based investment system should be considered as buy candidates.
U.S. equities fell on Thursday as investors weighed soaring Treasury yields against corporate earnings. Eight of 11 S&P 500 sectors finished in negative territory, with Utilities leading laggards. In corporate news, Tesla Inc (TSLA -6.65%) fell after their Chief Executive Officer (CEO), Elon Musk, announced a cut to its 2022 growth expectations following the challenges to meet deliverables. Union Pacific Corp (UNP -6.80%) fell as investors’ concerns over the growing costs of equipment, fuel, and labor outweighed beating earnings and revenue estimates.
Treasury yields climbed to record highs Thursday following commentary from Philadelphia Federal Reserve (Fed) President Patrick Harker. Harker reiterated Minneapolis Fed President Neel Kashkari’s comments, saying higher interest rates have done little to keep inflation down and more rate increases are necessary to curb it. The yield on the benchmark 10-year note rose 10 basis points (0.10%) to 4.23%, its highest level since 2008, while the yield on the 30-year bond climbed 11 basis points (0.11%) to 4.23%. The yield on the more policy-sensitive two-year note advanced six basis points (0.06%) to 4.61%, its highest point since 2007. In commodities, West Texas Intermediate (WTI) crude gained 0.5% to $85.98/barrel after China announced they are considering easing COVID-19 quarantine requirements for visitors from 10 days to seven. Meanwhile, the White House has announced they will be releasing 15 million barrels of oil from the Strategic Petroleum Reserve (SPR) by the end of 2022.
|
 Kenneth J. Gruneisen started out as a licensed stockbroker in August 1987, a couple of months prior to the historic stock market crash that took the Dow Jones Industrial Average down -22.6% in a single day. He has published daily fact-based fundamental and technical analysis on high-ranked stocks online for two decades. Through FACTBASEDINVESTING.COM, Kenneth provides educational articles, news, market commentary, and other information regarding proven investment systems that work in good times and bad.
Comments contained in the body of this report are technical opinions only and are not necessarily those of Gruneisen Growth Corp. The material herein has been obtained from sources believed to be reliable and accurate, however, its accuracy and completeness cannot be guaranteed. Our firm, employees, and customers may effect transactions, including transactions contrary to any recommendation herein, or have positions in the securities mentioned herein or options with respect thereto. Any recommendation contained in this report may not be suitable for all investors and it is not to be deemed an offer or solicitation on our part with respect to the purchase or sale of any securities. |
|
 |
Commodity-Linked Groups and Semiconductor Index Rose
Kenneth J. Gruneisen - Passed the CAN SLIM® Master's Exam
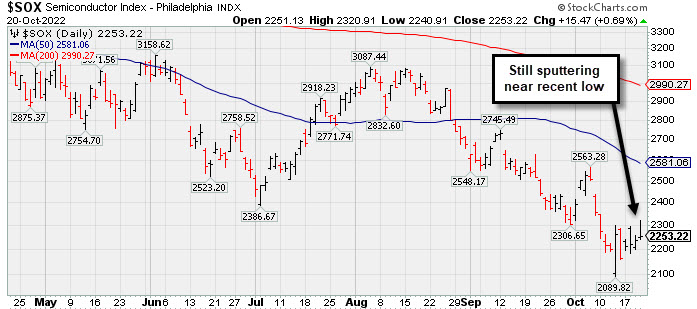
Losses for the Bank Index ($BKX -2.21%), Broker/Dealer Index ($XBD -1.10%), and Retail Index ($RLX -0.70%) created a drag on the major averages on Thursday. Commodity-linked groups had a positive bias as the Gold & Silver Index ($XAU +1.40%) outpaced the Oil Services Index ($OSX +0.71%) and the Integrated Oil Index ($XOI +0.54%). The Semiconductor Index ($SOX +0.69%) edged higher while the Networking Index ($NWX -0.22%) and Biotech Index ($BTK -0.71%) created a drag on the tech sector. PICTURED: The Semiconductor Index ($SOX +0.69%) has been sputtering near the recent low, well below its 50-day and 200-day moving average (DMA) lines.
| Oil Services |
$OSX |
72.81 |
+0.52 |
+0.71% |
+38.11% |
| Integrated Oil |
$XOI |
1,748.17 |
+9.47 |
+0.54% |
+48.38% |
| Semiconductor |
$SOX |
2,253.22 |
+15.47 |
+0.69% |
-42.90% |
| Networking |
$NWX |
761.92 |
-1.67 |
-0.22% |
-21.54% |
| Broker/Dealer |
$XBD |
420.14 |
-4.66 |
-1.10% |
-13.70% |
| Retail |
$RLX |
2,994.14 |
-21.13 |
-0.70% |
-29.16% |
| Gold & Silver |
$XAU |
98.65 |
+1.37 |
+1.40% |
-25.52% |
| Bank |
$BKX |
96.31 |
-2.17 |
-2.21% |
-27.16% |
| Biotech |
$BTK |
4,570.64 |
-32.64 |
-0.71% |
-17.18% |
|
|
|
 |
Featured Stocks
Kenneth J. Gruneisen - Passed the CAN SLIM® Master's Exam
|
|
|
Color Codes Explained :
Y - Better candidates highlighted by our
staff of experts.
G - Previously featured
in past reports as yellow but may no longer be buyable under the
guidelines.
***Last / Change / Volume data in this table is the closing quote data***
Symbol/Exchange
Company Name
Industry Group |
PRICE |
CHANGE
(%Change) |
Day High |
Volume
(% DAV)
(% 50 day avg vol) |
52 Wk Hi
% From Hi |
Featured
Date |
Price
Featured |
Pivot Featured |
|
Max Buy |
 CI
-
NYSE
CI
-
NYSE
Cigna Corp
Medical-Managed Care
|
$294.31
|
+1.23
0.42% |
$296.98
|
1,456,798
74.52% of 50 DAV
50 DAV is 1,955,000
|
$300.75
-2.14%
|
7/7/2022
|
$276.55
|
PP = $273.68
|
|
MB = $287.36
|
Most Recent Note - 10/18/2022 5:03:33 PM
G - Posted a gain today with average volume. Its 50 DMA line ($288) defines near-term support to watch above the recent low ($283.79 on 10/10/22). Fundamental concerns also remain after the Jun '22 quarter rose +19% on +5% sales revenues versus the year ago period, breaking a streak of 3 quarterly earnings increases above the +25% minimum guideline (C criteria).
>>> FEATURED STOCK ARTICLE : No Resistance Remains Due to Overhead Supply - 10/4/2022 |
View all notes |
Set NEW NOTE alert |
Company Profile |
SEC
News |
Chart |
Request a new note
C
A
S
I |
ESQ
-
NASDAQ
Esquire Financial Hldgs
Finance-Commercial Loans
|
$39.30
|
-0.92
-2.29% |
$41.60
|
55,183
220.73% of 50 DAV
50 DAV is 25,000
|
$41.68
-5.71%
|
10/18/2022
|
$40.02
|
PP = $39.95
|
|
MB = $41.95
|
 Most Recent Note - 10/20/2022 12:25:39 PM
Y - Pulled back from today's early high challenging its 52-week high. Posted a big gain on 10/18/22 and closed above the pivot point backed by +68% above average volume triggering a technical buy signal. Recent rebound above the 50 DMA line ($38.48) helped its outlook improve. Very little near-term resistance remains up to the $41.68 level.
>>> FEATURED STOCK ARTICLE : Rebound Above 50-Day Moving Average Needed for Outlook to Improve - 10/7/2022 |
View all notes |
Set NEW NOTE alert |
Company Profile |
SEC
News |
Chart |
Request a new note
C
A
S
I |
CCRN
-
NASDAQ
Cross Country Healthcare
DIVERSIFIED SERVICES - Staffing and Outsourcing Service
|
$33.64
|
-0.16
-0.47% |
$34.63
|
480,123
55.06% of 50 DAV
50 DAV is 872,000
|
$35.58
-5.45%
|
9/9/2022
|
$27.32
|
PP = $30.61
|
|
MB = $32.14
|
Most Recent Note - 10/19/2022 5:10:44 PM
G - There was a "negative reversal" today with lighter than average volume after touching a new all-time high. Prior highs in the $30.50 area define initial support to watch above its 50 DMA line ($27.78).
>>> FEATURED STOCK ARTICLE : Healthcare Staffing Firm Hovering Near All-Time High - 10/17/2022 |
View all notes |
Set NEW NOTE alert |
Company Profile |
SEC
News |
Chart |
Request a new note
C
A
S
I |
CMC
-
NYSE
Commercial Metals Co
METALS and MINING - Steel and Iron
|
$42.94
|
+0.44
1.04% |
$44.13
|
1,028,505
110.00% of 50 DAV
50 DAV is 935,000
|
$46.68
-8.01%
|
10/14/2022
|
$41.61
|
PP = $44.45
|
|
MB = $46.67
|
Most Recent Note - 10/20/2022 5:22:17 PM
Y - Challenged its August high with today's early gain but ended near the middle of its intra-day range. Highlighted in yellow in the 10/14/22 mid-day report with pivot point cited based on its 8/11/22 high plus 10 cents. Subsequent gains above the pivot point backed by at least +40% above average volume may trigger a technical buy signal. Faces little resistance due to overhead supply up to the $46 level. Reported Aug '22 quarterly earnings +94% on +19% sales revenues versus the year ago period and prior quarterly comparisons were well above the +25% minimum earnings guideline (C criteria) of the fact-based investment system. Annual earnings growth has been strong.
>>> FEATURED STOCK ARTICLE : Little Resistance Remains for Strong Steel/Metal Products Firm - 10/14/2022 |
View all notes |
Set NEW NOTE alert |
Company Profile |
SEC
News |
Chart |
Request a new note
C
A
S
I |
|
|
|
THESE ARE NOT BUY RECOMMENDATIONS!
Comments contained in the body of this report are technical
opinions only. The material herein has been obtained
from sources believed to be reliable and accurate, however,
its accuracy and completeness cannot be guaranteed.
This site is not an investment advisor, hence it does
not endorse or recommend any securities or other investments.
Any recommendation contained in this report may not
be suitable for all investors and it is not to be deemed
an offer or solicitation on our part with respect to
the purchase or sale of any securities. All trademarks,
service marks and trade names appearing in this report
are the property of their respective owners, and are
likewise used for identification purposes only.
This report is a service available
only to active Paid Premium Members.
You may opt-out of receiving report notifications
at any time. Questions or comments may be submitted
by writing to Premium Membership Services 665 S.E. 10 Street, Suite 201 Deerfield Beach, FL 33441-5634 or by calling 1-800-965-8307
or 954-785-1121.
|
|
|