You are not logged in.
This means you
CAN ONLY VIEW reports that were published prior to Monday, April 7, 2025.
You
MUST UPGRADE YOUR MEMBERSHIP if you want to see any current reports.
AFTER MARKET UPDATE - TUESDAY, OCTOBER 18TH, 2022
Previous After Market Report Next After Market Report >>>
|
|
|
|
DOW |
+337.98 |
30,523.80 |
+1.12% |
|
Volume |
1,015,773,771 |
+6% |
|
Volume |
5,029,527,000 |
+15% |
|
NASDAQ |
+96.60 |
10,772.40 |
+0.90% |
|
Advancers |
2,146 |
71% |
|
Advancers |
2,900 |
63% |
|
S&P 500 |
+42.03 |
3,719.98 |
+1.14% |
|
Decliners |
890 |
29% |
|
Decliners |
1,682 |
37% |
|
Russell 2000 |
+20.20 |
1,755.96 |
+1.16% |
|
52 Wk Highs |
40 |
|
|
52 Wk Highs |
76 |
|
|
S&P 600 |
+13.04 |
1,134.17 |
+1.16% |
|
52 Wk Lows |
115 |
|
|
52 Wk Lows |
156 |
|
|
More convincing gains in the morning faded on Tuesday as the market (M criteria) appeared to signal a new uptrend with a mediocre follow-through day.
|
 |
Indices Rose With Higher Volume for a Mediocre Follow-Through Day
Kenneth J. Gruneisen - Passed the CAN SLIM® Master's Exam
The Dow added 337 points, while the Nasdaq Composite jumped 0.9% amid strength in Technology shares. The S&P 500 climbed 1.1%. All of the indices ended well off the session's early highs. The volume totals reported were higher than the prior session on the NYSE and on the Nasdaq exchange, indicative of an increase in institutional buying demand behind the gains. Breadth was positive as advancers led decliners by more than a 2-1 margin on the NYSE and by nearly 2-1 on the Nasdaq exchange. There were 12 high-ranked companies from the Leaders List that hit new 52-week highs and were listed on the BreakOuts Page, versus the total of 5 on the prior session. New 52-week lows totals contracted but still outnumbered new 52-week highs totals on both the NYSE and the Nasdaq exchange. The volume totals were higher than the prior session while the major indices' gains were rather small, and new 52-week highs totals improved slightly on Nasdaq exchange but they were lower on the NYSE. It was not a very convincing follow-through day, but it may be considered enough to establish a new confirmed uptrend (M criteria). Further improvement in leadership (new 52-week highs totals) will be essential in the near-term for the rally to be productive.
Chart courtesy of www.stockcharts.com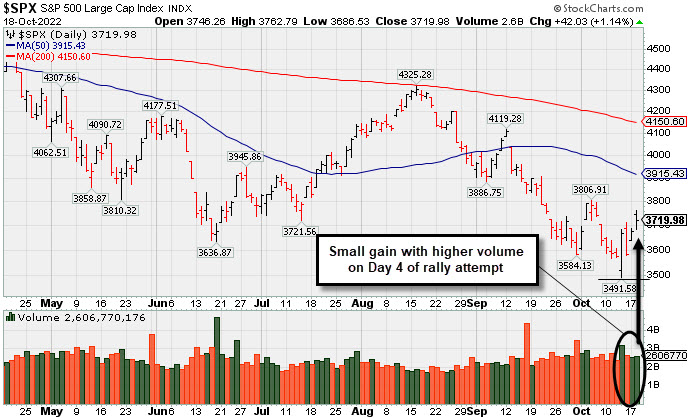 PICTURED: The S&P 500 Index rose +1.14% with slightly higher volume on Day 4 of the new rally attempt. Only stocks meeting all key-criteria of the fact-based investment system should be considered as buy candidates.
U.S. equities finished higher Tuesday as investors assessed a flurry of corporate earnings and fresh economic data. All sectors in the S&P 500 finished in positive territory, with Industrials pacing gains.
On the data front, the National Association of Home Builders (NAHB) Housing Market Index showed homebuilder sentiment declined more than expected in October. The report cited soaring mortgage rates dampening demand as the main driver behind the sharp decline in sentiment. Meanwhile, the September update on industrial production saw a 0.4% monthly gain, its third-month of increases, indicating business investment and consumer demand remain robust despite the Federal Reserve’s (Fed) aggressive interest rate hikes.
In corporate news, Goldman Sachs Group Inc (GS +2.33%) reported better-than-expected profit and revenue in the third quarter, after trading results beat forecasts. The company has also announced they are reorganizing their corporate structure. Hasbro Inc (HAS -2.88%) fell after their third-quarter earnings missed estimates. The toy company’s Chief Executive Officer (CEO) cited increased price pressures due to high inflation as the reason behind the earnings miss.
Treasuries strengthened after a volatile session, with the yield on the benchmark 10-year note shedding three basis points (0.03%) to 3.99%, while the 30-year bond yield was little changed at 4.02%. The two-year note dipped two basis points (0.02%) to 4.43%. In commodities, West Texas Intermediate (WTI) crude declined 2.7% to $83.14/barrel amid growing concerns over global fuel demand.
|
 Kenneth J. Gruneisen started out as a licensed stockbroker in August 1987, a couple of months prior to the historic stock market crash that took the Dow Jones Industrial Average down -22.6% in a single day. He has published daily fact-based fundamental and technical analysis on high-ranked stocks online for two decades. Through FACTBASEDINVESTING.COM, Kenneth provides educational articles, news, market commentary, and other information regarding proven investment systems that work in good times and bad.
Comments contained in the body of this report are technical opinions only and are not necessarily those of Gruneisen Growth Corp. The material herein has been obtained from sources believed to be reliable and accurate, however, its accuracy and completeness cannot be guaranteed. Our firm, employees, and customers may effect transactions, including transactions contrary to any recommendation herein, or have positions in the securities mentioned herein or options with respect thereto. Any recommendation contained in this report may not be suitable for all investors and it is not to be deemed an offer or solicitation on our part with respect to the purchase or sale of any securities. |
|
 |
Retail, Financial, Tech, and Commodity-Linked Groups Rose
Kenneth J. Gruneisen - Passed the CAN SLIM® Master's Exam
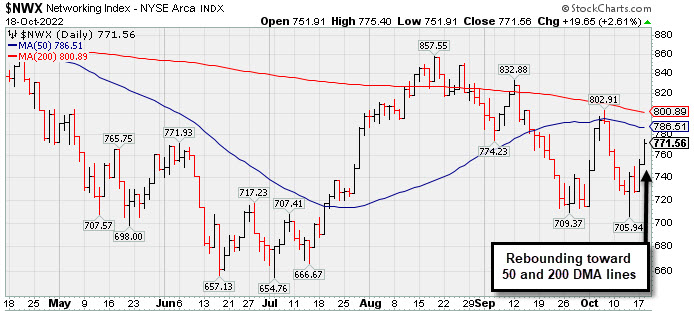
The Retail Index ($RLX +1.78%), Bank Index ($BKX +1.04%), and Broker/Dealer Index ($XBD +1.44%) posted influential gains that helped the major averages rise. The Networking Index ($NWX +2.61%) led the tech sector higher while the Semiconductor Index ($SOX +0.42%) and Biotech Index ($BTK +0.35%) both posted smaller gains. The Oil Services Index ($OSX +1.40%), Integrated Oil Index ($XOI +0.84%), and Gold & Silver Index ($XAU +0.92%) also rose.
PICTURED: The Networking Index ($NWX +2.61%) posted a solid gain but remains below its 50-day and 200-day moving average (DMA) lines.
| Oil Services |
$OSX |
69.43 |
+0.96 |
+1.40% |
+31.70% |
| Integrated Oil |
$XOI |
1,694.88 |
+14.05 |
+0.84% |
+43.85% |
| Semiconductor |
$SOX |
2,220.96 |
+9.30 |
+0.42% |
-43.72% |
| Networking |
$NWX |
771.56 |
+19.65 |
+2.61% |
-20.55% |
| Broker/Dealer |
$XBD |
429.07 |
+6.08 |
+1.44% |
-11.87% |
| Retail |
$RLX |
3,069.91 |
+53.82 |
+1.78% |
-27.36% |
| Gold & Silver |
$XAU |
99.98 |
+0.91 |
+0.92% |
-24.51% |
| Bank |
$BKX |
102.17 |
+1.05 |
+1.04% |
-22.73% |
| Biotech |
$BTK |
4,766.54 |
+16.40 |
+0.35% |
-13.63% |
|
|
|
 |
Featured Stocks
Kenneth J. Gruneisen - Passed the CAN SLIM® Master's Exam
|
|
|
Color Codes Explained :
Y - Better candidates highlighted by our
staff of experts.
G - Previously featured
in past reports as yellow but may no longer be buyable under the
guidelines.
***Last / Change / Volume data in this table is the closing quote data***
Symbol/Exchange
Company Name
Industry Group |
PRICE |
CHANGE
(%Change) |
Day High |
Volume
(% DAV)
(% 50 day avg vol) |
52 Wk Hi
% From Hi |
Featured
Date |
Price
Featured |
Pivot Featured |
|
Max Buy |
 CI
-
NYSE
CI
-
NYSE
Cigna Corp
Medical-Managed Care
|
$293.74
|
+3.82
1.32% |
$296.23
|
2,013,018
102.60% of 50 DAV
50 DAV is 1,962,000
|
$300.75
-2.33%
|
7/7/2022
|
$276.55
|
PP = $273.68
|
|
MB = $287.36
|
 Most Recent Note - 10/18/2022 5:03:33 PM
G - Posted a gain today with average volume. Its 50 DMA line ($288) defines near-term support to watch above the recent low ($283.79 on 10/10/22). Fundamental concerns also remain after the Jun '22 quarter rose +19% on +5% sales revenues versus the year ago period, breaking a streak of 3 quarterly earnings increases above the +25% minimum guideline (C criteria).
>>> FEATURED STOCK ARTICLE : No Resistance Remains Due to Overhead Supply - 10/4/2022 |
View all notes |
Set NEW NOTE alert |
Company Profile |
SEC
News |
Chart |
Request a new note
C
A
S
I |
ESQ
-
NASDAQ
Esquire Financial Hldgs
Finance-Commercial Loans
|
$41.15
|
+2.27
5.84% |
$41.43
|
42,425
169.70% of 50 DAV
50 DAV is 25,000
|
$41.68
-1.27%
|
10/18/2022
|
$40.02
|
PP = $39.95
|
|
MB = $41.95
|
Most Recent Note - 10/18/2022 5:05:56 PM
Y - Color code was changed to yellow with new pivot point cited based on its 9/16/22 high plus 10 cents. Posted a big gain and closed above the pivot point backed by +68% above average volume triggering a technical buy signal. Recent rebound above the 50 DMA line ($38.38) helped its outlook improve. Very little near-term resistance remains up to the $41.68 level.
>>> FEATURED STOCK ARTICLE : Rebound Above 50-Day Moving Average Needed for Outlook to Improve - 10/7/2022 |
View all notes |
Set NEW NOTE alert |
Company Profile |
SEC
News |
Chart |
Request a new note
C
A
S
I |
CCRN
-
NASDAQ
Cross Country Healthcare
DIVERSIFIED SERVICES - Staffing and Outsourcing Service
|
$35.13
|
+1.60
4.77% |
$35.34
|
862,286
99.92% of 50 DAV
50 DAV is 863,000
|
$34.98
0.43%
|
9/9/2022
|
$27.32
|
PP = $30.61
|
|
MB = $32.14
|
Most Recent Note - 10/18/2022 5:02:37 PM
G - Posted a big gain today with higher (average) volume for a new all-time high. Prior highs in the $30.50 area define initial support to watch above its 50 DMA line ($27.55).
>>> FEATURED STOCK ARTICLE : Healthcare Staffing Firm Hovering Near All-Time High - 10/17/2022 |
View all notes |
Set NEW NOTE alert |
Company Profile |
SEC
News |
Chart |
Request a new note
C
A
S
I |
CMC
-
NYSE
Commercial Metals Co
METALS and MINING - Steel and Iron
|
$43.19
|
+0.67
1.58% |
$43.99
|
1,566,199
171.54% of 50 DAV
50 DAV is 913,000
|
$46.68
-7.48%
|
10/14/2022
|
$41.61
|
PP = $44.45
|
|
MB = $46.67
|
Most Recent Note - 10/18/2022 5:04:13 PM
Y - Challenged its August high with today's volume-driven gain adding to a recent spurt. Highlighted in yellow in the 10/14/22 mid-day report with pivot point cited based on its 8/11/22 high plus 10 cents. Subsequent gains above the pivot point backed by at least +40% above average volume may trigger a technical buy signal. Faces little resistance due to overhead supply up to the $46 level. Reported Aug '22 quarterly earnings +94% on +19% sales revenues versus the year ago period and prior quarterly comparisons were well above the +25% minimum earnings guideline (C criteria) of the fact-based investment system. Annual earnings growth has been strong.
>>> FEATURED STOCK ARTICLE : Little Resistance Remains for Strong Steel/Metal Products Firm - 10/14/2022 |
View all notes |
Set NEW NOTE alert |
Company Profile |
SEC
News |
Chart |
Request a new note
C
A
S
I |
|
|
|
THESE ARE NOT BUY RECOMMENDATIONS!
Comments contained in the body of this report are technical
opinions only. The material herein has been obtained
from sources believed to be reliable and accurate, however,
its accuracy and completeness cannot be guaranteed.
This site is not an investment advisor, hence it does
not endorse or recommend any securities or other investments.
Any recommendation contained in this report may not
be suitable for all investors and it is not to be deemed
an offer or solicitation on our part with respect to
the purchase or sale of any securities. All trademarks,
service marks and trade names appearing in this report
are the property of their respective owners, and are
likewise used for identification purposes only.
This report is a service available
only to active Paid Premium Members.
You may opt-out of receiving report notifications
at any time. Questions or comments may be submitted
by writing to Premium Membership Services 665 S.E. 10 Street, Suite 201 Deerfield Beach, FL 33441-5634 or by calling 1-800-965-8307
or 954-785-1121.
|
|
|