You are not logged in.
This means you
CAN ONLY VIEW reports that were published prior to Monday, April 21, 2025.
You
MUST UPGRADE YOUR MEMBERSHIP if you want to see any current reports.
AFTER MARKET UPDATE - THURSDAY, OCTOBER 13TH, 2022
Previous After Market Report Next After Market Report >>>
|
|
|
|
DOW |
+827.87 |
30,038.72 |
+2.83% |
|
Volume |
1,081,493,071 |
+20% |
|
Volume |
5,265,429,700 |
+30% |
|
NASDAQ |
+232.05 |
10,649.15 |
+2.23% |
|
Advancers |
2,056 |
70% |
|
Advancers |
2,749 |
65% |
|
S&P 500 |
+92.88 |
3,669.91 |
+2.60% |
|
Decliners |
869 |
30% |
|
Decliners |
1,485 |
35% |
|
Russell 2000 |
+40.65 |
1,728.41 |
+2.41% |
|
52 Wk Highs |
29 |
|
|
52 Wk Highs |
71 |
|
|
S&P 600 |
+27.66 |
1,116.80 |
+2.54% |
|
52 Wk Lows |
934 |
|
|
52 Wk Lows |
958 |
|
|
The market (M criteria) is still in a correction. Disciplined investors know to protect cash by avoiding any new buys until a new uptrend is confirmed with a proper follow-through day.
|
 |
Positive Reversal Marks Only Day 1 of New Rally Attempt
Kenneth J. Gruneisen - Passed the CAN SLIM® Master's Exam
The Dow added 827 points, while the Nasdaq Composite advanced 2.2%. The S&P 500 gained 2.6% after seeing its largest turnaround since March 2020.The volume totals reported were higher than the prior session on the NYSE and on the Nasdaq exchange, indicative of an increase in institutional buying demand. Breadth was positive as advancers led decliners by more than a 2-1 margin on the NYSE and better than 5-3 on the Nasdaq exchange. There were 9 high-ranked companies from the Leaders List that hit new 52-week highs and were listed on the BreakOuts Page, versus the total of 1 on the prior session. New 52-week lows totals swelled and solidly outnumbered shrinking new 52-week highs totals on both the NYSE and the Nasdaq exchange. The market is still in a correction (M criteria). Caution and patience remain paramount. Disciplined investors know to watch for a follow-through day of big gains to confirm a new uptrend.
Chart courtesy of www.stockcharts.com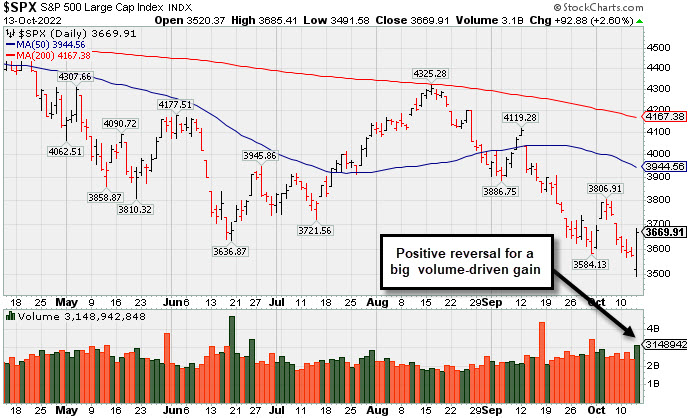 PICTURED: The S&P 500 Index managed a "positive reversal" for a solid gain marking Day 1 of a new rally attempt. A solid follow-through day (ideally on Day 4-7) is needed as confirmation of a new market uptrend.
U.S. equities rebounded from their lowest levels since 2020 to finish higher Thursday while investors weighed today’s inflation data. All S&P 500 sectors finished in positive territory, with Financials and Energy pacing gains.
On the data front, the September Consumer Price Index (CPI) report came in hotter-than-expected, raising the probability of an aggressive interest rate hike by the Federal Reserve (Fed). The report showed inflation climbed 0.4% month-over-month, up from August’s 0.1% monthly gain. Meanwhile, core CPI (which excludes the more volatile food and energy prices) remained unchanged from August’s 0.6% monthly gain. The headline figure showed prices climbed 8.2% year-over-year, easing slightly from August’s 8.3% figure. The headline figure for core CPI came in at 6.6% to notch a fresh 40-year high, up from the 6.3% annual gain seen in August. The report cited shelter, food, and medical services as the key drivers behind the elevated figures, which shows inflation is more broad-based than before.
Treasuries weakened along the curve, with the yield on the benchmark 10-year note adding six basis points (0.06%) to 3.96% after climbing over the 4% threshold following the CPI report. The 30-year bond yield advanced six basis points (0.06%) to 3.93%, while the yield on the more Fed-sensitive two-year note jumped 19 basis points (0.19%) to 4.48%. In commodities, West Texas Intermediate (WTI) crude increased 2.2% to $89.16/barrel amid tight supply conditions. The U.S. Dollar Index shed 0.8%. |
 Kenneth J. Gruneisen started out as a licensed stockbroker in August 1987, a couple of months prior to the historic stock market crash that took the Dow Jones Industrial Average down -22.6% in a single day. He has published daily fact-based fundamental and technical analysis on high-ranked stocks online for two decades. Through FACTBASEDINVESTING.COM, Kenneth provides educational articles, news, market commentary, and other information regarding proven investment systems that work in good times and bad.
Comments contained in the body of this report are technical opinions only and are not necessarily those of Gruneisen Growth Corp. The material herein has been obtained from sources believed to be reliable and accurate, however, its accuracy and completeness cannot be guaranteed. Our firm, employees, and customers may effect transactions, including transactions contrary to any recommendation herein, or have positions in the securities mentioned herein or options with respect thereto. Any recommendation contained in this report may not be suitable for all investors and it is not to be deemed an offer or solicitation on our part with respect to the purchase or sale of any securities. |
|
 |
Tech, Financial, and Energy-Linked Groups Posted Solid Gains
Kenneth J. Gruneisen - Passed the CAN SLIM® Master's Exam
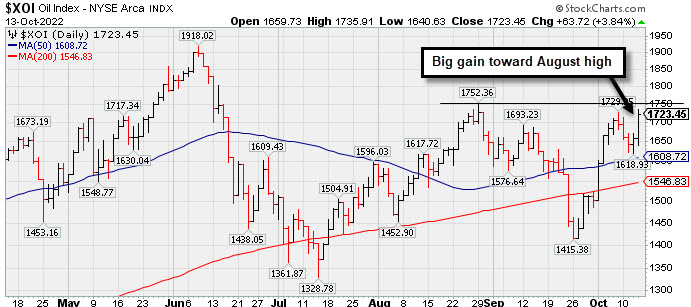
The tech sector had a positive bias as the Semiconductor Index ($SOX +2.94%), Biotech Index ($BTK +2.21%), and Networking Index ($NWX +1.93%) posted unanimous gains. The Bank Index ($BKX +5.19%) was a standout gainer and the Broker/Dealer Index ($XBD +1.95%) also was a positive influence on the major averages. Meanwhile, the Retail Index ($RLX +0.18%) barely sputtered higher. Commodity-;linked groups were mixed as the Oil Services Index ($OSX +4.53%) and Integrated Oil Index ($XOI +3.84%) both posted solid gains while the Gold & Silver Index ($XAU -0.86%) ended lower.
PICTURED: The Integrated Oil Index ($XOI +3.84%) posted a solid gain rebounding toward its August high.
| Oil Services |
$OSX |
69.61 |
+3.01 |
+4.53% |
+32.03% |
| Integrated Oil |
$XOI |
1,723.45 |
+63.72 |
+3.84% |
+46.28% |
| Semiconductor |
$SOX |
2,263.24 |
+64.64 |
+2.94% |
-42.65% |
| Networking |
$NWX |
741.29 |
+14.01 |
+1.93% |
-23.66% |
| Broker/Dealer |
$XBD |
433.51 |
+8.30 |
+1.95% |
-10.96% |
| Retail |
$RLX |
3,006.16 |
+5.48 |
+0.18% |
-28.87% |
| Gold & Silver |
$XAU |
100.96 |
-0.87 |
-0.86% |
-23.78% |
| Bank |
$BKX |
99.57 |
+4.91 |
+5.19% |
-24.69% |
| Biotech |
$BTK |
4,667.04 |
+100.88 |
+2.21% |
-15.43% |
|
|
|
 |
Featured Stocks
Kenneth J. Gruneisen - Passed the CAN SLIM® Master's Exam
|
|
|
Color Codes Explained :
Y - Better candidates highlighted by our
staff of experts.
G - Previously featured
in past reports as yellow but may no longer be buyable under the
guidelines.
***Last / Change / Volume data in this table is the closing quote data***
|
|
|
THESE ARE NOT BUY RECOMMENDATIONS!
Comments contained in the body of this report are technical
opinions only. The material herein has been obtained
from sources believed to be reliable and accurate, however,
its accuracy and completeness cannot be guaranteed.
This site is not an investment advisor, hence it does
not endorse or recommend any securities or other investments.
Any recommendation contained in this report may not
be suitable for all investors and it is not to be deemed
an offer or solicitation on our part with respect to
the purchase or sale of any securities. All trademarks,
service marks and trade names appearing in this report
are the property of their respective owners, and are
likewise used for identification purposes only.
This report is a service available
only to active Paid Premium Members.
You may opt-out of receiving report notifications
at any time. Questions or comments may be submitted
by writing to Premium Membership Services 665 S.E. 10 Street, Suite 201 Deerfield Beach, FL 33441-5634 or by calling 1-800-965-8307
or 954-785-1121.
|
|
|