You are not logged in.
This means you
CAN ONLY VIEW reports that were published prior to Sunday, April 6, 2025.
You
MUST UPGRADE YOUR MEMBERSHIP if you want to see any current reports.
AFTER MARKET UPDATE - THURSDAY, JULY 23RD, 2015
Previous After Market Report Next After Market Report >>>
|
|
|
|
DOW |
-119.12 |
17,731.92 |
-0.67% |
|
Volume |
836,970,550 |
+2% |
|
Volume |
1,846,371,800 |
-2% |
|
NASDAQ |
-25.36 |
5,146.41 |
-0.49% |
|
Advancers |
971 |
30% |
|
Advancers |
889 |
30% |
|
S&P 500 |
-12.00 |
2,102.15 |
-0.57% |
|
Decliners |
2,122 |
66% |
|
Decliners |
1,954 |
67% |
|
Russell 2000 |
-13.38 |
1,244.97 |
-1.06% |
|
52 Wk Highs |
96 |
|
|
52 Wk Highs |
106 |
|
|
S&P 600 |
-8.58 |
710.84 |
-1.19% |
|
52 Wk Lows |
318 |
|
|
52 Wk Lows |
170 |
|
|
Be sure to read the "Ken's Mailbag Q&A" article below the Featured Stock Update table in this report.
|
 |
Breadth Negative as Indices Fell Third Consecutive Session
Kenneth J. Gruneisen - Passed the CAN SLIM® Master's Exam
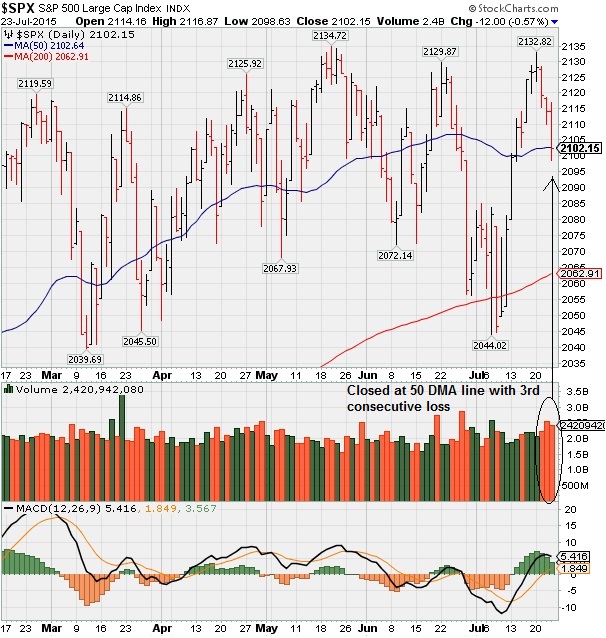
Stocks closed lower on Thursday. The Dow declined 118 points to 17731. The S&P 500 was off 12 points to 2102. The NASDAQ fell 25 points to 5146. Volume totals were reported mixed, higher than the prior session total on the NYSE and lighter on the Nasdaq exchange. Breadth was negative as decliners led advancers by more than a 2-1 margin on the NYSE and on the Nasdaq exchange. There were 66 high-ranked companies from the Leaders List that made new 52-week highs and appeared on the BreakOuts Page, near the prior session total of 67 stocks. The total number of new 52-week lows outnumbered new 52-week highs on the NYSE and on the Nasdaq exchange. There were gains for 5 of the 12 high-ranked companies currently on the Featured Stocks Page. The Nasdaq Composite Index and other major averages recently rallied to new highs or near their record highs. Coupling the indices' improvement with an expansion in leadership (stocks hitting new highs), the latest market (M criteria) action has shown investors reassuring proof that the institutional crowd has a healthy appetite for buying stocks. Disciplined investors know to buy only the strongest stocks meeting all of the key fundamental and technical criteria. New matches with the fact-based investment system's strict guidelines will be added to the Featured Stocks Page as market action dictates. PICTURED: The S&P 500 Index suffered a third consecutive loss and finished at its 50-day moving average (DMA) line. The major averages retreated as investors continue to digest second quarter
earnings. In economic news, initial jobless claims fell 26,000 to 255,000, which
is the lowest level since 1973. Another report showed that leading indicators
for June were more optimistic than analysts’ predictions. Healthcare M&A is
back on the forefront, with Cigna (CI +2.4%) rose on news that the
company is near a takeover agreement with Anthem (ANTM).
In earnings, the new General Motors Company (GM +4%) rallied after beating earnings estimates and
posting record North American sales. Qualcomm (QCOM -3.8%) fell after lowering
full year guidance. Caterpillar (CAT -3.6%) fell after missing revenue
forecasts, citing weakening Chinese demand and currency headwinds.
All ten sectors in the S&P 500 finished in the red with materials and
utilities underperforming. Freeport-McMoRan (FCX -9.4%) tumbled as mining
stocks once again weighed down materials. Exelon (EXC -4.7%) slid to pace the
utilities losses.
Treasuries were stronger across the curve with the benchmark 10-year note
advancing 15/32 to yield 2.269%.
Commodities were lower. WTI crude prices fell 1.0% to $48.69/barrel while
COMEX Gold erased early gains and closed 0.4% lower to $1092.90/ounce. The
dollar index retreated 0.5% with the greenback weakening against the euro. The Featured Stocks Page shows the most current notes with headline links which direct members into the more detailed letter-by-letter analysis including price/volume graphs annotated by our experts. See the Premium Member Homepage for archives to all prior pay reports.
|
 Kenneth J. Gruneisen started out as a licensed stockbroker in August 1987, a couple of months prior to the historic stock market crash that took the Dow Jones Industrial Average down -22.6% in a single day. He has published daily fact-based fundamental and technical analysis on high-ranked stocks online for two decades. Through FACTBASEDINVESTING.COM, Kenneth provides educational articles, news, market commentary, and other information regarding proven investment systems that work in good times and bad.
Comments contained in the body of this report are technical opinions only and are not necessarily those of Gruneisen Growth Corp. The material herein has been obtained from sources believed to be reliable and accurate, however, its accuracy and completeness cannot be guaranteed. Our firm, employees, and customers may effect transactions, including transactions contrary to any recommendation herein, or have positions in the securities mentioned herein or options with respect thereto. Any recommendation contained in this report may not be suitable for all investors and it is not to be deemed an offer or solicitation on our part with respect to the purchase or sale of any securities. |
|
 |
Semiconductor and Networking Indexes Rose; XAU Sinks
Kenneth J. Gruneisen - Passed the CAN SLIM® Master's Exam
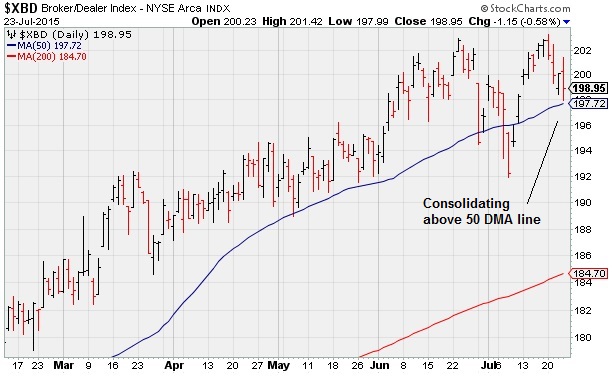
The Bank Index ($BKX -0.83%) and the Broker/Dealer Index ($XBD -0.58%) finished lower and the Retail Index ($RLX -0.63%) also had a negative influence on the major averages on Thursday. The Networking Index ($NWX +1.81%) and Semiconductor Index ($SOX +1.45%) led the tech sector higher, meanwhile the Biotechnology Index ($BTK -0.16%) edged lower. The Oil Services Index ($OSX +2.79%) posted a sold gain while the Integrated Oil Index ($XOI -0.58%) edged lower. The Gold & Silver Index ($XAU -4.74%) was a standout decliner. PICTURED: The Broker/Dealer Index ($XBD -0.58%) is consolidating above its 50-day moving average (DMA) line. Healthy action in the financial group is a reassuring "leading indicator" which bodes well for the current market rally (M criteria). Longtime readers of this commentary know that the major averages have been prone to their worst downdrafts when financial stocks are weak.
| Oil Services |
$OSX |
181.78 |
+4.94 |
+2.79% |
-13.80% |
| Integrated Oil |
$XOI |
1,225.68 |
-7.14 |
-0.58% |
-9.08% |
| Semiconductor |
$SOX |
655.51 |
+9.38 |
+1.45% |
-4.57% |
| Networking |
$NWX |
379.22 |
+6.73 |
+1.81% |
+5.95% |
| Broker/Dealer |
$XBD |
198.95 |
-1.15 |
-0.58% |
+7.75% |
| Retail |
$RLX |
1,192.17 |
-7.51 |
-0.63% |
+15.44% |
| Gold & Silver |
$XAU |
47.29 |
-2.36 |
-4.75% |
-31.24% |
| Bank |
$BKX |
79.75 |
-0.67 |
-0.83% |
+7.39% |
| Biotech |
$BTK |
4,373.01 |
-6.89 |
-0.16% |
+27.16% |
|
|
|
 |
Volume Totals Cooling While Consolidating Near Highs
Kenneth J. Gruneisen - Passed the CAN SLIM® Master's Exam
Epam Systems Inc (EPAM -$0.95 or -1.27% to $73.91) still has been stubbornly holding its ground perched near its all-time high with volume totals cooling, an indication few are headed for the exit. Its 50-day moving average (DMA) line ($71.68) defines support where a violation would trigger a technical sell signal.
Keep in mind it is due to report earnings on 08/04/15, and volume and volatility often increase near earnings news. The high-ranked Computer - Tech Services firm was last shown in this FSU section on 6/30/15 with annotated graphs under the headline, "50 DMA Line Defines Support". A big gain on 5/28/15 backed by +117% above average volume as it rallied above its pivot point triggered a new (or add-on) technical buy signal. Fundamentally it is strong, with a 95 Earnings Per Share Rating, well above the 80+ minimum guideline for buy candidates.
It reported earnings +33%, +40%, +29%, and +30% in the Jun, Sep, Dec '14 and Mar '15 quarterly comparisons versus the year ago periods, respectively. Sales revenues rose +31%, +38%, +28% and +25% during that span. Its streak of 6 consecutive quarters with earnings above the +25% guideline makes it a solid match concerning the C criteria. Annual earnings growth (A criteria) has been strong. Its Relative Strength rating of 96 is now well above the 80+ minimum guideline for buy candidates.
It completed Secondary Offerings 8/30/13 and 9/17/13. The number of top-rated funds owning its shares rose from 254 in Dec '13 to 373 Jun '15, a reassuring sign concerning the I criteria. Its small supply of only 41.1 million shares (S criteria) in the pubic float can contribute to greater volatility in the event of institutional buying or selling.
X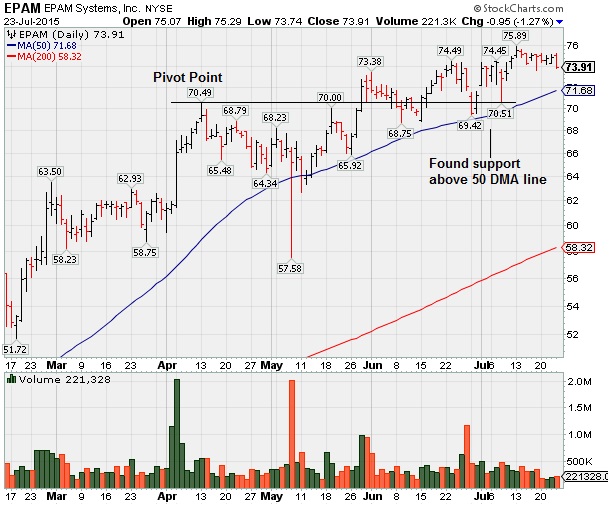 |
|
|
Color Codes Explained :
Y - Better candidates highlighted by our
staff of experts.
G - Previously featured
in past reports as yellow but may no longer be buyable under the
guidelines.
***Last / Change / Volume data in this table is the closing quote data***
Symbol/Exchange
Company Name
Industry Group |
PRICE |
CHANGE
(%Change) |
Day High |
Volume
(% DAV)
(% 50 day avg vol) |
52 Wk Hi
% From Hi |
Featured
Date |
Price
Featured |
Pivot Featured |
|
Max Buy |
GSBC
-
NASDAQ
Great Southern Bancorp
BANKING - Savings and Loans
|
$42.08
|
-0.47
-1.10% |
$42.95
|
41,655
134.37% of 50 DAV
50 DAV is 31,000
|
$42.99
-2.11%
|
4/27/2015
|
$40.94
|
PP = $40.54
|
|
MB = $42.57
|
Most Recent Note - 7/21/2015 5:47:53 PM
Y - Ended near the session low with a loss today on higher volume indicative of distributional pressure Found support recently near prior highs in the $41 area and its 50 DMA line. Damaging losses leading to violations would trigger technical sell signals.
>>> FEATURED STOCK ARTICLE : Finding Support Near Prior Highs and 50-Day Moving Average - 7/9/2015 |
View all notes |
Set NEW NOTE alert |
Company Profile |
SEC
News |
Chart |
Request a new note
C
A
S
I |
BOFI
-
NASDAQ
B O F I Holding Inc
BANKING - Savings andamp; Loans
|
$116.98
|
-1.52
-1.28% |
$119.30
|
219,982
120.21% of 50 DAV
50 DAV is 183,000
|
$119.83
-2.38%
|
6/10/2015
|
$101.47
|
PP = $97.78
|
|
MB = $102.67
|
Most Recent Note - 7/20/2015 12:05:54 PM
G - Hitting yet another new high with today's 4th consecutive gain, getting very extended from its prior base. Its 50 DMA line ($100.94) and prior highs near $97 define important support to watch on pullbacks.
>>> FEATURED STOCK ARTICLE : Hitting New Highs and Getting More Extended From a Sound Base - 7/10/2015 |
View all notes |
Set NEW NOTE alert |
Company Profile |
SEC
News |
Chart |
Request a new note
C
A
S
I |
EPAM
-
NYSE
Epam Systems Inc
COMPUTER SOFTWARE and SERVICES - Information Technology Service
|
$73.91
|
-0.95
-1.27% |
$75.29
|
221,328
57.19% of 50 DAV
50 DAV is 387,000
|
$75.89
-2.61%
|
5/18/2015
|
$67.42
|
PP = $70.59
|
|
MB = $74.12
|
 Most Recent Note - 7/23/2015 6:32:03 PM
Y - Still stubbornly holding its ground perched near its all-time high with volume totals cooling, an indication few are headed for the exit. Its 50 DMA line defines support where a violation would trigger a technical sell signal. Due to report earnings on 08/04/15, and volume and volatility often increase near earnings news. See the latest FSU analysis for more details and new annotated graph.
>>> FEATURED STOCK ARTICLE : Volume Totals Cooling While Consolidating Near Highs - 7/23/2015 |
View all notes |
Set NEW NOTE alert |
Company Profile |
SEC
News |
Chart |
Request a new note
C
A
S
I |
ILMN
-
NASDAQ
Illumina Inc
DRUGS - Biotechnology
|
$219.94
|
+2.45
1.13% |
$220.19
|
2,946,781
211.85% of 50 DAV
50 DAV is 1,391,000
|
$242.37
-9.25%
|
6/8/2015
|
$209.97
|
PP = $213.43
|
|
MB = $224.10
|
Most Recent Note - 7/23/2015 6:37:56 PM
Y - Reported earnings +40% on +21% sales revenues for the Jun '15 quarter. Color code is changed to yellow after finding support near its 50 DMA line ($215) and prior highs in the $213 area.
>>> FEATURED STOCK ARTICLE : Still Above Near-Term Support After Pullback on Higher Volume - 7/8/2015 |
View all notes |
Set NEW NOTE alert |
Company Profile |
SEC
News |
Chart |
Request a new note
C
A
S
I |
VRX
-
NYSE
Valeant Pharmaceuticals
DRUGS - Drug Manufacturers - Other
|
$253.84
|
+14.92
6.24% |
$254.46
|
3,760,650
241.53% of 50 DAV
50 DAV is 1,557,000
|
$246.01
3.18%
|
7/14/2015
|
$236.75
|
PP = $246.11
|
|
MB = $258.42
|
Most Recent Note - 7/23/2015 1:11:17 PM
Y - Reported earnings +34% on +34% sales revenues for the Jun '15 quarter. Volume and volatility often increase near earnings news. It gapped up above the pivot point and hit a new 52-week high with above average volume behind its gain triggering a new (or add-on) technical buy signal. The 50 DMA line ($231) and recent low ($219.56 on 6/29/15) define near-term support levels to watch.
>>> FEATURED STOCK ARTICLE : New Base Has Formed and Earnings News is Due Soon - 7/14/2015 |
View all notes |
Set NEW NOTE alert |
Company Profile |
SEC
News |
Chart |
Request a new note
C
A
S
I |
Symbol/Exchange
Company Name
Industry Group |
PRICE |
CHANGE
(%Change) |
Day High |
Volume
(% DAV)
(% 50 day avg vol) |
52 Wk Hi
% From Hi |
Featured
Date |
Price
Featured |
Pivot Featured |
|
Max Buy |
AMBA
-
NASDAQ
Ambarella Inc
ELECTRONICS - Semiconductor - Specialized
|
$122.99
|
+0.49
0.40% |
$129.19
|
5,366,963
132.35% of 50 DAV
50 DAV is 4,055,000
|
$128.06
-3.96%
|
5/1/2015
|
$75.99
|
PP = $77.49
|
|
MB = $81.36
|
Most Recent Note - 7/22/2015 4:03:26 PM
G - Rallied to its second-best close ever with today's 5th consecutive gain. The 50 DMA line and recent low ($93.06 on 6/22/15) define near-term support where violations would trigger technical sell signals.
>>> FEATURED STOCK ARTICLE : Found Support Above 50-Day Moving Average After Sharp Pullback - 7/17/2015 |
View all notes |
Set NEW NOTE alert |
Company Profile |
SEC
News |
Chart |
Request a new note
C
A
S
I |
ACHC
-
NASDAQ
Acadia Healthcare Inc
HEALTH SERVICES - Specialized Health Services
|
$79.70
|
-0.02
-0.03% |
$80.35
|
313,757
41.39% of 50 DAV
50 DAV is 758,000
|
$81.76
-2.52%
|
5/27/2015
|
$73.90
|
PP = $74.19
|
|
MB = $77.90
|
Most Recent Note - 7/22/2015 4:05:01 PM
G - Pulled back today for a 4th consecutive small loss. Still holding its ground above its "max buy" level with volume-totals cooling, an indication few are headed for the exit. Prior highs in the $74-75 area define near-term support to watch above its 50 DMA line ($75.15).
>>> FEATURED STOCK ARTICLE : Extended From Prior Base and Perched at High - 7/15/2015 |
View all notes |
Set NEW NOTE alert |
Company Profile |
SEC
News |
Chart |
Request a new note
C
A
S
I |
APOG
-
NASDAQ
Apogee Enterprises
MATERIALS and CONSTRUCTION - General Building Materials
|
$55.37
|
-1.44
-2.53% |
$57.00
|
236,790
74.70% of 50 DAV
50 DAV is 317,000
|
$61.05
-9.30%
|
4/9/2015
|
$49.58
|
PP = $48.13
|
|
MB = $50.54
|
Most Recent Note - 7/22/2015 4:01:02 PM
Y - Color code is changed to yellow after rebounding above its 50 DMA line with today's volume-driven gain helping its outlook improve. Damaging losses below recent low ($50.07 on 7/07/15) would raise greater concerns.
>>> FEATURED STOCK ARTICLE : Sputtering After Damaging 50-Day Moving Average Violation - 7/13/2015 |
View all notes |
Set NEW NOTE alert |
Company Profile |
SEC
News |
Chart |
Request a new note
C
A
S
I |
JLL
-
NYSE
Jones Lang Lasalle Inc
REAL ESTATE - Property Management/Developmen
|
$172.05
|
-1.70
-0.98% |
$175.38
|
218,630
63.01% of 50 DAV
50 DAV is 347,000
|
$177.11
-2.86%
|
6/4/2015
|
$172.34
|
PP = $174.93
|
|
MB = $183.68
|
Most Recent Note - 7/22/2015 6:32:26 PM
Y - Above support at its 50 DMA line. Recent gains above the pivot point lacked the minimum +40% above average volume necessary to trigger a new (or add-on) technical buy signal. See the latest FSU analysis for additional details and a new annotated graph.
>>> FEATURED STOCK ARTICLE : Recent Gains Lacked Volume Conviction; Earnings Report Soon Expected - 7/22/2015 |
View all notes |
Set NEW NOTE alert |
Company Profile |
SEC
News |
Chart |
Request a new note
C
A
S
I |
ULTA
-
NASDAQ
Ulta Salon Cosm & Frag
SPECIALTY RETAIL - Specialty Retail, Other
|
$169.22
|
-1.30
-0.76% |
$171.21
|
601,527
73.00% of 50 DAV
50 DAV is 824,000
|
$170.75
-0.90%
|
5/29/2015
|
$155.03
|
PP = $159.95
|
|
MB = $167.95
|
Most Recent Note - 7/20/2015 5:54:47 PM
G - Color code is changed to green while perched near its "max buy" level after recent gains lacking volume conviction. Prior highs near $159 define initial support to watch on pullbacks. See the latest FSU analysis for more details and a new annotated graph.
>>> FEATURED STOCK ARTICLE : Near "Max Buy" Level, But Recent Gains Lacked Great Volume Conviction - 7/20/2015 |
View all notes |
Set NEW NOTE alert |
Company Profile |
SEC
News |
Chart |
Request a new note
C
A
S
I |
Symbol/Exchange
Company Name
Industry Group |
PRICE |
CHANGE
(%Change) |
Day High |
Volume
(% DAV)
(% 50 day avg vol) |
52 Wk Hi
% From Hi |
Featured
Date |
Price
Featured |
Pivot Featured |
|
Max Buy |
LXFT
-
NYSE
Luxoft Holding Inc Cl A
Comp Sftwr-Spec Enterprs
|
$63.33
|
+1.33
2.15% |
$63.56
|
399,569
161.77% of 50 DAV
50 DAV is 247,000
|
$63.00
0.52%
|
5/26/2015
|
$51.90
|
PP = $57.40
|
|
MB = $60.27
|
Most Recent Note - 7/23/2015 6:39:32 PM
G - Posted a volume-driven gain for a new all-time high. Prior highs define near-term support above its 50 DMA line. Subsequent violations would trigger technical sell signals.
>>> FEATURED STOCK ARTICLE : Extended From Base After Wedging Higher - 7/16/2015 |
View all notes |
Set NEW NOTE alert |
Company Profile |
SEC
News |
Chart |
Request a new note
C
A
S
I |
PANW
-
NYSE
Palo Alto Networks
Computer Sftwr-Security
|
$197.09
|
+4.69
2.44% |
$200.10
|
1,431,483
97.51% of 50 DAV
50 DAV is 1,468,000
|
$193.78
1.71%
|
3/27/2015
|
$146.44
|
PP = $149.45
|
|
MB = $156.92
|
Most Recent Note - 7/23/2015 6:34:35 PM
G - Hit a new all-time high with today's 11th gain in the span of 12 sessions. Extended from any sound base. Recent lows and its 50 DMA line define the nearest chart support to watch.
>>> FEATURED STOCK ARTICLE : Wedging to New Highs After Brief Consolidation - 7/21/2015 |
View all notes |
Set NEW NOTE alert |
Company Profile |
SEC
News |
Chart |
Request a new note
C
A
S
I |
|
 |
| Subscriber Question: | July 22, 2015 |
Dear Ken, What are guidelines for buying a stock on a gap-down pullback to the 50 DMA line on large volume? Is this a good day to buy ILMN? Thank you, Dave |
| Ken's Response: | July 22, 2015 |
Dear Dave: The historic studies and many examples we have seen suggested that investors have much better odds when buying stocks on the rise right as they are breaking out of sound bases, not buying stocks when they are pulling back on heavy volume. That is because when they break out they tend to continue higher, and when they pull back they tend to keep on pulling back. They also teach in the Masters Class that when a stock has its largest loss on the highest volume anywhere on the graph, that action is considered a technical sell signal. That said, I am looking at ILMN with respect to your question about buying and inclined to say, "No". However, there is something to be said if you have a large profit cushion on a stock to where you can choose to ride out a deep consolidation. If that is the case, some investors might hold on unless they start to see multiple technical sell signals occurring. Now lets add more complexity to the answer by discussing what are considered valid "Secondary Buy Points". Under the fact-based investment system, if an earlier technical breakout from a valid base was missed, they teach in the Masters Class that a stock may be bought following its first successful pullback and test of the 10-week moving average (WMA) - which is similar to the 50-day average, but computed weekly the actual "average" is a slightly different number. It may be bought from that point up to +5% above the latest highs. Always follow the loss limiting sell rules if any position falls more than -7% from your purchase price. You cannot even consider a test of the 10 WMA line "successful" without seeing at least one good up day, preferably a solid gain with higher and above average volume. A little more damage in ILMN may mean the pullback would not be considered a successful test of the 10 WMA line, it may become a more worrisome violation. By comparison, AMBA bounced back with heavy volume immediately following an abrupt pullback 6/22/15, and it took weeks get any traction after that. The ILMN action may speak more clearly to us in the days ahead. Meanwhile, I'd keep an eye out for fresh breakouts if any new ones show up. We wish you the utmost success with the fact-based investment system we support. Best regards, Kenneth J. Gruneisen
|
|
|
|
THESE ARE NOT BUY RECOMMENDATIONS!
Comments contained in the body of this report are technical
opinions only. The material herein has been obtained
from sources believed to be reliable and accurate, however,
its accuracy and completeness cannot be guaranteed.
This site is not an investment advisor, hence it does
not endorse or recommend any securities or other investments.
Any recommendation contained in this report may not
be suitable for all investors and it is not to be deemed
an offer or solicitation on our part with respect to
the purchase or sale of any securities. All trademarks,
service marks and trade names appearing in this report
are the property of their respective owners, and are
likewise used for identification purposes only.
This report is a service available
only to active Paid Premium Members.
You may opt-out of receiving report notifications
at any time. Questions or comments may be submitted
by writing to Premium Membership Services 665 S.E. 10 Street, Suite 201 Deerfield Beach, FL 33441-5634 or by calling 1-800-965-8307
or 954-785-1121.
|
|
|