You are not logged in.
This means you
CAN ONLY VIEW reports that were published prior to Thursday, April 3, 2025.
You
MUST UPGRADE YOUR MEMBERSHIP if you want to see any current reports.
AFTER MARKET UPDATE - WEDNESDAY, JUNE 24TH, 2020
Previous After Market Report Next After Market Report >>>
|
|
|
|
DOW |
-710.16 |
25,445.94 |
-2.72% |
|
Volume |
1,104,332,479 |
+9% |
|
Volume |
5,537,396,600 |
-2% |
|
NASDAQ |
-222.20 |
9,909.17 |
-2.19% |
|
Advancers |
343 |
12% |
|
Advancers |
610 |
18% |
|
S&P 500 |
-80.96 |
3,050.33 |
-2.59% |
|
Decliners |
2,558 |
88% |
|
Decliners |
2,745 |
82% |
|
Russell 2000 |
-49.60 |
1,389.74 |
-3.45% |
|
52 Wk Highs |
15 |
|
|
52 Wk Highs |
54 |
|
|
S&P 600 |
-29.83 |
798.27 |
-3.60% |
|
52 Wk Lows |
12 |
|
|
52 Wk Lows |
12 |
|
|
 |
Leadership Waned as Major Indices Slumped for Big Losses
Kenneth J. Gruneisen - Passed the CAN SLIM® Master's Exam
The Dow lost 710 points for its largest decline in two weeks. The S&P 500 dropped 2.6%, while the Nasdaq Composite slipped 2.2%, breaking its longest winning streak since December. Decliners led advancers by a 7-1 margin on the NYSE and by more than 4-1 on the Nasdaq exchange. The reported volume totals were mixed, higher than the prior session on the NYSE and slightly lower on the Nasdaq exchange. There were 12 high-ranked companies from the Leaders List that hit new 52-week highs and were listed on the BreakOuts Page, down abruptly from the total of 69 on the prior session. New 52-week highs totals still outnumbered new 52-week lows totals on both exchanges. The major indices remain in a confirmed uptrend (M criteria). Any sustainable rally requires a healthy crop of new leaders, so it will be important to see the new highs totals improve.Charts used courtesy of www.stockcharts.com
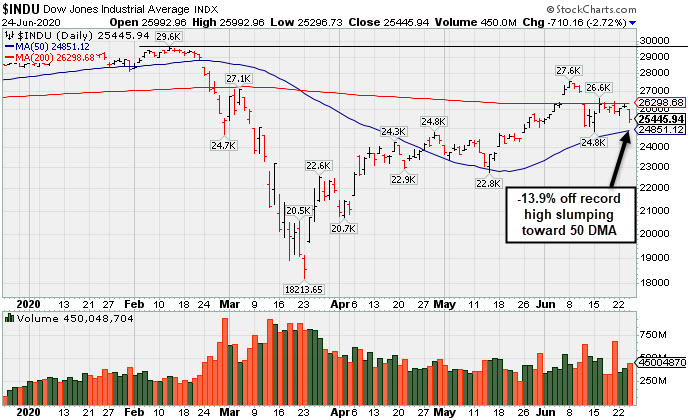
PICTURED: The Dow Jones Industrial Average is consolidating -13.9% off its record high, slumping toward its 50-day moving average (DMA) line.
Stocks finished firmly lower Wednesday, as a resurgence of coronavirus cases in several states raised concerns that government officials could re-impose restrictions on economies beginning to reopen. Florida and California both reported a record increase in daily new infections, while Texas warned of limited ICU beds. Additionally, reemerging trade tensions between the U.S. and Europe weighed on investor sentiment. The Trump Administration is reportedly considering new tariffs on $3.1 billion worth of European exports.
On the data front, MBA mortgage applications dipped 8.7% in the week ending June 19. A separate update from FHFA showed housing prices rose 0.2% month-over-month in April, just below consensus estimates for a 0.3% uptick. Treasuries strengthened, with the yield on the 10-year note off three basis point to 0.68%.
All 11 S&P 500 sectors ended the day in negative territory. Energy stocks led the declines, with WTI crude losing 6.1% amid building inventories. In corporate news, Dell Technologies (DELL +8.35%) rose after The Wall Street Journal reported the company may be looking to spin off its $50 billion stake in VMware (VMW +2.35%). Shares of companies that stand to benefit from easing lockdown measures faltered with Airlines, Cruise Lines, and Casinos all declining. Elsewhere, Disney (DIS -3.88%) fell following a petition from Florida theme park workers to delay reopening Disney World amid an uptick in COVID-19 cases.
|
 Kenneth J. Gruneisen started out as a licensed stockbroker in August 1987, a couple of months prior to the historic stock market crash that took the Dow Jones Industrial Average down -22.6% in a single day. He has published daily fact-based fundamental and technical analysis on high-ranked stocks online for two decades. Through FACTBASEDINVESTING.COM, Kenneth provides educational articles, news, market commentary, and other information regarding proven investment systems that work in good times and bad.
Comments contained in the body of this report are technical opinions only and are not necessarily those of Gruneisen Growth Corp. The material herein has been obtained from sources believed to be reliable and accurate, however, its accuracy and completeness cannot be guaranteed. Our firm, employees, and customers may effect transactions, including transactions contrary to any recommendation herein, or have positions in the securities mentioned herein or options with respect thereto. Any recommendation contained in this report may not be suitable for all investors and it is not to be deemed an offer or solicitation on our part with respect to the purchase or sale of any securities. |
|
 |
Energy, Financial, and Tech Groups Led Widespread Losses
Kenneth J. Gruneisen - Passed the CAN SLIM® Master's Exam
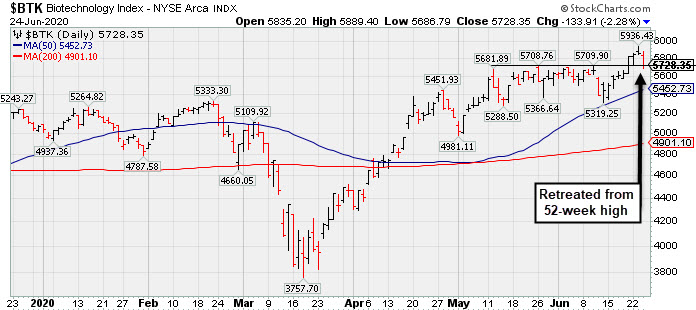
Energy-linked groups were standout decliners as the Integrated Oil Index ($XOI -5.84%) and the Oil Services Index ($OSX -7.93%) both fell sharply. Weakness in financials weighed on the major indices considerably as the Broker/Dealer Index ($XBD -3.24%) and the Bank Index ($BKX -4.814%) both suffered large losses. The Retail Index ($RLX -1.57%) suffered a smaller loss. The tech sector had a negative bias as the Biotech Index ($BTK -2.28%), Semiconductor Index ($SOX -2.19%), and Networking Index ($NWX -2.92%) each lost ground. The Gold & Silver Index ($XAU -2.15%) also fell.
PICTURED: The Biotech Index ($BTK -2.28%) retreated from its 52-week high. During its prior consolidation it recently found support at its 50-day moving average (DMA) line.
| Oil Services |
$OSX |
32.05 |
-2.76 |
-7.93% |
-59.06% |
| Integrated Oil |
$XOI |
772.60 |
-47.94 |
-5.84% |
-39.19% |
| Semiconductor |
$SOX |
1,944.30 |
-43.43 |
-2.18% |
+5.12% |
| Networking |
$NWX |
535.27 |
-16.13 |
-2.92% |
-8.25% |
| Broker/Dealer |
$XBD |
265.43 |
-8.88 |
-3.24% |
-8.59% |
| Retail |
$RLX |
2,967.06 |
-47.25 |
-1.57% |
+21.14% |
| Gold & Silver |
$XAU |
121.06 |
-2.66 |
-2.15% |
+13.22% |
| Bank |
$BKX |
74.43 |
-3.77 |
-4.82% |
-34.34% |
| Biotech |
$BTK |
5,728.35 |
-133.91 |
-2.28% |
+13.04% |
|
|
|
 |
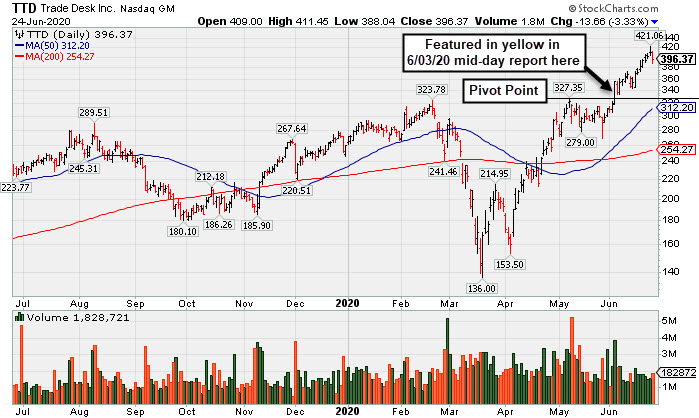
Pullback Breaks Streak of 8 Straight Gains Into New High Ground
Kenneth J. Gruneisen - Passed the CAN SLIM® Master's Exam
The Trade Desk Inc Cl A (TTD -$13.66 or -3.33% to $396.37) pulled back from its all time high today with below average volume behind a loss breaking a streak of 8 consecutive gains. It is very extended from any sound base. Prior highs in the $327 area define important near-term support above its 50-day moving average ($312).
TTD was highlighted in yellow with new pivot point cited based on its 5/07/20 high in the 6/03/20 mid-day report (read here). It hit a new all-time high with a big gain following a deep pullback and a 3-week handle-like consolidation. The big gain and strong close above the pivot point was backed by +73% above average volume triggering a convincing technical buy signal. The Comml Svcs-Advertising firm was last shown in this FSU section on 6/03/20 with an annotated graph under the headline, "Trade Desk Posts Powerful Gain for New High".
Fundamentals remain strong after it reported Mar '20 quarterly earnings +84% on +33% sales revenues, and 6 of the past 7 quarterly comparisons were above the +25% minimum earnings guideline (C criteria). Its annual earnings (A criteria) history has been strong, and it has a highest possible 99 Earnings Per Share Rating.
The number of top-rated funds owning its shares rose from 280 in Mar '18 to 592 in Mar '20, a reassuring sign concerning the I criteria. Its current Up/Down Volume Ratio of 1.9 is an unbiased indication its shares have been under accumulation over the past 50 days. It has a Timeliness Rating of A and a Sponsorship Rating of B. There are only 46.1 million shares outstanding (S criteria) which can contribute to greater volatility in the event of institutional buying or selling.
Charts courtesy of www.stockcharts.com
 |
|
|
Color Codes Explained :
Y - Better candidates highlighted by our
staff of experts.
G - Previously featured
in past reports as yellow but may no longer be buyable under the
guidelines.
***Last / Change / Volume data in this table is the closing quote data***
Symbol/Exchange
Company Name
Industry Group |
PRICE |
CHANGE
(%Change) |
Day High |
Volume
(% DAV)
(% 50 day avg vol) |
52 Wk Hi
% From Hi |
Featured
Date |
Price
Featured |
Pivot Featured |
|
Max Buy |
 FTNT
-
NASDAQ
FTNT
-
NASDAQ
Fortinet Inc
Computer Sftwr-Security
|
$134.33
|
-2.74
-2.00% |
$140.82
|
1,937,554
109.84% of 50 DAV
50 DAV is 1,764,000
|
$149.69
-10.26%
|
6/22/2020
|
$142.68
|
PP = $149.79
|
|
MB = $157.28
|
Most Recent Note - 6/23/2020 5:15:36 PM
Y - Pulled back today for a big loss on near average volume following 3 consecutive gains marked by higher volume. Subsequent gains above the pivot point backed by at least +40% above average volume are needed to trigger a new (or add-on) technical buy signal. The prior low ($126.88 on 6/15/20) and its 50 DMA line ($128) define important near-term support to watch on pullbacks.
>>> FEATURED STOCK ARTICLE : Managed a "Positive Reversal" After Brief Dip Below "Max Buy" Level - 6/15/2020 |
View all notes |
Set NEW NOTE alert |
Company Profile |
SEC
News |
Chart |
Request a new note
C
A
S
I |
EBS
-
NYSE
Emergent Biosolutions
DRUGS - Biotechnology
|
$73.15
|
-1.20
-1.61% |
$75.47
|
586,841
92.71% of 50 DAV
50 DAV is 633,000
|
$93.58
-21.83%
|
6/1/2020
|
$72.10
|
PP = $90.10
|
|
MB = $94.61
|
 Most Recent Note - 6/24/2020 6:38:02 PM
G - Holding its ground stubbornly in recent weeks. Subsequent gains above the 50 DMA line ($76.98) are still needed to help its outlook improve. Any damaging losses below the recent low ($66.69) may trigger a more worrisome technical sell signal. Fundamentals remain strong.
>>> FEATURED STOCK ARTICLE : Still Below 50-Day Moving Average Following Damaging Gap Down - 6/16/2020 |
View all notes |
Set NEW NOTE alert |
Company Profile |
SEC
News |
Chart |
Request a new note
C
A
S
I |
NBIX
-
NASDAQ
Neurocrine Biosciences
DRUGS - Biotechnology
|
$125.36
|
-2.31
-1.81% |
$129.16
|
501,247
58.49% of 50 DAV
50 DAV is 857,000
|
$131.00
-4.31%
|
5/19/2020
|
$123.71
|
PP = $119.75
|
|
MB = $125.74
|
Most Recent Note - 6/24/2020 6:36:01 PM
Y - Color code is changed to yellow after pulling back today with light volume and closing below its "max buy" level. More damaging losses would raise concerns. Prior highs in the $119 area define important near-term support to watch. Fundamentals remain strong.
>>> FEATURED STOCK ARTICLE : Pullback Into Prior Base Negated Recent Breakout - 6/8/2020 |
View all notes |
Set NEW NOTE alert |
Company Profile |
SEC
News |
Chart |
Request a new note
C
A
S
I |
BMRN
-
NASDAQ
Biomarin Pharmaceutical
DRUGS - Drug Manufacturers - Other
|
$120.63
|
-1.09
-0.90% |
$122.64
|
1,508,650
90.56% of 50 DAV
50 DAV is 1,666,000
|
$124.95
-3.46%
|
6/17/2020
|
$110.95
|
PP = $112.67
|
|
MB = $118.30
|
Most Recent Note - 6/24/2020 6:42:52 PM
G -Stubbornly holding its ground with volume totals cooling after volume-driven gains for new highs last week clinched a technical buy signal. Reported strong results for the Mar '20 quarter and recent comparisons showed improved earnings increases. Annual earnings (A criteria) history has been strong. Prior high ($112.57) defines initial support to watch on pullbacks.
>>> FEATURED STOCK ARTICLE : Hit New 52-Week High But Closed Below Pivot After 3-Weeks Tight - 6/17/2020 |
View all notes |
Set NEW NOTE alert |
Company Profile |
SEC
News |
Chart |
Request a new note
C
A
S
I |
AMD
-
NASDAQ
Advanced Micro Devices
ELECTRONICS - Semiconductor - Broad Line
|
$52.39
|
-1.60
-2.96% |
$54.74
|
53,409,020
84.09% of 50 DAV
50 DAV is 63,516,000
|
$59.27
-11.61%
|
6/9/2020
|
$55.41
|
PP = $56.98
|
|
MB = $59.83
|
Most Recent Note - 6/24/2020 6:41:05 PM
G - Color code is changed to green after a loss today with light volume violated its 50 DMA line ($54.13). A prompt rebound above the 50 DMA line is needed for its outlook to improve The prior low ($49.09 on 5/27/20) defines the next important support to watch. Met stubborn resistance in the $57-59 area. Subsequent gains into new high territory may mark the beginning of a substantial leg higher. Fundamentals remain strong.
>>> FEATURED STOCK ARTICLE : Big Chip Firm Showing Strong Sales Revenues and Earnings Increases - 6/9/2020 |
View all notes |
Set NEW NOTE alert |
Company Profile |
SEC
News |
Chart |
Request a new note
C
A
S
I |
Symbol/Exchange
Company Name
Industry Group |
PRICE |
CHANGE
(%Change) |
Day High |
Volume
(% DAV)
(% 50 day avg vol) |
52 Wk Hi
% From Hi |
Featured
Date |
Price
Featured |
Pivot Featured |
|
Max Buy |
TREX
-
NYSE
Trex Company Inc
MATERIALS and CONSTRUCTION - General Building Materials
|
$122.69
|
-1.56
-1.26% |
$124.27
|
856,139
90.98% of 50 DAV
50 DAV is 941,000
|
$132.84
-7.64%
|
5/5/2020
|
$109.05
|
PP = $111.95
|
|
MB = $117.55
|
Most Recent Note - 6/24/2020 6:44:21 PM
G - Still consolidating above its "max buy" level. Prior highs in the $111 area define important support nearly coinciding with its 50 DMA line ($110.37). Fundamentals remain strong.
>>> FEATURED STOCK ARTICLE : Pullback Toward Prior Highs Which Define Near-Term Support - 6/11/2020 |
View all notes |
Set NEW NOTE alert |
Company Profile |
SEC
News |
Chart |
Request a new note
C
A
S
I |
NFLX
-
NASDAQ
Netflix Inc
SPECIALTY RETAIL - Music and Video Stores
|
$457.85
|
-8.41
-1.80% |
$472.36
|
4,808,259
60.86% of 50 DAV
50 DAV is 7,900,000
|
$474.01
-3.41%
|
5/14/2020
|
$441.95
|
PP = $449.62
|
|
MB = $472.10
|
Most Recent Note - 6/22/2020 3:45:33 PM
Y - Hitting a new all-time high with today's 6th consecutive gain backed by below average volume. Found support near its 50 DMA line ($429.74) recently. Gains above a stock's pivot point must have at least +40% above average volume to trigger a proper new (or add-on) technical buy signal. Any damaging losses below the 50 DMA line and prior lows would trigger a more worrisome technical sell signal.
>>> FEATURED STOCK ARTICLE : Weak Action Led to 50-Day Moving Average Violation - 6/12/2020 |
View all notes |
Set NEW NOTE alert |
Company Profile |
SEC
News |
Chart |
Request a new note
C
A
S
I |
CHGG
-
NYSE
Chegg Inc
Consumer Svcs-Education
|
$64.15
|
-2.57
-3.85% |
$67.28
|
3,532,787
85.71% of 50 DAV
50 DAV is 4,122,000
|
$70.57
-9.10%
|
6/17/2020
|
$63.71
|
PP = $68.08
|
|
MB = $71.48
|
Most Recent Note - 6/24/2020 6:28:07 PM
Y - Slumped further below its pivot point with a loss today on lighter than average volume raising some concerns. Disciplined investors may note that the recent gain above the pivot point was not backed by the at least +40% above average volume necessary to trigger a convincing technical buy signal.
>>> FEATURED STOCK ARTICLE : Formed a Flat Base Perched Within Striking Distance of 52-Week High - 6/18/2020 |
View all notes |
Set NEW NOTE alert |
Company Profile |
SEC
News |
Chart |
Request a new note
C
A
S
I |
NOW
-
NYSE
Servicenow Inc
Computer Sftwr-Enterprse
|
$392.93
|
-8.01
-2.00% |
$405.24
|
1,448,507
69.41% of 50 DAV
50 DAV is 2,087,000
|
$409.80
-4.12%
|
4/30/2020
|
$343.05
|
PP = $363.05
|
|
MB = $381.20
|
Most Recent Note - 6/22/2020 3:40:15 PM
G - Volume totals have generally been cooling while hovering in a tight trading range perched near its all-time high. Recent gains above the pivot point were not backed by the +40% above average volume necessary to clinch a proper technical buy signal. Prior highs in the $362 area define initial support to watch above its 50 DMA line ($359.61).
>>> FEATURED STOCK ARTICLE : Quiet Pullback Below "Max Buy" Level for NOW - 6/4/2020 |
View all notes |
Set NEW NOTE alert |
Company Profile |
SEC
News |
Chart |
Request a new note
C
A
S
I |
TEAM
-
NASDAQ
Atlassian Corp Plc Cl A
Comp Sftwr-Spec Enterprs
|
$176.82
|
-5.51
-3.02% |
$184.49
|
1,295,062
67.00% of 50 DAV
50 DAV is 1,933,000
|
$191.72
-7.77%
|
5/4/2020
|
$159.70
|
PP = $156.22
|
|
MB = $164.03
|
Most Recent Note - 6/24/2020 6:32:33 PM
G - Volume was light behind today's loss, consolidating well above its "max buy" level. Near term support is defined by its 50 DMA line ($170.51). The next important near-term support is the prior low ($163.72 on 6/05/20).
>>> FEATURED STOCK ARTICLE : Positive Reversal Near Prior High and 50 DMA Line - 6/5/2020 |
View all notes |
Set NEW NOTE alert |
Company Profile |
SEC
News |
Chart |
Request a new note
C
A
S
I |
Symbol/Exchange
Company Name
Industry Group |
PRICE |
CHANGE
(%Change) |
Day High |
Volume
(% DAV)
(% 50 day avg vol) |
52 Wk Hi
% From Hi |
Featured
Date |
Price
Featured |
Pivot Featured |
|
Max Buy |
TTD
-
NASDAQ
The Trade Desk Inc Cl A
Comml Svcs-Advertising
|
$396.37
|
-13.66
-3.33% |
$411.45
|
1,828,260
85.79% of 50 DAV
50 DAV is 2,131,000
|
$421.06
-5.86%
|
6/3/2020
|
$240.61
|
PP = $327.35
|
|
MB = $343.72
|
Most Recent Note - 6/24/2020 6:25:26 PM
G - Pulled back from its 52-week high with below average volume behind a loss today, breaking a streak of 8 consecutive gains. Very extended from any sound base. Prior highs in the $327 area define important near-term support. See the latest FSU analysis for more details and a new annotated graph.
>>> FEATURED STOCK ARTICLE : Pullback Breaks Streak of 8 Straight Gains Into New High Ground - 6/24/2020 |
View all notes |
Set NEW NOTE alert |
Company Profile |
SEC
News |
Chart |
Request a new note
C
A
S
I |
DOCU
-
NASDAQ
Docusign Inc
Computer Sftwr-Enterprse
|
$163.91
|
-2.89
-1.73% |
$172.21
|
5,525,885
124.26% of 50 DAV
50 DAV is 4,447,000
|
$171.20
-4.26%
|
6/10/2020
|
$149.73
|
PP = $152.10
|
|
MB = $159.71
|
Most Recent Note - 6/24/2020 12:25:01 PM
G - Pulling back after getting extended from the recently noted new base. Prior high ($152 on 6/02/20) defines initial support to watch well above its 50 DMA line ($129).
>>> FEATURED STOCK ARTICLE : Advanced Ascending Base Formed for Strong E-Signature Firm - 6/10/2020 |
View all notes |
Set NEW NOTE alert |
Company Profile |
SEC
News |
Chart |
Request a new note
C
A
S
I |
PING
-
NYSE
Ping Identity Hldg Corp
Computer Sftwr-Security
|
$31.70
|
-1.57
-4.72% |
$33.25
|
1,426,215
107.23% of 50 DAV
50 DAV is 1,330,000
|
$35.36
-10.35%
|
6/1/2020
|
$29.24
|
PP = $29.90
|
|
MB = $31.40
|
Most Recent Note - 6/24/2020 6:30:18 PM
G - Consolidating just above its "max buy" level. Prior highs in the $29 area define initial support to watch.
>>> FEATURED STOCK ARTICLE : Gain for Recent New High Backed by +71% Above Average Volume - 6/22/2020 |
View all notes |
Set NEW NOTE alert |
Company Profile |
SEC
News |
Chart |
Request a new note
C
A
S
I |
AAXN
-
NASDAQ
Axon Enterprise Inc
Security/Sfty
|
$93.43
|
-2.11
-2.21% |
$97.16
|
1,396,731
118.07% of 50 DAV
50 DAV is 1,183,000
|
$104.90
-10.93%
|
5/8/2020
|
$84.86
|
PP = $90.20
|
|
MB = $94.71
|
Most Recent Note - 6/23/2020 12:43:49 PM
G - Color code is changed to green after rebounding above its "max buy" level with today's big volume-driven gain. Completed a new Public Offering on 6/17/20. Prior highs in the $90-91 area have acted as support following a powerful breakout. More damaging losses would raise concerns and trigger a technical sell signal.
>>> FEATURED STOCK ARTICLE : Completed New Pubic Offering and Found Support Near Prior High - 6/19/2020 |
View all notes |
Set NEW NOTE alert |
Company Profile |
SEC
News |
Chart |
Request a new note
C
A
S
I |
GDDY
-
NYSE
Godaddy Inc Cl A
Computer Sftwr-Enterprse
|
$75.59
|
-7.12
-8.61% |
$83.01
|
3,372,474
245.99% of 50 DAV
50 DAV is 1,371,000
|
$84.49
-10.53%
|
6/2/2020
|
$79.62
|
PP = $82.40
|
|
MB = $86.52
|
Most Recent Note - 6/24/2020 12:30:35 PM
Y - Abruptly retreating today following 8 consecutive gains. On the prior session it hit a new 52-week high but finished near the session low. Subsequent gains above the pivot point backed by at least +40% above average volume are needed to clinch a convincing technical buy signal. It previously met stubborn resistance in the $82-84 area. See the latest FSU analysis for more details and an annotated graph.
>>> FEATURED STOCK ARTICLE : Hit a New 52-Week High With Today's 8th Consecutive Gain - 6/23/2020 |
View all notes |
Set NEW NOTE alert |
Company Profile |
SEC
News |
Chart |
Request a new note
C
A
S
I |
Symbol/Exchange
Company Name
Industry Group |
PRICE |
CHANGE
(%Change) |
Day High |
Volume
(% DAV)
(% 50 day avg vol) |
52 Wk Hi
% From Hi |
Featured
Date |
Price
Featured |
Pivot Featured |
|
Max Buy |
|
|
|
THESE ARE NOT BUY RECOMMENDATIONS!
Comments contained in the body of this report are technical
opinions only. The material herein has been obtained
from sources believed to be reliable and accurate, however,
its accuracy and completeness cannot be guaranteed.
This site is not an investment advisor, hence it does
not endorse or recommend any securities or other investments.
Any recommendation contained in this report may not
be suitable for all investors and it is not to be deemed
an offer or solicitation on our part with respect to
the purchase or sale of any securities. All trademarks,
service marks and trade names appearing in this report
are the property of their respective owners, and are
likewise used for identification purposes only.
This report is a service available
only to active Paid Premium Members.
You may opt-out of receiving report notifications
at any time. Questions or comments may be submitted
by writing to Premium Membership Services 665 S.E. 10 Street, Suite 201 Deerfield Beach, FL 33441-5634 or by calling 1-800-965-8307
or 954-785-1121.
|
|
|