You are not logged in.
This means you
CAN ONLY VIEW reports that were published prior to Thursday, April 3, 2025.
You
MUST UPGRADE YOUR MEMBERSHIP if you want to see any current reports.
AFTER MARKET UPDATE - FRIDAY, JUNE 5TH, 2020
Previous After Market Report Next After Market Report >>>
|
|
|
|
DOW |
+829.16 |
27,110.98 |
+3.15% |
|
Volume |
1,466,412,148 |
+27% |
|
Volume |
6,563,409,200 |
+9% |
|
NASDAQ |
+198.27 |
9,814.08 |
+2.06% |
|
Advancers |
2,488 |
85% |
|
Advancers |
2,496 |
75% |
|
S&P 500 |
+81.58 |
3,193.93 |
+2.62% |
|
Decliners |
439 |
15% |
|
Decliners |
813 |
25% |
|
Russell 2000 |
+55.09 |
1,507.15 |
+3.79% |
|
52 Wk Highs |
64 |
|
|
52 Wk Highs |
119 |
|
|
S&P 600 |
+37.88 |
899.33 |
+4.40% |
|
52 Wk Lows |
0 |
|
|
52 Wk Lows |
8 |
|
|
 |
Major Indices Rose With Greater Volume and Increasing Leadership
Kenneth J. Gruneisen - Passed the CAN SLIM® Master's Exam
The Dow rallied 829 points, while the S&P 500 gained 2.6%. The Nasdaq Composite rose 2.1%. For the week, the Dow surged 6.8%, while the S&P 500 advanced 4.9% marking its third straight weekly gain of more than 3.0% for the first time since 1982. Meanwhile, the Nasdaq Composite posted a five day increase of 3.4%. Advancers led decliners by a 5-1 margin on the NYSE and by a 3-1 margin on the Nasdaq exchange. The reported volume totals were higher than the prior session on the NYSE and on the Nasdaq exchange, indicating an increase in institutional buying demand. There were 60 high-ranked companies from the Leaders List that hit new 52-week highs and were listed on the BreakOuts Page, more than doubling the 27 on the prior session. New 52-week highs totals expanded and solidly outnumbered new 52-week lows totals which were in the single digits on the NYSE and on the Nasdaq exchange. The major indices are in a confirmed uptrend (M criteria). Any sustainable rally requires a healthy crop of new leaders, so the recent improvement in new highs totals was noted as an encouraging sign. Charts used courtesy of www.stockcharts.com
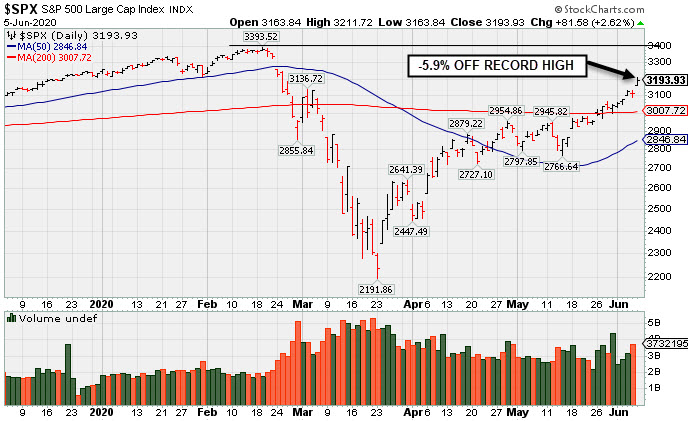
PICTURED: The benchmark S&P 500 Index is -5.9% off its record high hit on 2/19/20.
Stocks finished firmly higher Friday, as a surprise jump in non-farm payrolls bolstered market expectations for a swift economic recovery. On the data front, the Labor Department’s monthly jobs report showed the U.S. economy unexpectedly added 2.5 million jobs in May, rebounding from April’s historic 20.6 million decline and defying expectations for a 7.5 million drop. The unemployment rate also surprised to the upside, dipping to 13.3% from the prior month’s 14.7% reading. Treasuries firmly weakened across the curve, with the yield on the benchmark 10-year note jumping seven basis points to 0.88%, having risen 23 basis points since last Friday’s close. Other perceived safe-haven assets also declined, with COMEX gold losing 2.2% to $1,680.70/ounce.
All 11 S&P 500 sectors finished the day higher by at least 1.0%. Energy paced the gains, advancing 7.5% as WTI crude jumped 5.1% to $39.30/barrel. Stocks related to economic reopenings received a tailwind as American Airlines (AAL +11.18%) and Wynn Resorts (WYNN+6.53%) rose. In earnings, Slack Technologies (WORK -14.18%) abruptly gapped down after the software company reported slower growth in its paying customer base. Elsewhere, Broadcom (AVGO +2.65%) after reporting a limited impact from COVID-19 in the most recent quarter. |
 Kenneth J. Gruneisen started out as a licensed stockbroker in August 1987, a couple of months prior to the historic stock market crash that took the Dow Jones Industrial Average down -22.6% in a single day. He has published daily fact-based fundamental and technical analysis on high-ranked stocks online for two decades. Through FACTBASEDINVESTING.COM, Kenneth provides educational articles, news, market commentary, and other information regarding proven investment systems that work in good times and bad.
Comments contained in the body of this report are technical opinions only and are not necessarily those of Gruneisen Growth Corp. The material herein has been obtained from sources believed to be reliable and accurate, however, its accuracy and completeness cannot be guaranteed. Our firm, employees, and customers may effect transactions, including transactions contrary to any recommendation herein, or have positions in the securities mentioned herein or options with respect thereto. Any recommendation contained in this report may not be suitable for all investors and it is not to be deemed an offer or solicitation on our part with respect to the purchase or sale of any securities. |
|
 |
Energy Group Outpaced Financial, Tech, and Retail Indexes
Kenneth J. Gruneisen - Passed the CAN SLIM® Master's Exam
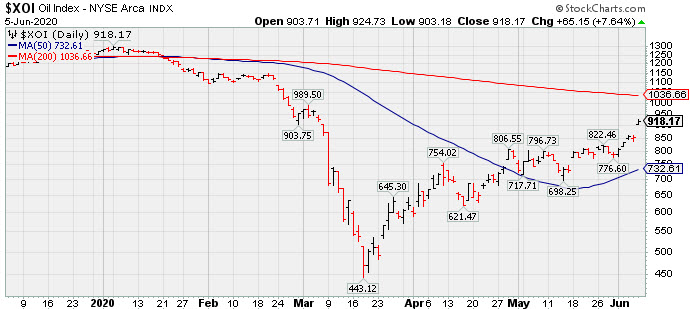
The Bank Index ($BKX +4.55%) and the Broker/Dealer Index ($XBD +2.32%) both posted solid gains again on Friday. The Retail Index ($RLX +1.55%) posted a smaller gain. The tech sector was led higher by the Networking Index ($NWX +4.18%) and the Semiconductor Index ($SOX +2.57%) also posted a solid gain while the Biotech Index ($BTK +0.12%) held its ground. Energy-linked groups were standout gainers as the Oil Services Index ($OSX +12.86%) and the Integrated Oil Index ($XOI +7.64%) both posted very big gains, meanwhile the Gold & Silver Index ($XAU -1.36%) was a standout decliner.
PICTURED: The Integrated Oil Index ($XOI +7.64%) posted a big gain on Friday as it has been making progress toward its 200-day moving average (DMA) line.
| Oil Services |
$OSX |
41.29 |
+4.71 |
+12.88% |
-47.26% |
| Integrated Oil |
$XOI |
918.17 |
+65.15 |
+7.64% |
-27.73% |
| Semiconductor |
$SOX |
2,003.76 |
+50.29 |
+2.57% |
+8.33% |
| Networking |
$NWX |
587.77 |
+23.58 |
+4.18% |
+0.75% |
| Broker/Dealer |
$XBD |
290.62 |
+6.60 |
+2.32% |
+0.08% |
| Retail |
$RLX |
2,874.82 |
+43.90 |
+1.55% |
+17.37% |
| Gold & Silver |
$XAU |
114.87 |
-1.58 |
-1.36% |
+7.44% |
| Bank |
$BKX |
87.39 |
+3.80 |
+4.55% |
-22.91% |
| Biotech |
$BTK |
5,567.80 |
+6.73 |
+0.12% |
+9.87% |
|
|
|
 |
Positive Reversal Near Prior High and 50 DMA Line
Kenneth J. Gruneisen - Passed the CAN SLIM® Master's Exam
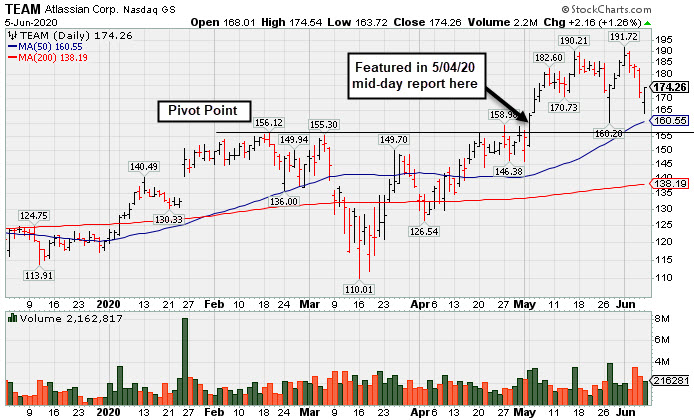
Atlassian Corp (TEAM +$2.16 or +1.26% to $174.26) managed a positive reversal today after losses backed by above average volume. Its 50-day moving average (DMA) line ($160.55) defines important support above prior highs in the $156 area.
TEAM has a 98 Earnings Per Share rating, but fundamental concerns were raised after it recently reported earnings +19% on +33% sales revenues for the Mar '20 quarter, breaking a strong track record of +25% earnings increases (C criteria). This Australia - based software developer had shown 9 consecutive quarterly comparisons above the +25% minimum guideline (C criteria). Its annual earnings (A criteria) history has been strong since its $21 IPO on 12/10/15.
TEAM finished strong after highlighted in yellow with pivot point based on its 2/19/20 high plus 10 cents in the 5/04/20 mid-day report (read here). It hit a new all-time high with a big gain and strong close above the pivot point backed by +61% above average volume clinching a convincing technical buy signal.
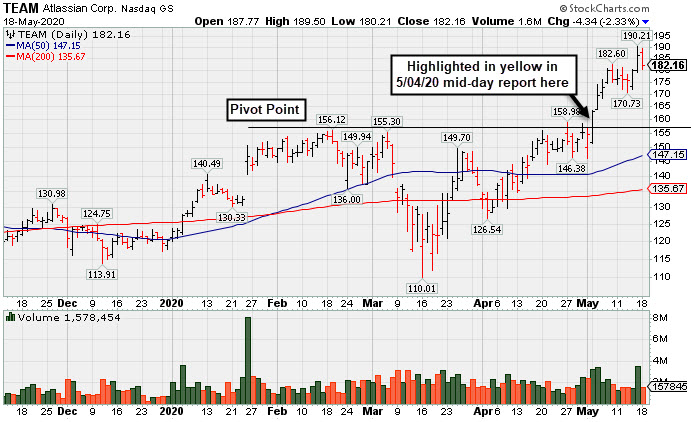
TEAM was last shown in the FSU section on 5/18/20 with an annotated graph under the headline, "Pullback on Lighter Volume After Gain For New High on Big Volume". The number of top-rated funds owning its shares rose from 266 in Sep '17 to 727 in Mar '20, a reassuring sign concerning the I criteria. It has a Timeliness Rating of A and Sponsorship Rating of A. Its current Up/Down Volume Ratio of 1.3 is an unbiased indication its shares have been under accumulation or distribution over the past 50 days.
|
|
|
Color Codes Explained :
Y - Better candidates highlighted by our
staff of experts.
G - Previously featured
in past reports as yellow but may no longer be buyable under the
guidelines.
***Last / Change / Volume data in this table is the closing quote data***
Symbol/Exchange
Company Name
Industry Group |
PRICE |
CHANGE
(%Change) |
Day High |
Volume
(% DAV)
(% 50 day avg vol) |
52 Wk Hi
% From Hi |
Featured
Date |
Price
Featured |
Pivot Featured |
|
Max Buy |
 FTNT
-
NASDAQ
FTNT
-
NASDAQ
Fortinet Inc
Computer Sftwr-Security
|
$140.48
|
+0.90
0.64% |
$141.64
|
1,524,358
75.20% of 50 DAV
50 DAV is 2,027,000
|
$149.69
-6.15%
|
5/7/2020
|
$134.40
|
PP = $121.92
|
|
MB = $128.02
|
 Most Recent Note - 6/5/2020 2:45:16 PM
G - Managed a positive reversal today after early weakness. Consolidating near its all-time high wit volume totals cooling in recent weeks. Prior highs in the $121 area define initial support to watch above its 50 DMA line.
>>> FEATURED STOCK ARTICLE : Extended From Prior Base and Holding Ground Stubbornly - 5/22/2020 |
View all notes |
Set NEW NOTE alert |
Company Profile |
SEC
News |
Chart |
Request a new note
C
A
S
I |
EBS
-
NYSE
Emergent Biosolutions
DRUGS - Biotechnology
|
$86.91
|
+2.09
2.46% |
$87.81
|
507,955
97.12% of 50 DAV
50 DAV is 523,000
|
$93.58
-7.13%
|
6/1/2020
|
$72.10
|
PP = $90.10
|
|
MB = $94.61
|
Most Recent Note - 6/5/2020 2:43:47 PM
Y - Today's gain on light volume has it poised for a best ever close on the weekly chart after a noted advanced "3 weeks tight" base pattern. New pivot point cited was based on its 5/12/20 high plus 10 cents. Subsequent gains and a strong close above the pivot point backed by at least +40% above average volume are still needed to clinch a convincing new (or add-on) technical buy signal. Prior low ($78.28 on 5/14/20) defines initial support above its 50 DMA line ($73.80). Fundamentals remain strong.
>>> FEATURED STOCK ARTICLE : Volume Light Behind Recent Pullback From All-Time High - 5/26/2020 |
View all notes |
Set NEW NOTE alert |
Company Profile |
SEC
News |
Chart |
Request a new note
C
A
S
I |
NBIX
-
NASDAQ
Neurocrine Biosciences
DRUGS - Biotechnology
|
$115.86
|
-4.25
-3.54% |
$118.97
|
1,191,725
140.43% of 50 DAV
50 DAV is 848,600
|
$128.29
-9.69%
|
5/19/2020
|
$123.71
|
PP = $119.75
|
|
MB = $125.74
|
Most Recent Note - 6/5/2020 1:12:24 PM
G - Color code is changed to green today after slumping below the pivot point and falling back into the previously noted base raising concerns. Recent quarterly comparisons through Mar '20 showed greatly improved sales revenues and earnings increases versus year ago periods (C criteria). After years of losses it reported solid annual earnings (A criteria) in FY '18 and '19.
>>> FEATURED STOCK ARTICLE : Biotech Firm Has New Parkinson's Treatment Drug Approved by FDA - 5/19/2020 |
View all notes |
Set NEW NOTE alert |
Company Profile |
SEC
News |
Chart |
Request a new note
C
A
S
I |
TREX
-
NYSE
Trex Company Inc
MATERIALS and CONSTRUCTION - General Building Materials
|
$124.95
|
+10.60
9.27% |
$126.05
|
1,284,973
126.72% of 50 DAV
50 DAV is 1,014,000
|
$132.84
-5.94%
|
5/5/2020
|
$109.05
|
PP = $111.95
|
|
MB = $117.55
|
Most Recent Note - 6/5/2020 2:39:05 PM
G - Posting a big gain today following a pullback from oits all-time high. Recent gains above the pivot point lacked the great volume conviction. Prior highs in the $111 area define initial support to watch. Fundamentals remain strong.
>>> FEATURED STOCK ARTICLE : Bullish Action Continues for Top Wood Alternative Firm - 5/20/2020 |
View all notes |
Set NEW NOTE alert |
Company Profile |
SEC
News |
Chart |
Request a new note
C
A
S
I |
NFLX
-
NASDAQ
Netflix Inc
SPECIALTY RETAIL - Music and Video Stores
|
$419.60
|
+5.27
1.27% |
$420.24
|
5,095,029
60.79% of 50 DAV
50 DAV is 8,382,000
|
$458.97
-8.58%
|
5/14/2020
|
$441.95
|
PP = $449.62
|
|
MB = $472.10
|
Most Recent Note - 6/2/2020 6:36:24 PM
Y - Managed a "positive reversal" on 5/27/20 but volume totals have been very light behind recent gains. Found prompt support near its 50 DMA line ($410.72), and more damaging losses would trigger a technical sell signal. A rebound and subsequent gains above the pivot point must be backed by at least +40% above average volume to trigger a proper new (or add-on) technical buy signal. Fundamentals remain strong.
>>> FEATURED STOCK ARTICLE : Pulling Back After Brief New Base Formation - 5/21/2020 |
View all notes |
Set NEW NOTE alert |
Company Profile |
SEC
News |
Chart |
Request a new note
C
A
S
I |
Symbol/Exchange
Company Name
Industry Group |
PRICE |
CHANGE
(%Change) |
Day High |
Volume
(% DAV)
(% 50 day avg vol) |
52 Wk Hi
% From Hi |
Featured
Date |
Price
Featured |
Pivot Featured |
|
Max Buy |
NOW
-
NYSE
Servicenow Inc
Computer Sftwr-Enterprse
|
$390.46
|
+13.51
3.58% |
$390.68
|
2,455,158
103.11% of 50 DAV
50 DAV is 2,381,000
|
$396.15
-1.44%
|
4/30/2020
|
$343.05
|
PP = $363.05
|
|
MB = $381.20
|
Most Recent Note - 6/4/2020 5:49:40 PM
Y - Color code is changed to yellow while pulling back below the "max buy" level. Recent gains above the pivot point were not backed by the +40% above average volume necessary to clinch a proper technical buy signal. Prior highs in the $362 area define initial support to watch on pullbacks. See the latest FSU analysis for more details and a new annotated graph.
>>> FEATURED STOCK ARTICLE : Quiet Pullback Below "Max Buy" Level for NOW - 6/4/2020 |
View all notes |
Set NEW NOTE alert |
Company Profile |
SEC
News |
Chart |
Request a new note
C
A
S
I |
QLYS
-
NASDAQ
Qualys Inc
Computer Sftwr-Security
|
$108.54
|
-2.37
-2.14% |
$112.53
|
633,318
116.21% of 50 DAV
50 DAV is 545,000
|
$119.20
-8.94%
|
4/9/2020
|
$100.44
|
PP = $97.22
|
|
MB = $102.08
|
Most Recent Note - 6/5/2020 6:14:03 PM
G - Suffered a damaging loss today with volume slightly above average as it undercut prior highs raising concerns. It has been noted as extended from the prior base. Its 50 DMA line ($103.83) defines the next important near-term support. Fundamentals remain strong.
>>> FEATURED STOCK ARTICLE : Qualys is Extended From Prior Base and Perched Near All-Time High - 5/29/2020 |
View all notes |
Set NEW NOTE alert |
Company Profile |
SEC
News |
Chart |
Request a new note
C
A
S
I |
TEAM
-
NASDAQ
Atlassian Corp Plc Cl A
Comp Sftwr-Spec Enterprs
|
$174.26
|
+2.16
1.26% |
$174.54
|
2,207,665
111.61% of 50 DAV
50 DAV is 1,978,000
|
$191.72
-9.11%
|
5/4/2020
|
$159.70
|
PP = $156.22
|
|
MB = $164.03
|
Most Recent Note - 6/5/2020 6:15:31 PM
G - Managed a positive reversal today after losses backed by above average volume. Its 50 DMA line ($160.55) defines important support above prior highs in the $156 area. See the latest FSU analysis for more details and a new annotated graph.
>>> FEATURED STOCK ARTICLE : Positive Reversal Near Prior High and 50 DMA Line - 6/5/2020 |
View all notes |
Set NEW NOTE alert |
Company Profile |
SEC
News |
Chart |
Request a new note
C
A
S
I |
TTD
-
NASDAQ
The Trade Desk Inc Cl A
Comml Svcs-Advertising
|
$354.29
|
+17.05
5.06% |
$360.42
|
2,280,245
101.43% of 50 DAV
50 DAV is 2,248,000
|
$356.24
-0.55%
|
6/3/2020
|
$240.61
|
PP = $327.35
|
|
MB = $343.72
|
Most Recent Note - 6/5/2020 2:41:24 PM
G - Color code is changed to green after powering above its "max buy" level and hitting a new all-time high with today's big gain. Highlighted in yellow with new pivot point cited based on its 5/07/20 high in the 6/03/20 mid-day report. See the latest FSU analysis for more details and an annotated graph.
>>> FEATURED STOCK ARTICLE : Trade Desk Posts Powerful Gain for New High - 6/3/2020 |
View all notes |
Set NEW NOTE alert |
Company Profile |
SEC
News |
Chart |
Request a new note
C
A
S
I |
PING
-
NYSE
Ping Identity Hldg Corp
Computer Sftwr-Security
|
$29.47
|
-0.08
-0.27% |
$30.60
|
1,016,373
88.84% of 50 DAV
50 DAV is 1,144,000
|
$31.50
-6.44%
|
6/1/2020
|
$29.24
|
PP = $29.90
|
|
MB = $31.40
|
Most Recent Note - 6/4/2020 12:51:46 PM
Y - From the early lows of today's session it has rebounded, yet it is still on pace for a big loss with above average volume. Its slump below prior highs in the $29 area raised concerns and likely triggered sell stops (at -7-8%) for disciplined investors who may have bought above the pivot point cited. Highlighted in yellow with pivot point cited based on its 2/20/20 high plus 10 cents in the 6/01/20 mid-day report (read here).
>>> FEATURED STOCK ARTICLE : Strong Gain for New High Backed by 127% Above Average Volume - 6/1/2020 |
View all notes |
Set NEW NOTE alert |
Company Profile |
SEC
News |
Chart |
Request a new note
C
A
S
I |
Symbol/Exchange
Company Name
Industry Group |
PRICE |
CHANGE
(%Change) |
Day High |
Volume
(% DAV)
(% 50 day avg vol) |
52 Wk Hi
% From Hi |
Featured
Date |
Price
Featured |
Pivot Featured |
|
Max Buy |
AAXN
-
NASDAQ
Axon Enterprise Inc
Security/Sfty
|
$92.79
|
-0.55
-0.59% |
$97.22
|
850,171
90.35% of 50 DAV
50 DAV is 941,000
|
$99.62
-6.86%
|
5/8/2020
|
$84.86
|
PP = $90.20
|
|
MB = $94.71
|
Most Recent Note - 6/3/2020 12:38:52 PM
Y - Color code is changed to yellow while pulling back below its "max buy" level. Considerable volume-driven gains above the pivot point triggered a technical buy signal but it quickly got extended more than 5% above the prior highs in the $90-91 area which define initial support to watch on pullbacks.
>>> FEATURED STOCK ARTICLE : Quietly Slumping Near 50-Day Moving Average Line - 5/28/2020 |
View all notes |
Set NEW NOTE alert |
Company Profile |
SEC
News |
Chart |
Request a new note
C
A
S
I |
GDDY
-
NYSE
Godaddy Inc Cl A
Computer Sftwr-Enterprse
|
$78.59
|
-0.55
-0.69% |
$81.13
|
1,163,305
62.38% of 50 DAV
50 DAV is 1,865,000
|
$82.47
-4.70%
|
6/2/2020
|
$79.62
|
PP = $82.40
|
|
MB = $86.52
|
Most Recent Note - 6/2/2020 6:20:38 PM
Y - Posted a solid gain today backed by +133% above average volume for a new 52-week high. It was highlighted in yellow with pivot point cited based on its 5/01/19 high plus 10 cents in the earlier mid-day report. Subsequent gains above the pivot point backed by at least +40% above average volume are needed to trigger a proper technical buy signal. Rebounded impressively after a deep pullback. Approaching multi-year highs where it previously met stubborn resistance in the $82-84 area. The past 3 quarterly earnings comparisons through Mar '20 versus the year ago periods were above the +25% minimum guideline (C criteria). After years of losses, since FY 17 its annual earnings growth (A criteria) has been strong. See the latest FSU analysis for more details and a new annotated graph.
>>> FEATURED STOCK ARTICLE : Godaddy Could Be Ready to Go for New Highs - 6/2/2020 |
View all notes |
Set NEW NOTE alert |
Company Profile |
SEC
News |
Chart |
Request a new note
C
A
S
I |
|
|
|
THESE ARE NOT BUY RECOMMENDATIONS!
Comments contained in the body of this report are technical
opinions only. The material herein has been obtained
from sources believed to be reliable and accurate, however,
its accuracy and completeness cannot be guaranteed.
This site is not an investment advisor, hence it does
not endorse or recommend any securities or other investments.
Any recommendation contained in this report may not
be suitable for all investors and it is not to be deemed
an offer or solicitation on our part with respect to
the purchase or sale of any securities. All trademarks,
service marks and trade names appearing in this report
are the property of their respective owners, and are
likewise used for identification purposes only.
This report is a service available
only to active Paid Premium Members.
You may opt-out of receiving report notifications
at any time. Questions or comments may be submitted
by writing to Premium Membership Services 665 S.E. 10 Street, Suite 201 Deerfield Beach, FL 33441-5634 or by calling 1-800-965-8307
or 954-785-1121.
|
|
|