You are not logged in.
This means you
CAN ONLY VIEW reports that were published prior to Thursday, April 3, 2025.
You
MUST UPGRADE YOUR MEMBERSHIP if you want to see any current reports.
AFTER MARKET UPDATE - FRIDAY, JUNE 19TH, 2020
Previous After Market Report Next After Market Report >>>
|
|
|
|
DOW |
-208.64 |
25,871.46 |
-0.80% |
|
Volume |
3,518,193,100 |
+249% |
|
Volume |
6,033,255,200 |
+42% |
|
NASDAQ |
+2.93 |
9,945.98 |
+0.03% |
|
Advancers |
993 |
35% |
|
Advancers |
1,527 |
46% |
|
S&P 500 |
-17.60 |
3,097.74 |
-0.56% |
|
Decliners |
1,842 |
65% |
|
Decliners |
1,803 |
54% |
|
Russell 2000 |
-8.44 |
1,418.63 |
-0.59% |
|
52 Wk Highs |
68 |
|
|
52 Wk Highs |
167 |
|
|
S&P 600 |
-10.53 |
818.76 |
-1.27% |
|
52 Wk Lows |
6 |
|
|
52 Wk Lows |
8 |
|
|
 |
Leadership Improved While Major Indices Ended Mixed
Kenneth J. Gruneisen - Passed the CAN SLIM® Master's Exam
The Dow fell 208 points, to pare its weekly advance to 1%. The S&P 500 fell 0.6%, but still rose 1.9% for the week. The Nasdaq Composite continued to buck the downtrend for the sixth straight session, finishing just above the flat line and 3.7% higher for the week. Decliners led advancers by almost a 2-1 margin on the NYSE and 6-5 on the Nasdaq exchange. The reported volume totals were higher than the prior session on the NYSE and on the Nasdaq exchange, inflated by options expirations. There were 59 high-ranked companies from the Leaders List that hit new 52-week highs and were listed on the BreakOuts Page, versus the total of 34 on the prior session. New 52-week highs totals expanded and easily outnumbered new 52-week lows totals which were in the single digits on the NYSE and on the Nasdaq exchange. The major indices remain in a confirmed uptrend (M criteria). Any sustainable rally requires a healthy crop of new leaders, so it was encouraging to recently see the new highs totals improve. Charts used courtesy of www.stockcharts.com
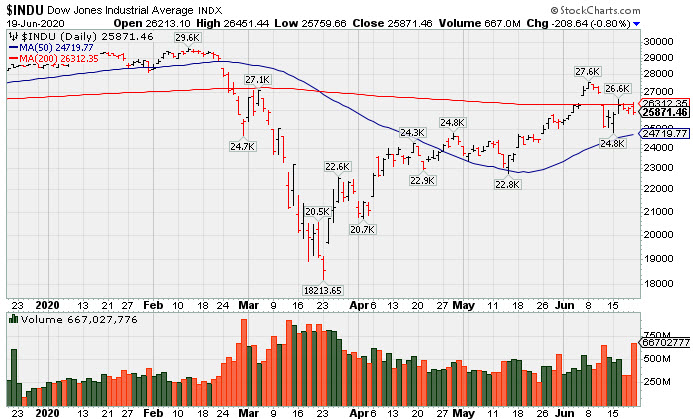
PICTURED: The Dow Jones Industrial Average is consolidating below its 200-day moving average (DMA) line and perched -12.5% off its record high.
Stocks fluctuated on Friday, as investors weighed concerns that a resurgence in COVID-19 cases could dampen the recovery in business activity. Stocks reversed early session gains after Apple announced temporary store closures in recent coronavirus hotspot states, such as Arizona and Florida.
In geopolitical news, China reportedly has plans to accelerate the purchase of U.S. agricultural products to meet the requirements of the phase one trade deal. On the data front, an update on the current account balance for the first quarter showed the deficit slightly narrowed to a $104.2 billion shortfall. Elsewhere, Fed Chair Jerome Powell said the economic recovery from the pandemic will continue to be a challenge, reiterating his cautionary outlook. Treasuries advanced, with the yield on the 10-year note dipping one basis point to 0.69%. In commodities, WTI crude rose 1.9% to $39.56/barrel, rising 9% for the week. COMEX gold added 1.2% to $1,746.20/ounce.
Ten of 11 S&P 500 sectors ended in negative territory, with Health Care stocks the lone advancer. The Utilities group led laggards with a 3.1% decline. In corporate news, AMC Entertainment (AMCE -1.95%) fell despite the movie theatre operator announcing plans to reopen roughly 450 locations in the United States on July 15th. Elsewhere, Target (TGT +2.78%) rose after being subject to a Wall Street analyst upgrade. |
 Kenneth J. Gruneisen started out as a licensed stockbroker in August 1987, a couple of months prior to the historic stock market crash that took the Dow Jones Industrial Average down -22.6% in a single day. He has published daily fact-based fundamental and technical analysis on high-ranked stocks online for two decades. Through FACTBASEDINVESTING.COM, Kenneth provides educational articles, news, market commentary, and other information regarding proven investment systems that work in good times and bad.
Comments contained in the body of this report are technical opinions only and are not necessarily those of Gruneisen Growth Corp. The material herein has been obtained from sources believed to be reliable and accurate, however, its accuracy and completeness cannot be guaranteed. Our firm, employees, and customers may effect transactions, including transactions contrary to any recommendation herein, or have positions in the securities mentioned herein or options with respect thereto. Any recommendation contained in this report may not be suitable for all investors and it is not to be deemed an offer or solicitation on our part with respect to the purchase or sale of any securities. |
|
 |
Gold & Silver and Biotech Indexes Rose
Kenneth J. Gruneisen - Passed the CAN SLIM® Master's Exam
The Broker/Dealer Index ($XBD -0.49%) and Bank Index ($BKX -0.47%) both edged lower and the Retail Index ($RLX +0.10%) finished with a slight gain. The tech sector was mixed as the Biotech Index ($BTK +3.50%) posted a solid gain, meanwhile the Networking Index ($NWX -1.13%) and Semiconductor Index ($SOX -0.67%) both ended lower. Energy-linked groups had a negative bias as the Oil Services Index ($OSX -2.31%) and the Integrated Oil Index ($XOI -1.31%) both fell. The Gold & Silver Index ($XAU +3.71%) was a standout gainer.
PICTURED: The Broker/Dealer Index ($XBD -0.49%) is consolidating above near-term support defined by its 200-day moving average (DMA) line.
| Oil Services |
$OSX |
34.61 |
-0.81 |
-2.29% |
-55.79% |
| Integrated Oil |
$XOI |
813.28 |
-10.81 |
-1.31% |
-35.99% |
| Semiconductor |
$SOX |
1,966.22 |
-13.92 |
-0.70% |
+6.30% |
| Networking |
$NWX |
552.43 |
-6.31 |
-1.13% |
-5.31% |
| Broker/Dealer |
$XBD |
272.82 |
-1.34 |
-0.49% |
-6.05% |
| Retail |
$RLX |
2,942.12 |
+2.93 |
+0.10% |
+20.12% |
| Gold & Silver |
$XAU |
116.75 |
+4.18 |
+3.71% |
+9.19% |
| Bank |
$BKX |
78.57 |
-0.37 |
-0.47% |
-30.69% |
| Biotech |
$BTK |
5,828.80 |
+197.23 |
+3.50% |
+15.02% |
|
|
|
 |
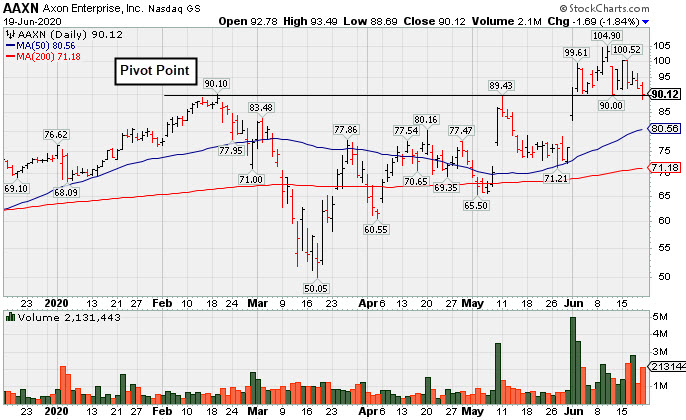
Completed New Pubic Offering and Found Support Near Prior High
Kenneth J. Gruneisen - Passed the CAN SLIM® Master's Exam
Axon Enterprise Inc (AAXN -$1.69 or -1.84% to $90.12) completed a new Pubic Offering on 6/17/20. Such offerings often hinder price progress temporarily, yet they help companies attract greater institutional ownership interest (I criteria). The prior highs in the $90-91 area have acted as support following a powerful breakout. More damaging losses would raise greater concerns and trigger a technical sell signal. Its 50-day moving average (DMA) line ($80.56) defines the next important support.
AAXN was highlighted in yellow in the 5/08/20 mid-day report with pivot point cited based upon its 2/19/20 high plus 10 cents (read here). It was last shown in this FSU section on 5/28/20 with an annotated graph under the headline, "Quietly Slumping Near 50-Day Moving Average Line".
The company has a small supply of only 59.8 million shares outstanding (S criteria) which can contribute to greater price volatility in the event of institutional buying or selling. The number of top-rated funds owning its shares rose from 400 in Sep '19 to 450 in Mar '20, a reassuring sign concerning the I criteria. AAXN has a Timeliness Rating of B and an Accumulation/Distribution Rating of D. The Security/Safety industry group currently has a Group Relative Strength Rating of A (86).
The Sep, Dec '19 and Mar '20 quarterly comparisons versus the year ago periods showed earnings increases above the +25% minimum guideline (C criteria) with strong underlying sales revenues increases. Its annual earnings (A criteria) history has also been strong, helping it get a 98 Earnings Per Share Rating. |
|
|
Color Codes Explained :
Y - Better candidates highlighted by our
staff of experts.
G - Previously featured
in past reports as yellow but may no longer be buyable under the
guidelines.
***Last / Change / Volume data in this table is the closing quote data***
Symbol/Exchange
Company Name
Industry Group |
PRICE |
CHANGE
(%Change) |
Day High |
Volume
(% DAV)
(% 50 day avg vol) |
52 Wk Hi
% From Hi |
Featured
Date |
Price
Featured |
Pivot Featured |
|
Max Buy |
 FTNT
-
NASDAQ
FTNT
-
NASDAQ
Fortinet Inc
Computer Sftwr-Security
|
$136.71
|
+1.07
0.79% |
$138.37
|
3,516,325
204.20% of 50 DAV
50 DAV is 1,722,000
|
$149.69
-8.67%
|
5/7/2020
|
$134.40
|
PP = $121.92
|
|
MB = $128.02
|
Most Recent Note - 6/18/2020 5:22:00 PM
G - Closed -9.4% off its all-time high today with volume totals cooling during the orderly consolidation. The prior low ($126.88 on 6/15/20) and its 50 DMA line ($126) define important near-term support to watch on pullbacks.
>>> FEATURED STOCK ARTICLE : Managed a "Positive Reversal" After Brief Dip Below "Max Buy" Level - 6/15/2020 |
View all notes |
Set NEW NOTE alert |
Company Profile |
SEC
News |
Chart |
Request a new note
C
A
S
I |
EBS
-
NYSE
Emergent Biosolutions
DRUGS - Biotechnology
|
$71.88
|
+1.83
2.61% |
$72.22
|
928,419
152.45% of 50 DAV
50 DAV is 609,000
|
$93.58
-23.19%
|
6/1/2020
|
$72.10
|
PP = $90.10
|
|
MB = $94.61
|
 Most Recent Note - 6/19/2020 5:46:56 PM
G - Posted a gain with above average volume. Subsequent gains and a convincing rebound above the 50 DMA line ($76.33) are still needed to help its outlook improve. Any damaging losses below the recent low ($66.69) may trigger a more worrisome technical sell signal. Fundamentals remain strong.
>>> FEATURED STOCK ARTICLE : Still Below 50-Day Moving Average Following Damaging Gap Down - 6/16/2020 |
View all notes |
Set NEW NOTE alert |
Company Profile |
SEC
News |
Chart |
Request a new note
C
A
S
I |
NBIX
-
NASDAQ
Neurocrine Biosciences
DRUGS - Biotechnology
|
$128.83
|
+7.80
6.44% |
$128.95
|
2,008,424
245.83% of 50 DAV
50 DAV is 817,000
|
$128.29
0.42%
|
5/19/2020
|
$123.71
|
PP = $119.75
|
|
MB = $125.74
|
Most Recent Note - 6/19/2020 5:45:20 PM
G - Powered to a new 52-week high with a considerable volume-driven gain clinching a technical buy signal while quickly rallying above the "max buy" level. Recent quarterly comparisons through Mar '20 showed greatly improved sales revenues and earnings increases versus year ago periods (C criteria). After years of losses it reported solid annual earnings (A criteria) in FY '18 and '19.
>>> FEATURED STOCK ARTICLE : Pullback Into Prior Base Negated Recent Breakout - 6/8/2020 |
View all notes |
Set NEW NOTE alert |
Company Profile |
SEC
News |
Chart |
Request a new note
C
A
S
I |
BMRN
-
NASDAQ
Biomarin Pharmaceutical
DRUGS - Drug Manufacturers - Other
|
$124.12
|
+10.29
9.04% |
$124.95
|
4,531,524
284.46% of 50 DAV
50 DAV is 1,593,000
|
$115.95
7.05%
|
6/17/2020
|
$110.95
|
PP = $112.67
|
|
MB = $118.30
|
Most Recent Note - 6/19/2020 5:40:01 PM
G - Posted a 6th consecutive gain today with +184% above average volume as it clinched a convincing technical buy signal and quickly powered above its "max buy" level. Color code is changed to green. Reported strong results for the Mar '20 quarter and recent comparisons showed improved earnings increases. Annual earnings (A criteria) history has been strong. Prior high ($112.57) defines initial support to watch on pullbacks.
>>> FEATURED STOCK ARTICLE : Hit New 52-Week High But Closed Below Pivot After 3-Weeks Tight - 6/17/2020 |
View all notes |
Set NEW NOTE alert |
Company Profile |
SEC
News |
Chart |
Request a new note
C
A
S
I |
AMD
-
NASDAQ
Advanced Micro Devices
ELECTRONICS - Semiconductor - Broad Line
|
$54.23
|
+0.19
0.35% |
$55.46
|
52,698,511
81.33% of 50 DAV
50 DAV is 64,795,000
|
$59.27
-8.50%
|
6/9/2020
|
$55.41
|
PP = $56.98
|
|
MB = $59.83
|
Most Recent Note - 6/16/2020 6:13:38 PM
Y - Consolidating above important support at its 50 DMA line ($53.61) with volume totals cooling. Subsequent gains above the pivot point backed by at least +40% above average volume are still needed to trigger a convincing technical buy signal. Previously met stubborn resistance in the $57-59 area. Gains into new high territory may mark the beginning of a substantial leg higher. The 3 latest quarterly comparisons through Mar '20 showed very strong earnings increases with greatly improved sales revenues growth in the Dec '19 and Mar '20 comparisons versus the year ago period.
>>> FEATURED STOCK ARTICLE : Big Chip Firm Showing Strong Sales Revenues and Earnings Increases - 6/9/2020 |
View all notes |
Set NEW NOTE alert |
Company Profile |
SEC
News |
Chart |
Request a new note
C
A
S
I |
Symbol/Exchange
Company Name
Industry Group |
PRICE |
CHANGE
(%Change) |
Day High |
Volume
(% DAV)
(% 50 day avg vol) |
52 Wk Hi
% From Hi |
Featured
Date |
Price
Featured |
Pivot Featured |
|
Max Buy |
TREX
-
NYSE
Trex Company Inc
MATERIALS and CONSTRUCTION - General Building Materials
|
$119.15
|
-0.81
-0.68% |
$121.94
|
951,135
96.66% of 50 DAV
50 DAV is 984,000
|
$132.84
-10.31%
|
5/5/2020
|
$109.05
|
PP = $111.95
|
|
MB = $117.55
|
Most Recent Note - 6/19/2020 5:48:21 PM
G - Color code is changed to green while consolidating above its "max buy" level. Prior highs in the $111 area define important support to watch above its 50 DMA line ($107.89). Fundamentals remain strong.
>>> FEATURED STOCK ARTICLE : Pullback Toward Prior Highs Which Define Near-Term Support - 6/11/2020 |
View all notes |
Set NEW NOTE alert |
Company Profile |
SEC
News |
Chart |
Request a new note
C
A
S
I |
NFLX
-
NASDAQ
Netflix Inc
SPECIALTY RETAIL - Music and Video Stores
|
$453.72
|
+3.85
0.86% |
$453.97
|
5,888,632
73.03% of 50 DAV
50 DAV is 8,063,000
|
$458.97
-1.14%
|
5/14/2020
|
$441.95
|
PP = $449.62
|
|
MB = $472.10
|
Most Recent Note - 6/17/2020 6:10:58 PM
Y - Found support near its 50 DMA line ($424.61) recently and posted a 3rd consecutive gain today with below average volume. Subsequent volume-driven gains above the pivot point may trigger a new (or add-on) technical buy signal. Any damaging losses below the 50 DMA line and prior lows would trigger a more worrisome technical sell signal.
>>> FEATURED STOCK ARTICLE : Weak Action Led to 50-Day Moving Average Violation - 6/12/2020 |
View all notes |
Set NEW NOTE alert |
Company Profile |
SEC
News |
Chart |
Request a new note
C
A
S
I |
CHGG
-
NYSE
Chegg Inc
Consumer Svcs-Education
|
$67.81
|
+4.70
7.45% |
$69.05
|
7,654,201
197.27% of 50 DAV
50 DAV is 3,880,000
|
$67.98
-0.25%
|
6/17/2020
|
$63.71
|
PP = $68.08
|
|
MB = $71.48
|
Most Recent Note - 6/19/2020 5:41:17 PM
Y - Hit a new 52-week high today with +97% above average volume behind a considerable gain. Highlighted in yellow in the 6/17/20 mid-day report with a new pivot point cited based on its 5/15/20 high plus 10 cents after a flat 5-week base noted - "Subsequent gains above the pivot point backed by at least +40% above average volume may trigger a technical buy signal. Bullish action came after it reported earnings +47% on +35% sales revenues for the Mar '20 quarter. Went through a choppy consolidation since dropped from the Featured Stocks list on 9/03/19. Fundamentals have remained strong. See the latest FSU analysis for more details and a new annotated graph."
>>> FEATURED STOCK ARTICLE : Formed a Flat Base Perched Within Striking Distance of 52-Week High - 6/18/2020 |
View all notes |
Set NEW NOTE alert |
Company Profile |
SEC
News |
Chart |
Request a new note
C
A
S
I |
NOW
-
NYSE
Servicenow Inc
Computer Sftwr-Enterprse
|
$399.87
|
-1.16
-0.29% |
$407.99
|
2,267,618
107.32% of 50 DAV
50 DAV is 2,113,000
|
$407.59
-1.89%
|
4/30/2020
|
$343.05
|
PP = $363.05
|
|
MB = $381.20
|
Most Recent Note - 6/16/2020 6:21:44 PM
G - Posted a 3rd consecutive gain today with below average volume for its second best ever close. Recent gains above the pivot point were not backed by the +40% above average volume necessary to clinch a proper technical buy signal. Prior highs in the $362 area define initial support to watch above its 50 DMA line ($349.24).
>>> FEATURED STOCK ARTICLE : Quiet Pullback Below "Max Buy" Level for NOW - 6/4/2020 |
View all notes |
Set NEW NOTE alert |
Company Profile |
SEC
News |
Chart |
Request a new note
C
A
S
I |
TEAM
-
NASDAQ
Atlassian Corp Plc Cl A
Comp Sftwr-Spec Enterprs
|
$172.64
|
-4.99
-2.81% |
$180.81
|
1,427,458
73.24% of 50 DAV
50 DAV is 1,949,000
|
$191.72
-9.95%
|
5/4/2020
|
$159.70
|
PP = $156.22
|
|
MB = $164.03
|
Most Recent Note - 6/19/2020 5:35:54 PM
G - Suffered a loss today with below average volume. Consolidating above its 50 DMA line ($167.99) which defines important near-term support above prior highs in the $156 area.
>>> FEATURED STOCK ARTICLE : Positive Reversal Near Prior High and 50 DMA Line - 6/5/2020 |
View all notes |
Set NEW NOTE alert |
Company Profile |
SEC
News |
Chart |
Request a new note
C
A
S
I |
Symbol/Exchange
Company Name
Industry Group |
PRICE |
CHANGE
(%Change) |
Day High |
Volume
(% DAV)
(% 50 day avg vol) |
52 Wk Hi
% From Hi |
Featured
Date |
Price
Featured |
Pivot Featured |
|
Max Buy |
TTD
-
NASDAQ
The Trade Desk Inc Cl A
Comml Svcs-Advertising
|
$394.78
|
+0.39
0.10% |
$406.55
|
1,634,470
75.78% of 50 DAV
50 DAV is 2,157,000
|
$396.49
-0.43%
|
6/3/2020
|
$240.61
|
PP = $327.35
|
|
MB = $343.72
|
Most Recent Note - 6/18/2020 5:13:00 PM
G - Hit another new high today with below average volume behind its 5th consecutive gain. Prior highs in the $327 area define important near-term support.
>>> FEATURED STOCK ARTICLE : Trade Desk Posts Powerful Gain for New High - 6/3/2020 |
View all notes |
Set NEW NOTE alert |
Company Profile |
SEC
News |
Chart |
Request a new note
C
A
S
I |
DOCU
-
NASDAQ
Docusign Inc
Computer Sftwr-Enterprse
|
$161.42
|
-0.88
-0.54% |
$165.00
|
14,135,723
344.10% of 50 DAV
50 DAV is 4,108,000
|
$167.87
-3.84%
|
6/10/2020
|
$149.73
|
PP = $152.10
|
|
MB = $159.71
|
Most Recent Note - 6/16/2020 12:34:18 PM
G - Color code was changed to green after rallying above its "max buy" level on the prior session. Posted a big gain above the pivot point backed by +107% above average volume triggering a new (or add-on) technical buy signal.
>>> FEATURED STOCK ARTICLE : Advanced Ascending Base Formed for Strong E-Signature Firm - 6/10/2020 |
View all notes |
Set NEW NOTE alert |
Company Profile |
SEC
News |
Chart |
Request a new note
C
A
S
I |
PING
-
NYSE
Ping Identity Hldg Corp
Computer Sftwr-Security
|
$32.10
|
-1.99
-5.84% |
$35.36
|
2,822,301
222.05% of 50 DAV
50 DAV is 1,271,000
|
$34.52
-7.01%
|
6/1/2020
|
$29.24
|
PP = $29.90
|
|
MB = $31.40
|
Most Recent Note - 6/19/2020 5:34:57 PM
G - Reversed into the red after early gains today hitting a new all-time high, closing near the session low with a above average volume behind its big loss. Big gain on the prior session backed by +71% above average volume triggered a technical buy signal. Prior highs in the $29 area define initial support to watch on pullbacks.
>>> FEATURED STOCK ARTICLE : Strong Gain for New High Backed by 127% Above Average Volume - 6/1/2020 |
View all notes |
Set NEW NOTE alert |
Company Profile |
SEC
News |
Chart |
Request a new note
C
A
S
I |
AAXN
-
NASDAQ
Axon Enterprise Inc
Security/Sfty
|
$90.12
|
-1.69
-1.84% |
$93.49
|
2,131,446
191.85% of 50 DAV
50 DAV is 1,111,000
|
$104.90
-14.09%
|
5/8/2020
|
$84.86
|
PP = $90.20
|
|
MB = $94.71
|
Most Recent Note - 6/19/2020 5:33:04 PM
Y - Suffered a loss today with higher (above average) volume. Completed a new Pubic Offering on 6/17/20. Prior highs in the $90-91 area have acted as support following a powerful breakout. More damaging losses would raise concerns and trigger a technical sell signal. See the latest FSU analysis for more details and a new annotated graph.
>>> FEATURED STOCK ARTICLE : Completed New Pubic Offering and Found Support Near Prior High - 6/19/2020 |
View all notes |
Set NEW NOTE alert |
Company Profile |
SEC
News |
Chart |
Request a new note
C
A
S
I |
GDDY
-
NYSE
Godaddy Inc Cl A
Computer Sftwr-Enterprse
|
$81.20
|
+1.05
1.31% |
$81.32
|
2,878,043
219.70% of 50 DAV
50 DAV is 1,310,000
|
$82.47
-1.54%
|
6/2/2020
|
$79.62
|
PP = $82.40
|
|
MB = $86.52
|
Most Recent Note - 6/19/2020 5:46:08 PM
Y - Posted a 6th consecutive gain today with heavier volume. Perched within close striking distance of its 52-week high. Subsequent gains above the pivot point backed by at least +40% above average volume are needed to trigger a proper technical buy signal. It previously met stubborn resistance in the $82-84 area.
>>> FEATURED STOCK ARTICLE : Godaddy Could Be Ready to Go for New Highs - 6/2/2020 |
View all notes |
Set NEW NOTE alert |
Company Profile |
SEC
News |
Chart |
Request a new note
C
A
S
I |
Symbol/Exchange
Company Name
Industry Group |
PRICE |
CHANGE
(%Change) |
Day High |
Volume
(% DAV)
(% 50 day avg vol) |
52 Wk Hi
% From Hi |
Featured
Date |
Price
Featured |
Pivot Featured |
|
Max Buy |
|
|
|
THESE ARE NOT BUY RECOMMENDATIONS!
Comments contained in the body of this report are technical
opinions only. The material herein has been obtained
from sources believed to be reliable and accurate, however,
its accuracy and completeness cannot be guaranteed.
This site is not an investment advisor, hence it does
not endorse or recommend any securities or other investments.
Any recommendation contained in this report may not
be suitable for all investors and it is not to be deemed
an offer or solicitation on our part with respect to
the purchase or sale of any securities. All trademarks,
service marks and trade names appearing in this report
are the property of their respective owners, and are
likewise used for identification purposes only.
This report is a service available
only to active Paid Premium Members.
You may opt-out of receiving report notifications
at any time. Questions or comments may be submitted
by writing to Premium Membership Services 665 S.E. 10 Street, Suite 201 Deerfield Beach, FL 33441-5634 or by calling 1-800-965-8307
or 954-785-1121.
|
|
|