You are not logged in.
This means you
CAN ONLY VIEW reports that were published prior to Wednesday, March 19, 2025.
You
MUST UPGRADE YOUR MEMBERSHIP if you want to see any current reports.
AFTER MARKET UPDATE - MONDAY, MAY 18TH, 2015
Previous After Market Report Next After Market Report >>>
|
|
|
|
DOW |
+26.32 |
18,298.88 |
+0.14% |
|
Volume |
653,300,180 |
-20% |
|
Volume |
1,505,515,460 |
-3% |
|
NASDAQ |
+30.15 |
5,078.44 |
+0.60% |
|
Advancers |
1,736 |
54% |
|
Advancers |
1,872 |
63% |
|
S&P 500 |
+6.47 |
2,129.20 |
+0.30% |
|
Decliners |
1,321 |
41% |
|
Decliners |
1,019 |
34% |
|
Russell 2000 |
+13.58 |
1,257.52 |
+1.09% |
|
52 Wk Highs |
117 |
|
|
52 Wk Highs |
147 |
|
|
S&P 600 |
+6.96 |
722.04 |
+0.97% |
|
52 Wk Lows |
28 |
|
|
52 Wk Lows |
52 |
|
|
 |
Major Average Rose on Lighter Volume
Kenneth J. Gruneisen - Passed the CAN SLIM® Master's Exam
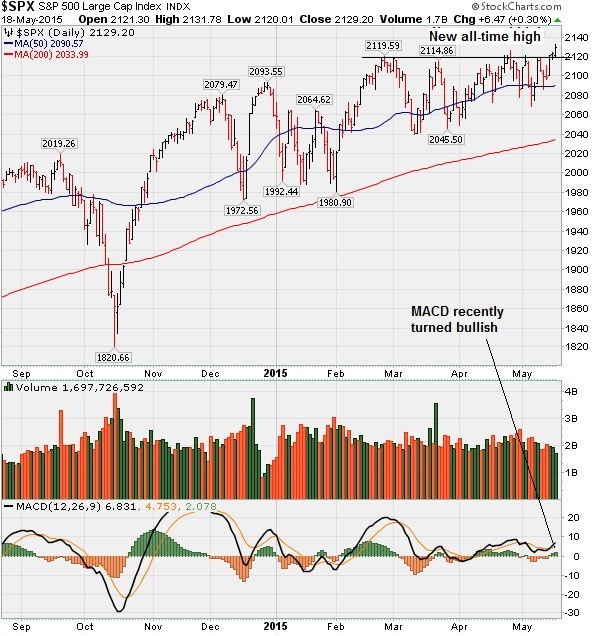
Stocks rose on Monday. The S&P 500 advanced 6 points to record level of 2129. The NASDAQ increased 30 points to 5078. The volume totals were reported lighter than the prior session totals on the NYSE and on the Nasdaq. Breadth was positive as advancers led decliners by a 9-7 margin on the NYSE, and by a 9-5 margin on the Nasdaq exchange. There were 75 high-ranked companies from the Leaders List that made new 52-week highs and appeared on the BreakOuts Page, up from the prior session total of 54 stocks. New 52-week highs expanded and outnumbered new 52-week lows on the NYSE and on the Nasdaq exchange. There were gains for 10 of the 11 high-ranked companies currently on the Featured Stocks Page.
Concerning the M criteria, Thursday's bullish action met the definition of a "follow-through day" under the guidelines the fact-based investment system, signaling that investors have a favorable market environment for buying stocks meeting all of the key fundamental and technical criteria. The Nasdaq Composite Index's 1.4% gain on higher volume was coupled with the S&P 500 Index's finish at a new record high close and improving leadership (more stocks hitting new 52-week highs).
PICTURED: The S&P 500 Index hit a new record high. Its MACD indicator recently turned bullish.
The major averages finished in positive territory led by gains in tech and financials. Shares of Apple (AAPL +1.10%) rose after activist investor Carl Icahn urged the board to increase the company’s share repurchase program. Bank of America (BAC +0.98%) and J.P. Morgan (JPM +0.82%) rose. Materials and consumer staples were the worst performing sectors in the session. Freeport-McMoRan (FCX -3.07%) fell in sympathy lower metal prices. Procter & Gamble (PG -0.38%) edged lower.
The economic calendar was light with the lone release today showing homebuilder sentiment unexpectedly fell in May. On the earnings front, Wal-Mart (WMT +0.86%) rose ahead of its quarterly results released before the open on Tuesday.
In M&A news, Ann Inc. (ANN +19.87%) after agreeing to be acquired by Ascena Retail Group (ASNA -0.99%). Altera (ALTR +5.65%) rose amid reports that the chipmaker resumed takeover talks with Intel (INTC +1.27%).
Treasuries followed a decline by foreign bond markets with the benchmark 10-year note down 26/32 to yield 2.23%.
In commodity trading, NYMEX WTI crude oil edged 0.1% lower to $59.63/barrel. COMEX gold dipped 0.1% to $1224.50/ounce amid a stronger dollar.
The Featured Stocks Page shows recent notes and Headline Links directing members to detailed analysis with data-packed graphs annotated by a Certified expert. See the Premium Member Homepage for archives to all prior pay reports published.
|
 Kenneth J. Gruneisen started out as a licensed stockbroker in August 1987, a couple of months prior to the historic stock market crash that took the Dow Jones Industrial Average down -22.6% in a single day. He has published daily fact-based fundamental and technical analysis on high-ranked stocks online for two decades. Through FACTBASEDINVESTING.COM, Kenneth provides educational articles, news, market commentary, and other information regarding proven investment systems that work in good times and bad.
Comments contained in the body of this report are technical opinions only and are not necessarily those of Gruneisen Growth Corp. The material herein has been obtained from sources believed to be reliable and accurate, however, its accuracy and completeness cannot be guaranteed. Our firm, employees, and customers may effect transactions, including transactions contrary to any recommendation herein, or have positions in the securities mentioned herein or options with respect thereto. Any recommendation contained in this report may not be suitable for all investors and it is not to be deemed an offer or solicitation on our part with respect to the purchase or sale of any securities. |
|
 |
Financial, Tech, and Retail Gains Lift Market
Kenneth J. Gruneisen - Passed the CAN SLIM® Master's Exam
Financials were a positive influence on the major averages on Monday as the Bank Index ($BKX +1.08%) and the Broker/Dealer Index ($XBD +1.69%) rose. The Retail Index ($RLX +0.57%) edged higher, and the tech sector saw unanimous gains from the Semiconductor Index ($SOX +0.99%), Biotechnology Index ($BTK +1.65%), and Networking Index ($NWX +1.19%). Energy-related shares were mixed as the Oil Services Index ($OSX +0.04%) finished flat and the Integrated Oil Index ($XOI -0.33%) edged lower.
Charts courtesy www.stockcharts.com

PICTURED: The Bank Index ($BKX +1.08%) hit a new high.
| Oil Services |
$OSX |
219.82 |
+0.08 |
+0.04% |
+4.24% |
| Integrated Oil |
$XOI |
1,377.65 |
-4.59 |
-0.33% |
+2.19% |
| Semiconductor |
$SOX |
716.54 |
+7.02 |
+0.99% |
+4.32% |
| Networking |
$NWX |
391.38 |
+4.59 |
+1.19% |
+9.34% |
| Broker/Dealer |
$XBD |
194.87 |
+3.24 |
+1.69% |
+5.54% |
| Retail |
$RLX |
1,152.73 |
+6.58 |
+0.57% |
+11.62% |
| Gold & Silver |
$XAU |
74.87 |
-0.25 |
-0.33% |
+8.85% |
| Bank |
$BKX |
75.94 |
+0.81 |
+1.08% |
+2.26% |
| Biotech |
$BTK |
4,105.82 |
+66.82 |
+1.65% |
+19.39% |
|
|
|
 |
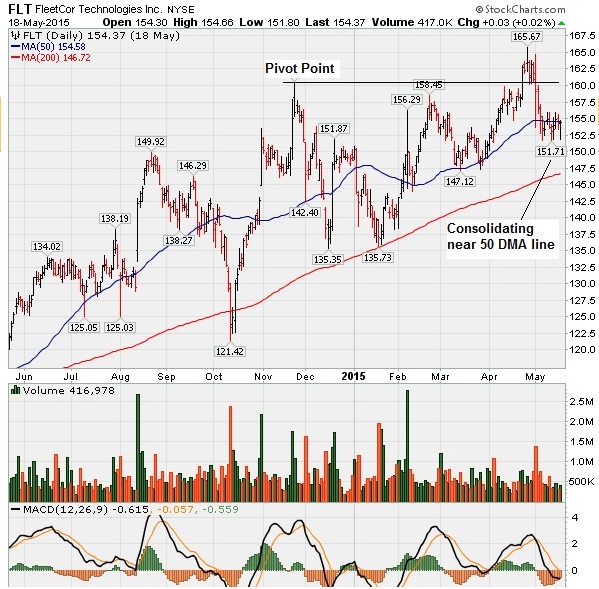
Relative Strength Rating Fell While Consolidating Near 50-Day Average
Kenneth J. Gruneisen - Passed the CAN SLIM® Master's Exam
FleetCor Technologies, Inc (FLT +$0.03 or +0.02% to $154.37) is sputtering near its 50-day moving average (DMA) line. Its Relative Strength Rating has slumped to 71, below the 80+ minimum guideline for buy candidates. Technically, it broke out on 4/23/15 with a volume-driven gain for new highs, and healthy stocks rarely fall more than -7% below their pivot point in favorable market environments.
It reported earnings +27%, +27%, +29%,and +29% for the Jun, Sep, Dec 14, and Mar '15 quarterly comparisons versus the year ago periods, respectively. Sales revenues rose +24%, +31%, +47%, and +64% during that span, a very reassuring acceleration in its growth rate. Fundamentals (C and A criteria) remain a good match with the fact-based investment system's guidelines. FLT last appeared in this FSU section on 5/01/15 with annotated graphs under the headline, "Testing Support at 50-Day Moving Average Line". It was highlighted in yellow in the earlier mid-day report (read here)
The company hails from the Finance - Credit Card Payment Processing group which saw big gains in recent weeks from Visa (V) and MasterCard (MA). Impressive strength and leadership from other firms in the same industry group is a reassurance concerning the L criteria. The company completed a Secondary Offering on 9/11/13. Prior Secondary Offerings on 3/14/12, 6/11/12, 11/29/12, and 3/08/13 were previously noted, "Such offerings often are a short-term hindrance to upward price progress yet typically result in broader institutional ownership interest." The number of top-rated funds owning its shares rose from 603 in Jun '14 to 665 in Mar '15, a reassuring sign concerning the I criteria.
|
|
|
Color Codes Explained :
Y - Better candidates highlighted by our
staff of experts.
G - Previously featured
in past reports as yellow but may no longer be buyable under the
guidelines.
***Last / Change / Volume data in this table is the closing quote data***
Symbol/Exchange
Company Name
Industry Group |
PRICE |
CHANGE
(%Change) |
Day High |
Volume
(% DAV)
(% 50 day avg vol) |
52 Wk Hi
% From Hi |
Featured
Date |
Price
Featured |
Pivot Featured |
|
Max Buy |
GSBC
-
NASDAQ
Great Southern Bancorp
BANKING - Savings and Loans
|
$39.98
|
+0.77
1.96% |
$40.12
|
28,581
92.20% of 50 DAV
50 DAV is 31,000
|
$41.41
-3.45%
|
4/27/2015
|
$40.94
|
PP = $40.54
|
|
MB = $42.57
|
Most Recent Note - 5/14/2015 6:21:37 PM
Y - Tallied a gain with average volume while rising from support at its 50 DMA line. Recent lows ($38.00 on 5/06/15) define the next important support. See the latest FSU analysis for more details and new annotated graphs.
>>> FEATURED STOCK ARTICLE : Found Reassuring Support at 50-Day Moving Average Line - 5/14/2015 |
View all notes |
Set NEW NOTE alert |
Company Profile |
SEC
News |
Chart |
Request a new note
C
A N
S L
I M |
EPAM
-
NYSE
Epam Systems Inc
COMPUTER SOFTWARE and SERVICES - Information Technology Service
|
$67.70
|
+1.46
2.20% |
$68.05
|
658,861
154.66% of 50 DAV
50 DAV is 426,000
|
$70.49
-3.96%
|
5/18/2015
|
$67.42
|
PP = $70.59
|
|
MB = $74.12
|
 Most Recent Note - 5/18/2015 12:18:08 PM
Y - Color code is changed to yellow with new pivot point based in its 4/13/15 high plus 10 cents. Subsequent volume-driven gains above the pivot point may trigger a new (or ad-on) technical buy signal. Found support last week while consolidating above its 50 DMA line and above prior lows defining near-term support. More damaging losses would raise greater concerns.
>>> FEATURED STOCK ARTICLE : Consolidating Above Support at Prior Highs and 50-Day Moving Average - 5/15/2015 |
View all notes |
Set NEW NOTE alert |
Company Profile |
SEC
News |
Chart |
Request a new note
C
A N
S L
I M |
FLT
-
NYSE
Fleetcor Technologies
DIVERSIFIED SERVICES - Business/Management Services
|
$154.37
|
+0.03
0.02% |
$154.66
|
416,978
76.43% of 50 DAV
50 DAV is 545,600
|
$165.67
-6.82%
|
5/1/2015
|
$155.23
|
PP = $160.50
|
|
MB = $168.53
|
Most Recent Note - 5/18/2015 6:32:13 PM
G - Still sputtering near its 50 DMA line, and its Relative Strength rating has slumped below the 80+ minimum guideline. Technically, it broke out on 4/23/15 with a volume-driven gain for new highs, and healthy stocks rarely fall more than -7% below their pivot point in favorable market environments. See the latest FSU analysis for more details and new annotated graphs.
>>> FEATURED STOCK ARTICLE : Relative Strength Rating Fell While Consolidating Near 50-Day Average - 5/18/2015 |
View all notes |
Set NEW NOTE alert |
Company Profile |
SEC
News |
Chart |
Request a new note
C
A N
S L
I M |
VRX
-
NYSE
Valeant Pharmaceuticals
DRUGS - Drug Manufacturers - Other
|
$225.43
|
+0.80
0.36% |
$228.49
|
1,220,604
55.46% of 50 DAV
50 DAV is 2,201,000
|
$227.76
-1.02%
|
1/5/2015
|
$144.84
|
PP = $149.90
|
|
MB = $157.40
|
Most Recent Note - 5/13/2015 8:26:33 PM
G - Hovering near all-time highs after volume-driven gains. Found prompt support its 50 DMA line recently but it did not form a sound base. Completed a new Public Offering on 3/17/15. Reported earnings +34% on +16% sales revenues for the Mar '15 quarter, an improvement after Dec '14 earnings below the +25% minimum guideline (C criteria).
>>> FEATURED STOCK ARTICLE : Perched at All-Time High Following Volume-Driven Gains - 5/7/2015 |
View all notes |
Set NEW NOTE alert |
Company Profile |
SEC
News |
Chart |
Request a new note
C
A N
S L
I M |
NXPI
-
NASDAQ
Nxp Semiconductors N V
ELECTRONICS - Semiconductor - Broad Line
|
$103.11
|
+0.39
0.38% |
$103.43
|
1,750,331
55.18% of 50 DAV
50 DAV is 3,172,000
|
$108.50
-4.97%
|
4/15/2015
|
$100.75
|
PP = $108.60
|
|
MB = $114.03
|
Most Recent Note - 5/18/2015 6:34:53 PM
Y - Still quietly consolidating just above its 50 DMA line. Little overhead supply remains up through the $108 level. Recent lows near $93.50 define important chart support where more damaging losses may raise concerns and trigger worrisome technical sell signals.
>>> FEATURED STOCK ARTICLE : Rallied Toward Prior Highs Following Earnings News - 5/8/2015 |
View all notes |
Set NEW NOTE alert |
Company Profile |
SEC
News |
Chart |
Request a new note
C
A N
S L
I M |
Symbol/Exchange
Company Name
Industry Group |
PRICE |
CHANGE
(%Change) |
Day High |
Volume
(% DAV)
(% 50 day avg vol) |
52 Wk Hi
% From Hi |
Featured
Date |
Price
Featured |
Pivot Featured |
|
Max Buy |
SWKS
-
NASDAQ
Skyworks Solutions Inc
ELECTRONICS - Semiconductor - Integrated Cir
|
$103.03
|
+5.47
5.61% |
$103.75
|
6,074,717
128.73% of 50 DAV
50 DAV is 4,719,000
|
$102.77
0.25%
|
5/1/2015
|
$97.51
|
PP = $102.87
|
|
MB = $108.01
|
Most Recent Note - 5/18/2015 11:37:57 AM
Y - Challenging its 52-week high with today's gain. Recently found support near its 50 DMA line while building on a riskier "late-stage" base pattern. Gains backed by at least +40% above average volume while rallying above the pivot point may trigger a technical buy signal.
>>> FEATURED STOCK ARTICLE : Found Prompt Support at 50-Day Moving Average Line - 5/4/2015 |
View all notes |
Set NEW NOTE alert |
Company Profile |
SEC
News |
Chart |
Request a new note
C
A N
S L
I M |
AMBA
-
NASDAQ
Ambarella Inc
ELECTRONICS - Semiconductor - Specialized
|
$81.43
|
+1.57
1.97% |
$81.69
|
1,908,770
147.51% of 50 DAV
50 DAV is 1,294,000
|
$79.97
1.83%
|
5/1/2015
|
$75.99
|
PP = $77.49
|
|
MB = $81.36
|
Most Recent Note - 5/18/2015 12:03:56 PM
Y - Perched at its all- time today. Big gain above its pivot point on the prior session backed by +73% above average volume triggered a new (or add-on) technical buy signal. No overhead supply remains to act as resistance.
>>> FEATURED STOCK ARTICLE : Did Not Trigger New Buy Signal But Found Support Near 50 Day Moving Average - 5/12/2015 |
View all notes |
Set NEW NOTE alert |
Company Profile |
SEC
News |
Chart |
Request a new note
C
A N
S L
I M |
AKAM
-
NASDAQ
Akamai Technologies Inc
INTERNET - Internet Software and Services
|
$77.94
|
-0.02
-0.03% |
$78.07
|
1,298,721
89.01% of 50 DAV
50 DAV is 1,459,000
|
$78.44
-0.64%
|
4/20/2015
|
$73.53
|
PP = $73.63
|
|
MB = $77.31
|
Most Recent Note - 5/14/2015 6:23:22 PM
G - Rallied for a new high today with average volume and finished near the session high. Reported earnings +5% on +16% sales revenues for the Mar '15 quarter, below the +25% minimum earnings guideline (C criteria), a fundamental flaw making it a less favorable buy candidate. Prior reports cautioned - "It did not produce gains above the pivot point backed by at least the +40% above average volume necessary to trigger a new (or add-on) technical buy signal. Its 50 DMA line defines near-term support to watch."
>>> FEATURED STOCK ARTICLE : Fundamental Flaw Arose After Sub Par Earnings News - 5/6/2015 |
View all notes |
Set NEW NOTE alert |
Company Profile |
SEC
News |
Chart |
Request a new note
C
A N
S L
I M |
APOG
-
NASDAQ
Apogee Enterprises
MATERIALS and CONSTRUCTION - General Building Materials
|
$56.27
|
+2.05
3.78% |
$56.56
|
197,203
82.17% of 50 DAV
50 DAV is 240,000
|
$55.36
1.64%
|
4/9/2015
|
$49.58
|
PP = $48.13
|
|
MB = $50.54
|
Most Recent Note - 5/18/2015 6:33:56 PM
G - Hit a new 52-week high with today's gain in light volume. It has not formed a sound base, but stubbornly held its ground. Prior highs in the $48 area and its 50 DMA line coincide defining important support to watch on pullbacks.
>>> FEATURED STOCK ARTICLE : Perched Near Its All-Time High, Extended From Prior Base - 5/5/2015 |
View all notes |
Set NEW NOTE alert |
Company Profile |
SEC
News |
Chart |
Request a new note
C
A N
S L
I M |
JLL
-
NYSE
Jones Lang Lasalle Inc
REAL ESTATE - Property Management/Developmen
|
$171.48
|
+3.63
2.16% |
$171.68
|
358,750
122.02% of 50 DAV
50 DAV is 294,000
|
$174.83
-1.92%
|
2/3/2015
|
$156.95
|
PP = $154.66
|
|
MB = $162.39
|
Most Recent Note - 5/14/2015 6:27:30 PM
Y - Color code is changed to yellow after rebounding above its 50 DMA line ($164.90) helping its outlook improve. Earnings rose +147% on +16% sales revenues for the Mar '15 quarter.
>>> FEATURED STOCK ARTICLE : Rebounded Near 50 Day Moving Average Line - 5/13/2015 |
View all notes |
Set NEW NOTE alert |
Company Profile |
SEC
News |
Chart |
Request a new note
C
A N
S L
I M |
Symbol/Exchange
Company Name
Industry Group |
PRICE |
CHANGE
(%Change) |
Day High |
Volume
(% DAV)
(% 50 day avg vol) |
52 Wk Hi
% From Hi |
Featured
Date |
Price
Featured |
Pivot Featured |
|
Max Buy |
PANW
-
NYSE
Palo Alto Networks
Computer Sftwr-Security
|
$157.73
|
+3.01
1.95% |
$158.15
|
855,948
69.93% of 50 DAV
50 DAV is 1,224,000
|
$158.24
-0.32%
|
3/27/2015
|
$146.44
|
PP = $149.45
|
|
MB = $156.92
|
Most Recent Note - 5/14/2015 6:30:31 PM
Y - Its 50 DMA line acted as support during its ongoing advance. Volume totals have been below average while consolidating since triggering a new technical buy signal with a volume-driven gain on 4/21/15. Subsequent damaging losses below the 50 DMA line may trigger a technical sell signal.
>>> FEATURED STOCK ARTICLE : Found Support at 50-Day Moving Average During Ongoing Ascent - 5/11/2015 |
View all notes |
Set NEW NOTE alert |
Company Profile |
SEC
News |
Chart |
Request a new note
C
A N
S L
I M |
|
|
|
THESE ARE NOT BUY RECOMMENDATIONS!
Comments contained in the body of this report are technical
opinions only. The material herein has been obtained
from sources believed to be reliable and accurate, however,
its accuracy and completeness cannot be guaranteed.
This site is not an investment advisor, hence it does
not endorse or recommend any securities or other investments.
Any recommendation contained in this report may not
be suitable for all investors and it is not to be deemed
an offer or solicitation on our part with respect to
the purchase or sale of any securities. All trademarks,
service marks and trade names appearing in this report
are the property of their respective owners, and are
likewise used for identification purposes only.
This report is a service available
only to active Paid Premium Members.
You may opt-out of receiving report notifications
at any time. Questions or comments may be submitted
by writing to Premium Membership Services 665 S.E. 10 Street, Suite 201 Deerfield Beach, FL 33441-5634 or by calling 1-800-965-8307
or 954-785-1121.
|
|
|